. 2023 Nov;15(720):eadi1617.
doi: 10.1126/scitranslmed.adi1617. Epub 2023 Nov 1.

Intrathecal delivery of nanoparticle PARP inhibitor to the cerebrospinal fluid for the treatment of metastatic medulloblastoma

Affiliations

Intrathecal delivery of nanoparticle PARP inhibitor to the cerebrospinal fluid for the treatment of metastatic medulloblastoma

Minsoo Khang et al. Sci Transl Med. 2023 Nov.

Abstract

The morbidity associated with pediatric medulloblastoma, in particular in patients who develop leptomeningeal metastases, remains high in the absence of effective therapies. Administration of substances directly into the cerebrospinal fluid (CSF) is one approach to circumvent the blood-brain barrier and focus delivery of drugs to the site of tumor. However, high rates of CSF turnover prevent adequate drug accumulation and lead to rapid systemic clearance and toxicity. Here, we show that PLA-HPG nanoparticles, made with a single-emulsion, solvent evaporation process, can encapsulate talazoparib, a PARP inhibitor (BMN-673). These degradable polymer nanoparticles improve the therapeutic index when delivered intrathecally and lead to sustained drug retention in the tumor as measured with PET imaging and fluorescence microscopy. We demonstrate that administration of these particles into the CSF, alone or in combination with systemically administered temozolomide, is a highly effective therapy for tumor regression and prevention of leptomeningeal spread in xenograft mouse models of medulloblastoma. These results provide a rationale for harnessing nanoparticles for the delivery of drugs limited by brain penetration and therapeutic index and demonstrate important advantages in tolerability and efficacy for encapsulated drugs delivered locoregionally.


Conflict of interest statement

Competing interests

MK, RSB, and WMS are inventors on a patent application describing intrathecal administration of nanoparticles for treating cancer (Title: INTRATHECAL NANOPARTICLE DELIVERY FOR TREATMENT OF LEPTOMENINGEAL TUMORS, U.S. Patent Application No. 63/383,211). RSB and WMS are co-founders of B3 Therapeutics. WMS is a consultant to Xanadu Bio, B3 Therapeutics, Stradefy Biosciences, Johnson & Johnson, Celanese, Cranius, and CMC Pharma. RSB is a consultant to Cybrexa therapeutics, Alphina therapeutics, Modifi bio, Sage Biosciences (SAB), and Aprea (SAB). The rest of the authors declare that they have no competing interests.

Figures
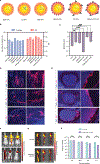
Figure 1 |
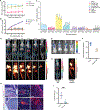
Figure 1 |. NP characteristics, distribution in the brain and spinal cord.
(A) Nanoparticle platform consists of a poly(lactic acid) (PLA) core surrounded by a hyperbranched polyglycerol (HPG) shell. PDLLA-Cy5 (represented by blue stars in the diagram) can be incorporated in the core for fluorophore imaging. The PLA core can be loaded with BMN-673 drug (represented by purple ovals). The HPG shell can be modified to an aldehyde-rich surface (represented by purple circles) or functionalized with DFO-mesylate (represented by red circles) for 89Zr labeling. (B) Mean dynamic light scattering measurements with standard deviation (s.d.) of hydrodynamic diameters and polydispersity index (PDI) of NPs in deionized (DI) water (n=3). (C) Mean zeta potential of NPs with s.d. (n=3). (D) Representative coronal head sections of mice showing DAPI and localization of Cy5-NPs in the olfactory epithelium, the forebrain, and the pontocerebellar region (from top to bottom), 48 h after intrathecal (IT) administration (n=5), with scale bar = 500 μm (left column) and 50 μm (right column). (E) Representative spinal cord sections of the cervical, thoracic, and lumbar regions 48 h after IT administration (n=5), with scale bar as 500 μm (left column) and 50 μm (right column). (F) J:Nu mice (n=6) were administered Cy5-NPs by a CM implanted catheter. Fluorescence images of the whole body were taken 3 h and 48 h after administration. (G) In vivo imaging system IVIS) images of Cy5-NPs and aldehyde Cy5-NPs in ex vivo organs at 24 h, 5 d, and 7 d post administration by a CM implanted catheter in J:Nu mice, shown with radiant efficiency (p/sec/cm2/sr/(PW/cm2)). (H) Comparison of the Cy5 cranial radiance intensity (p/sec/cm2/sr) as measured by IVIS between the two NP formulations at 3 h, 24 h, 5 d and 7 d., same mice as (F) and (G). No statistically significant difference in signal intensity at any time point as measured by one-way ANOVA.
Figure 2 |
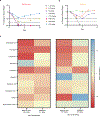
Figure 2 |. PET/CT of [89Zr]Zr-DFO-NPs and [89Zr]Zr-DFO delivered i.c.m. in tumor-free mice:
(A-B) Healthy BALB/C mice were injected by IT administration with either [89Zr]Zr-DFO-NP or [89Zr]Zr-DFO and imaged continuously for 2 hours (h) (n=2); (A) Pharmacokinetic curve in the central nervous system of [89Zr]Zr-DFO-NP and [89Zr]Zr-DFO, *P=0.0243; (B) Pharmacokinetic curve in the brain and spinal cord separately of [89Zr]Zr-DFO-NPs and [89Zr]Zr-DFO, ****P <0.0001 (brain), ns (spinal cord). ns = not significant, P > 0.05. (C) Whole-body sagittal plane PET images of continuous dynamic scan over 2 h for [89Zr]Zr-DFO and [89Zr]Zr-DFO-NPs. (D) Biodistribution at various timepoints from 3 h to 12 days (d) after [89Zr]Zr-DFO-NPs injection into healthy mice (n=4 for 4 d, 7 d, 12 d, and n=8 for 3 h, 24 h). Percent total is calculated as activity in region-of-interest over total injected activity. E, Top row: representative fused PET/CT images of mice at maximum intensity projection at 3 h, 24 h, 4 d, 7 d, 12 d after [89Zr]Zr-DFO-NP injection through CM. Bottom row: whole-body sagittal plane PET images of CNS only, equally scaled according to the color bar. (A,B,D), Data shown as the mean +/− s.d.;.
Figure 3 |
Figure 3 |. [89Zr]Zr-DFO-NPs accumulate preferentially in tumors.
(A,B), J:Nu mice inoculated with DAOY cells were injected by IT with [89Zr]Zr-DFO-NPs 3 weeks after inoculation and imaged continuously for 2 h (n=2). (A) Pharmacokinetic curve of [89Zr]Zr-DFO-NPs in the brain, spinal cord, and tumor site of tumor-bearing mice. (B) Pharmacokinetic curve of mouse cervical lymph nodes, bladder, and liver. (C) Biodistribution at various timepoints from 6 hours (h) to 21 days (d) after [89Zr]Zr-DFO-NPs in tumor-bearing mice (n=4). Percent total is calculated as activity in ROI over total injected activity. (D) Top row: representative fused PET/CT images of maximum intensity projection (MIP) at 6 h, 24 h, 4 d, 7 d, 12 d, 21 d after [89Zr]Zr-DFO-NP injection through CM. Bottom row: whole-body sagittal plane PET images, equally contrasted according to arrow bar. (E) in vivo fluorescent images (p/sec/cm2/sr) of luciferase-labeled tumor cells inoculated in mice 10 days prior to [89Zr]Zr-DFO-NP administration and PET/CT imaging. (F) Quantified bioluminescence intensity (p/sec/cm2/sr) of brain and spinal cord tumor signal from mice in E. (G) PET/CT MIP and sagittal plane PET image at day 21 with a 10X lower SUV intensity scale for visualization purposes. (H) H&E stains of cerebellum tumor and corresponding DAPI (blue)-stained images of Cy5-NPs (red) at 10X and 40X magnification. Scale bars = 500 μM (two left columns) and 25 μM (right column). (I) Quantification of Cy5-NP area fraction in 10 representative sections of whole brain of mice with or without tumors 24 hours after administration (n=5), *** P <0.001, one-way ANOVA.
Figure 4 |
Figure 4 |. Cy5-NPs colocalize with resident macrophages and infiltrating macrophages in the tumor, and colocalize with meningeal lymphatics, blood vessels, and immune cells in the meninges.
(A-B) Cy5-labeled NPs (blue) colocalize with Iba1 stained macrophages (red) and F4/80-stained macrophages (green). F4/80-stained macrophages and Cy5-labeled NPs are observed predominantly in the tumor microenvironment (unlabeled), whereas Iba1 stained macrophages are observed throughout the brain parenchyma. Representative images from a single experiment consisting of four biological replicates per group are displayed in (A) and (B), with (B) providing a more detailed view of the same region. (A) Scale bars = 100 μm. (B) scale bar = 50 μm. (C) Cy5-labeled NPs (blue) line the choroid plexus in the 3rd ventricle, with no colocalization with F4/80-stained macrophages and Iba1 stained resident macrophages in the brain parenchyma. Scale bar = 200 μm. (D-E) Representative images of the whole meninges (D), and close-up of mice (E) 48 h after administration of Cy5-NPs (blue) co-labeled with LYVE-1 (red) and CD31 (green) (n=4). (D) Scale bars = 100 mm. (E) Scale bar = 100 μm. (F-G) Representative images of the transverse sinus (F), and close-up (G) 48 h after administration of Cy5-NPs (blue) co-labeled with LYVE-1 (red) and CD45 (green). (F) Scale bar = 1 mm. (G) Scale bar = 100 μm.
Figure 5 |
Figure 5 |. Toxicity of BMN-673 free drug and (BMN)NPs in mice.
(A-B) Tolerability of various doses of free BMN-673 and (BMN)NPs in non-tumor bearing J:Nu mice was assessed by monitoring body weight and overall health conditions after a single IT treatment. The dose was administered to one mouse first, and if tolerated, was expanded to n=5. Black asterisk indicates animals that died or were sacrificed due to excessive weight loss. (A) Free BMN-673 was lethal at any dose at or higher than 0.06 mg/kg. Animals experienced weight loss less than 15% at 0.05 mg/kg. (B) (BMN)NPs was lethal at 1.25 mg/kg, but at lower doses weight loss was not greater than 10%. (C) J:Nu mice were treated with BMN-673 or (BMN)NPs at the MTD, and complete blood cell counts, differential white blood cell counts, and platelet cell counts were performed to evaluate hematological toxicity. For this study, n=6 for each group.
Figure 6 |
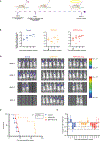
Figure 6 |. Tumor inhibition of BMN-673 and (BMN)NPs with single dose in MB mouse xenograft.
(A) Timeline for the inoculation and treatment of DAOY tumor models. J:nu mice were implanted with tumor through a CM catheter, then treated using the same catheter with either free BMN-673 (0.05 mg/kg at one dose) or (BMN)NPs (0.25 mg/kg at one dose). Two mice were removed from overall study due to no observable tumor growth. Log-rank test, followed by repeated-measures ANOVA *** P <0.001. (B) Region-of-interest analysis of bioluminescence intensities (p/sec/cm2/sr) from whole brain of the course of 4 weeks. (C) Whole body bioluminescence images of DAOY tumor bearing mice taken at the end of each week. Bioluminescence scale (p/sec/cm2/sr) for 1st row is different from all remaining images. (D) Survival curves for BMN-673 treated, (BMN)NP treated, and control mice (n=6 per group, one mouse removed from control and BMN free group for no tumor growth). (E) Change in body weights of all groups. Data presented as mean +/− s.d.
Figure 7 |
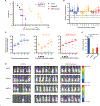
Figure 7 |. Tumor inhibition and anti-metastatic capacity of (BMN)NPs with repeat dosing in the MB mouse xenograft.
(A) Survival curves for BMN-673 treated (n=7), (BMN)NP treated (n=8), and control J:Nu mice (n = 9). Log-rank test, followed by repeated-measures ANOVA **** P <0.0001 (B) Change in body weights of all groups. Data presented as mean +/− s.d. (C) Region-of-interest analysis of bioluminescence intensities (p/sec/cm2/sr) from whole brain. (D) Percentage of mice with observable leptomeningeal spread through IVIS by 14 days post inoculation (n=16 for control, n=10 for NP and free). **** P <0.0001, *P < 0.05, one-way ANOVA. Bioluminesence images can be found in Figure S7, (A. E) Whole body bioluminescence images of DAOY tumor bearing mice. Bioluminescence scale is different for first 2 rows versus last 2 rows.
Figure 8 |
Figure 8 |. Tumor inhibition and anti-metastatic capacity of (BMN)NPs + TMZ in D341 tumor model mice:
(A) Whole body bioluminescence images of J:Nu mice inoculated with D341 cells over 4 weeks. Bioluminescence scale (p/sec/cm2/sr) is different for first 2 rows versus last 2 rows. (B) Survival curves for BMN-673 treated (n=7), (BMN)NP treated (n=9), (BMN)NP + TMZ treated (n=8), and control mice (n =8). Log-rank test, followed by repeated-measures ANOVA **** P <0.0001. (C) Change in body weights of all groups. Data presented as mean +/− s.d.

References

    1. Rutkowski S, Cohen B, Finlay J, Luksch R, Ridola V, Valteau-Couanet D, Hara J, Garre ML, Grill J, Medulloblastoma in young children, Pediatr. Blood Cancer 54, 635–637 (2010). - PubMed
    1. Gilbertson RJ, Ellison DW, The origins of medulloblastoma subtypes, Annu. Rev. Pathol. 3, 341–365 (2008). - PubMed
    1. Kann BH, Park HSM, Lester-Coll NH, Yeboa DN, Benitez V, Bindra RS, Khan AJ, Marks AM, Roberts KB, Adjuvant Radiation Therapy Patterns and Survival Implications for Medulloblastoma in Young Children, Int. J. Radiat. Oncol 96, 1574–1581 (2016). - PubMed
    1. Koschmann C, Bloom K, Upadhyaya S, Geyer JR, Leary SES, Survival After Relapse of Medulloblastoma, J. Pediatr. Hematol. Oncol. 38, 269–273 (2016). - PubMed
    1. Zapotocky M, Mata-Mbemba D, Sumerauer D, Liby P, Lassaletta A, Zamecnik J, Krskova L, Kyncl M, Stary J, Laughlin S, Arnoldo A, Hawkins C, Tabori U, Taylor MD, Bouffet E, Raybaud C, Ramaswamy V, Differential patterns of metastatic dissemination across medulloblastoma subgroups, J. Neurosurg. Pediatr. 21, 145–152 (2018). - PubMed

Substances