. 2023 Nov 3;9(44):eadh2284.
doi: 10.1126/sciadv.adh2284. Epub 2023 Nov 1.

Severe acute malnutrition promotes bacterial binding over proinflammatory cytokine secretion by circulating innate immune cells

Affiliations

Severe acute malnutrition promotes bacterial binding over proinflammatory cytokine secretion by circulating innate immune cells

Tracy N Phiri et al. Sci Adv. .

Abstract

Children with severe acute malnutrition (SAM) have high infectious mortality and morbidity, implicating defects in their immune defenses. We hypothesized that circulating innate immune cells from children (0 to 59 months) hospitalized with SAM in Zambia and Zimbabwe (n = 141) have distinct capacity to respond to bacteria relative to adequately nourished healthy controls (n = 92). SAM inpatients had higher neutrophil and monocyte Escherichia coli binding capacity but lower monocyte activation and proinflammatory mediator secretion in response to lipopolysaccharide or heat-killed Salmonella typhimurium than controls. Among SAM cases, wasting severity was negatively associated with cytokine secretion, children with HIV had lower monocyte activation, and the youngest children released the least myeloperoxidase upon stimulation. Inpatient bacterial binding capacity and monocyte activation were associated with higher odds of persistent SAM at discharge, a risk factor for subsequent mortality. Thus, SAM shifts innate immune cell function, favoring bacterial containment over proinflammatory activation, which may contribute to health deficits after discharge.


Figures
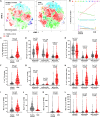
Fig. 1.
Fig. 1.. Circulating neutrophils and monocytes from children with SAM have enhanced bacterial binding capacity compared to healthy controls.
(A) tSNE plot of 500 E. coli+ single leukocytes per sample clustered by cell surface marker expression (Lin, CD66b, CD14, CD16, and HLA-DR) and color-coded by FlowSOM clusters 1 to 10 (more detail in fig. S4) for the healthy control (left; n = 81) and SAM groups (right; n = 137). (B) Percentage distribution of FlowSOM clusters for E. coli+ leukocytes from healthy controls versus SAM cases. (C) Total E. coli+ single leukocyte count, (D) leukocyte subtypes as a percentage of total E. coli+ leukocytes, and (E) monocyte subsets as a percentage of total E. coli+ monocytes by healthy control (gray) versus SAM group (red) from hierarchical gating analysis. E. coli+ percentage of (F) total single leukocytes, (G) leukocyte subtypes, and (H) monocyte subsets. E. coli mean AF488 fluorescence intensity (meanFI) for (I) neutrophils, (J) mixed lymphocytes, (K) total monocytes, and (L) monocyte subsets. Violin plots indicate median (dark line) and IQR (dashed lines); coefficients (Coef.) and P values are reported for unadjusted univariable negative binomial regression of event counts (C), fractional regression of proportions (E and D to H), and linear regression of meanFI (I to L) by SAM status.
Fig. 2.
Fig. 2.. SAM compromises monocyte maturation and proinflammatory mediator secretion in response to bacterial PAMP.
Whole-blood samples from children with SAM (red) and healthy controls (gray) were incubated for 24 hours in medium alone, LPS, or HKST; cultured cells were analyzed by flow cytometry (A to D; healthy controls, n = 88; SAM, n = 136), and culture supernatants were analyzed by ELISA (E and F; healthy controls, n = 91; SAM, n = 136). (A) Flow cytometry gating of total monocytes after exclusion of cells expressing markers of lymphocyte (Lin+) and granulocyte (CD66b+) lineage; representative example. PAMP-induced medianFI of (B) ΔHLA-DR-PECy7, (C) ΔCD86-FITC, and (D) ΔCD40-PerCP-Cy5.5 of total monocytes after subtraction of medianFI of monocytes in unstimulated cultures. (E) LPS-induced and (F) HKST-induced ΔIL-6, ΔIL-8, ΔTNFα, and ΔMPO after subtraction of concentrations in supernatants from unstimulated cultures; the percentage of children in each group who produced mediator concentrations greater than those present in unstimulated cultures (i.e., responders) are indicated. Violin plots indicate median (dark line) and IQR (dashed lines); unadjusted coefficients (Coef.) and P values are reported for univariable tobit regression by group.
Fig. 3.
Fig. 3.. Monocytes and neutrophils of children with SAM prioritize bacterial containment over systemic immune activation.
(A) Factor loadings for all antibacterial innate immune function variables included in a PCA (126 children with SAM and 73 healthy controls with full data on all variables). Table color-coded by strength and direction of association between the original variables and the resulting PC, with red indicating positive (bold for coefficient ≥ 0.3) and blue negative (bold for coefficient ≤ −3) association. Percentages correspond to the amount of variance in the dataset accounted for by each PC. Functional interpretation reflects the combination of the original variables captured by each PC. Scores for (B) PC1, (C) PC2, (D) PC3, (E) PC4, and (F) PC5 for each child in the SAM (red) and healthy control (gray) groups. Violin plots indicate median (dark line) and IQR (dashed lines); adjusted coefficients (Adj. Coef.) and P values are reported for multivariable linear regression by SAM status, adjusting for sex, age group, HIV infection status, hospital site, and immunoassay on the day of discharge.
Fig. 4.
Fig. 4.. SAM differentiates innate antibacterial immune cell function from healthy controls among HIV-negative children and among children who had immune assessment at different times during hospitalization.
Scores for PC1, PC2, PC3, PC4, and PC5 for (A) HIV-negative children in the healthy control (n = 46; gray) and SAM (n = 101; red) groups, (B) all healthy controls (n = 73) and SAM cases assessed before their day of discharge (n = 75), and (C) all healthy controls (n = 73) and SAM cases assessed on their day of discharge (n = 51). Violin plots indicate median (dark line) and IQR (dashed lines); adjusted coefficients (Adj. Coef.) and P values are reported for multivariable linear regression by SAM status, adjusting for variation due to sex, age group, hospital site, and immunoassay on the day of discharge (A) or sex, age group, hospital site, and HIV infection status (B and C).
Fig. 5.
Fig. 5.. Clinical and demographic variables associated with adverse clinical outcomes from SAM shape some antibacterial innate immune cell functions.
(A) PC2 (antibacterial inflammatory cytokines) scores plotted against MUAC (millimeters), (B) PC3 (antibacterial monocyte activation) scores plotted by HIV status, and (C) PC4 (antibacterial MPO) plotted by participant age group for the SAM group (n = 109). Adjusted coefficients (Adj. Coef.) and P values are reported for multivariable cross-partialing out lasso linear regression of PC scores by clinically relevant patient characteristics, adjusting for other clinically relevant variables (baseline edema and presence of any symptom of infection at the time of immune function assessment) and model-selected controls. Only exposure variables where there was evidence for an effect on immune function are shown; full analysis is provided in Table 2.
Fig. 6.
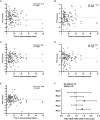
Fig. 6.. Antibacterial innate immune cell function of children with SAM converges toward that of healthy controls during inpatient rehabilitation and is associated with persistent SAM at hospital discharge.
Cross-sectional scores for (A) PC1, (B) PC2, (C) PC3, (D) PC4, and (E) PC5 for children with SAM (n = 120) plotted against the time between their initial clinical assessment at hospital admission and immune function assessment (days); adjusted coefficients (Adj. Coef.) and P values are reported for multivariable linear regression by time to immunoassay, adjusted for hospital site, HIV infection status, edema status at baseline, symptom/s of infection on the day of blood sampling, and immunoassay on the day of discharge. (F) Odds ratios for persistent SAM at discharge among children who had immune function assessment before the day of discharge (n = 66); logistic regression, adjusted for variation due to sex, age group at baseline, HIV infection status, hospital site, edema at baseline, and baseline MUAC.

References

    1. UNICEF, WHO, World Bank, Levels and Trends in Child Malnutrition: UNICEF/WHO/The World Bank Group Joint Child Malnutrition Estimates: Key Findings of the 2021 Edition (WHO, 2021).
    1. WHO, Guideline: Updates on the Management of Severe Acute Malnutrition in Infants and Children (WHO, 2013). - PubMed
    1. G. WHO, Management of the Child with a Serious Infection or Severe Malnutrition: Guidelines for Care at the First-Referral Level in Developing Countries (WHO, 2000).
    1. Karunaratne R., Sturgeon J. P., Patel R., Prendergast A. J., Predictors of inpatient mortality among children hospitalized for severe acute malnutrition: A systematic review and meta-analysis. Am. J. Clin. Nutr. 112, 1069–1079 (2020). - PMC - PubMed
    1. Sharrow D., Hug L., You D., Alkema L., Black R., Cousens S., Croft T., Gaigbe-Togbe V., Gerland P., Guillot M., Hill K., Masquelier B., Mathers C., Pedersen J., Strong K. L., Suzuki E., Wakefield J., Walker N.; UN Inter-agency Group for Child Mortality Estimation and its Technical Advisory Group , Global, regional, and national trends in under-5 mortality between 1990 and 2019 with scenario-based projections until 2030: A systematic analysis by the UN Inter-agency Group for Child Mortality Estimation. Lancet Glob. Health 10, e195–e206 (2022). - PMC - PubMed