. 2023 Nov 21;4(11):101260.
doi: 10.1016/j.xcrm.2023.101260. Epub 2023 Oct 31.

Combining clinical notes with structured electronic health records enhances the prediction of mental health crises

Affiliations

Combining clinical notes with structured electronic health records enhances the prediction of mental health crises

Roger Garriga et al. Cell Rep Med. .

Abstract

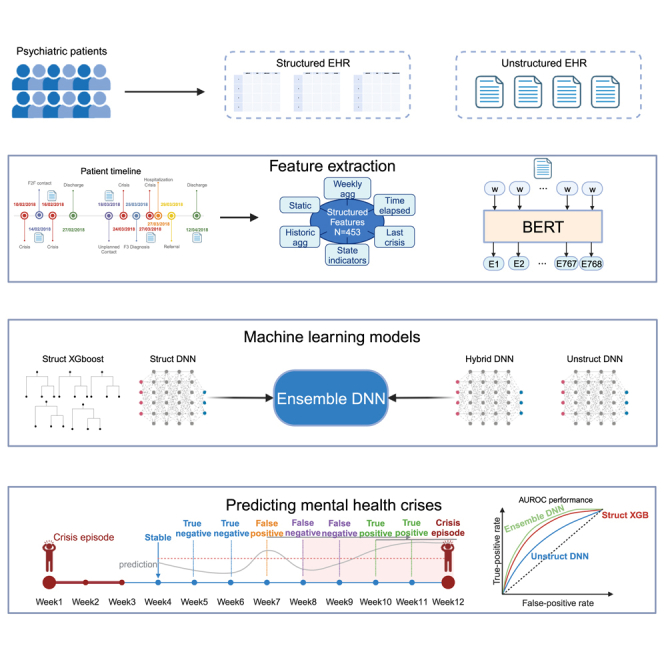
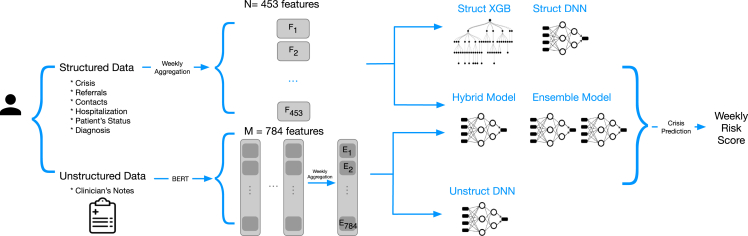
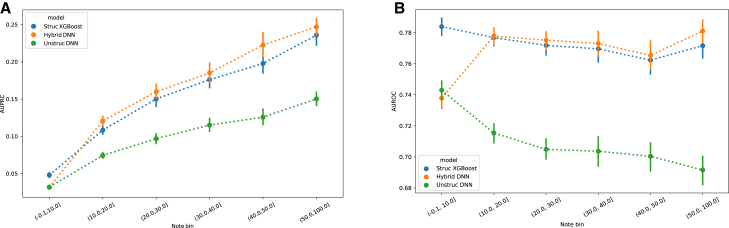
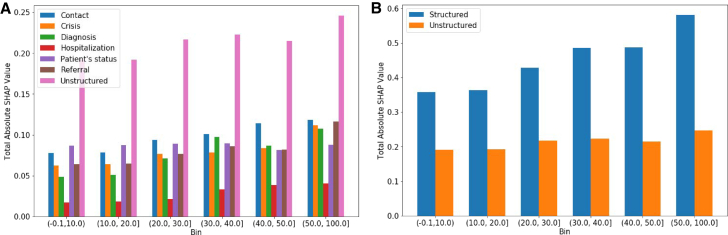
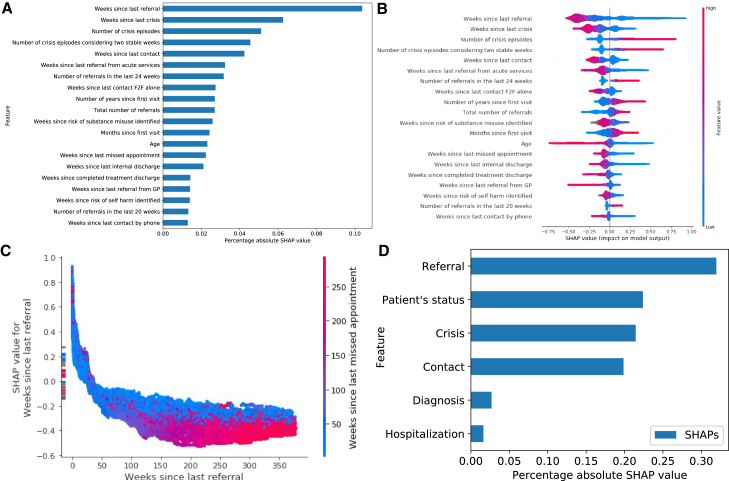
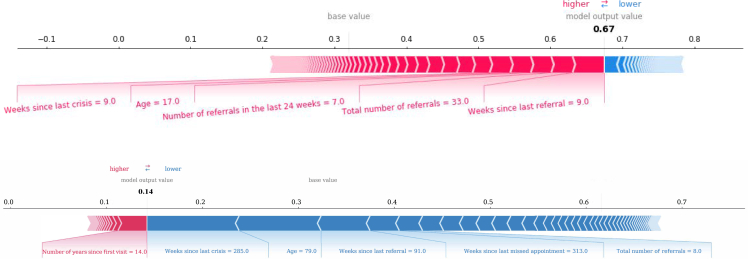
An automatic prediction of mental health crises can improve caseload prioritization and enable preventative interventions, improving patient outcomes and reducing costs. We combine structured electronic health records (EHRs) with clinical notes from 59,750 de-identified patients to predict the risk of mental health crisis relapse within the next 28 days. The results suggest that an ensemble machine learning model that relies on structured EHRs and clinical notes when available, and relying solely on structured data when the notes are unavailable, offers superior performance over models trained with either of the two data streams alone. Furthermore, the study provides key takeaways related to the required amount of clinical notes to add value in predictive analytics. This study sheds light on the untapped potential of clinical notes in the prediction of mental health crises and highlights the importance of choosing an appropriate machine learning method to combine structured and unstructured EHRs.

Keywords: AI; electronic health records; machine learning; mental health; natural language processing; predictive analytics.


Conflict of interest statement

Declaration of interests Koa Health (formerly Telefonica Innovation Alpha) has provided financial resources to support the realization of this project. All authors were employees of Telefonica Innovation Alpha (now, R.G., J.G., and A.M. are employees of Koa Health S.L.), and they received salary support during the realization of the study. The funders of the study had no role in the design, data analysis and model development, interpretation of the results, writing, and reviewing of the manuscript.

Figures

None
Graphical abstract
Figure 1
Figure 1
Diagram of the five trained models and the data types used as input Struct XGB is an XGBoost model, and the rest are feedforward neural networks, with Ensemble DNN combining the results of a neural network trained on structured data only and a neural network trained on structured and unstructured data.
Figure 2
Figure 2
Clinical notes available for at least 10% of weeks improve the model’s performance (A) AUPRC of the structured only model (Struct XGBoost), unstructured only model (Unstruct DNN), and structured and unstructured (combined) model (Hybrid DNN). Points and lines indicate mean and ± standard deviation values computed in the 52 weeks of the test set. (B) AUROC of Struct XGBoost, Unstruct DNN, and Hybrid DNN. Points and lines indicate mean and ± standard deviation values computed in the 52 weeks of the test set.
Figure 3
Figure 3
Overall contribution of the different data categories per subgroup of patients based on the percentage of weeks with unstructured data (A) The total absolute SHAP values for the Hybrid DNN extracted on the test set across the different datasets obtained based on the percentage of notes available from the patients. (B) The total absolute SHAP values for the Hybrid DNN for structured and unstructured feature categories extracted on the test set across the different datasets obtained based on the percentage of notes available from the patients.
Figure 4
Figure 4
Most influential predictors derived from structured data (A) The most impactful features on prediction based on the absolute SHAP values (ranked from the most to the least important). (B) The distribution of the impact of each feature on the model output. The colors reflect the numerical value of the features: red represents larger values, while blue represents smaller values. The line is made of individual dots representing each crisis, and the thickness of the line is determined by the number of examples at a given value (for example, most patients have a low number of severe crises). A positive SHAP value (extending to the right) indicates an increased probability of a crisis prediction; symmetrically, a negative SHAP value (extending to the left) indicates a reduced probability. (C) Shows the dependence plot of the top predictive feature in terms of SHAP values. The plot represents a scatterplot that shows the effect a single feature has on the predictions made by the model, where the x axis is the value of the feature, the y axis is the SHAP value for that feature, and the color corresponds to a second feature that may have an interaction effect with the feature we are plotting. The longer the time since the last referral and the longer the time since the last missed appointment, the lower the probability that the model will predict a crisis. (D) The most impactful categories of features based on the total absolute SHAP values per category.
Figure 5
Figure 5
Composition of individualized predictions for two patients The coloring displays whether the feature contributed positively (red) or negatively (blue) to the probability computed by the model. (A) Example of predicting a high risk for a crisis, mainly driven by the values of the weeks since last crisis and last referral, age and number of total referrals, as well as number of referrals in the last 24 weeks. (B) Example of a low risk to have a crisis, driven mainly by a high number of weeks since the last referral, high number of weeks since the last crisis, and high number of weeks since the last contact.

References

    1. Patel V., Saxena S., Lund C., Thornicroft G., Baingana F., Bolton P., Chisholm D., Collins P.Y., Cooper J.L., Eaton J., et al. The Lancet Commission on global mental health and sustainable development. Lancet. 2018;392:1553–1598. doi: 10.1016/S0140-6736(18)31612-X. - DOI - PubMed
    1. GBD 2019 Mental Disorders Collaborators National burden of 12 mental disorders in 204 countries and territories, 1990–2019: a systematic analysis for the Global Burden of Disease Study 2019 (2022) Lancet Psychiatr. 2022;9:137–150. doi: 10.1016/S2215-0366(21)00395-3. - DOI - PMC - PubMed
    1. Wiens K., Bhattarai A., Pedram P., Dores A., Williams J., Bulloch A., Patten S. A growing need for youth mental health services in Canada: examining trends in youth mental health from 2011 to 2018. Epidemiol. Psychiatr. Sci. 2020;29:e115. doi: 10.1017/S2045796020000281. - DOI - PMC - PubMed
    1. Keynejad R., Spagnolo J., Thornicroft G. WHO mental health gap action programme (mhGAP) intervention guide: updated systematic review on evidence and impact. Evid. Base Ment. Health. 2021;24:124–130. doi: 10.1136/ebmental-2021-300254. - DOI - PMC - PubMed
    1. Olfson M. Building The Mental Health Workforce Capacity Needed To Treat Adults With Serious Mental Illnesses. Health Aff. 2016;35:983–990. doi: 10.1377/hlthaff.2015.1619. - DOI - PubMed

Publication types