. 2023 Nov;11(11):e007870.
doi: 10.1136/jitc-2023-007870.

Quantifying the impact of immunotherapy on RNA dynamics in cancer

Affiliations

Quantifying the impact of immunotherapy on RNA dynamics in cancer

Ieva Usaite et al. J Immunother Cancer. 2023 Nov.

Abstract

Background: Checkpoint inhibitor (CPI) immunotherapies have provided durable clinical responses across a range of solid tumor types for some patients with cancer. Nonetheless, response rates to CPI vary greatly between cancer types. Resolving intratumor transcriptomic changes induced by CPI may improve our understanding of the mechanisms of sensitivity and resistance.

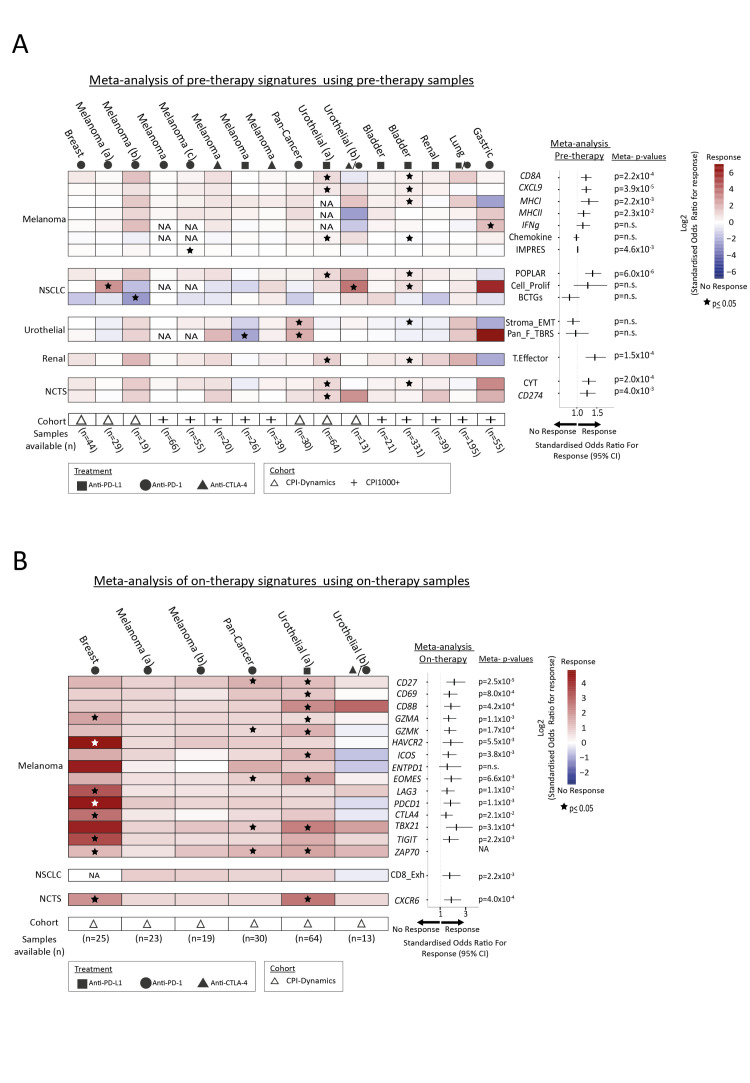
Methods: We assembled a cohort of longitudinal pre-therapy and on-therapy samples from 174 patients treated with CPI across six cancer types by leveraging transcriptomic sequencing data from five studies.

Results: Meta-analyses of published RNA markers revealed an on-therapy pattern of immune reinvigoration in patients with breast cancer, which was not discernible pre-therapy, providing biological insight into the impact of CPI on the breast cancer immune microenvironment. We identified 98 breast cancer-specific correlates of CPI response, including 13 genes which are known IO targets, such as toll-like receptors TLR1, TLR4, and TLR8, that could hold potential as combination targets for patients with breast cancer receiving CPI treatment. Furthermore, we demonstrate that a subset of response genes identified in breast cancer are already highly expressed pre-therapy in melanoma, and additionally we establish divergent RNA dynamics between breast cancer and melanoma following CPI treatment, which may suggest distinct immune microenvironments between the two cancer types.

Conclusions: Overall, delineating longitudinal RNA dynamics following CPI therapy sheds light on the mechanisms underlying diverging response trajectories, and identifies putative targets for combination therapy.

Keywords: gene expression profiling; immune checkpoint inhibitors; immunotherapy; translational medical research.


Conflict of interest statement

Competing interests: DB reports personal fees from NanoString and AstraZeneca, and has a patent PCT/GB2020/050221 issued on methods for cancer prognostication. KD provides consultancy services to Achilles Therapeutics. YW consults for PersonGen Biotherapeutics and E15 VC. MK received research funding paid to the institute from BMS, Roche, AstraZeneca, has advisory roles compensated to the institute for: Daiichi Sankyo, BMS, MSD, Novartis, Roche outside the submitted work, and speakers’ fee paid to the institute from: Roche, BMS and Gilead. CS acknowledges grant support from AstraZeneca, Boehringer-Ingelheim, Bristol Myers Squibb, Pfizer, Roche-Ventana, Invitae (previously Archer Dx Inc—collaboration in minimal residual disease sequencing technologies) and Ono Pharmaceutical. CS is an AstraZeneca Advisory Board member and chief investigator for the AZ MeRmaiD 1 and 2 clinical trials, and is also co-chief investigator of the NHS Galleri trial, funded by GRAIL, and a paid member of GRAIL’s Scientific Advisory Board. He receives consultant fees from Achilles Therapeutics (where he is also a Scientific Advisory Board member), Bicycle Therapeutics (where he is also a Scientific Advisory Board member), Genentech, Medicxi, Roche Innovation Centre—Shanghai, Metabomed (until July 2022) and the Sarah Cannon Research Institute, had stock options in Apogen Biotechnologies and GRAIL until June 2021, currently has stock options in Epic Bioscience and Bicycle Therapeutics, and has stock options in and is co-founder of Achilles Therapeutics. CS is an inventor on a European patent application relating to assay technology to detect tumor recurrence (PCT/GB2017/053289); the patent has been licensed to commercial entities and under his terms of employment CS is due a revenue share of any revenue generated from such license(s). CS holds patents relating to targeting neoantigens (PCT/EP2016/059401), identifying clinical response to immune checkpoint blockade (PCT/EP2016/071471), determining HLA loss of heterozygosity (PCT/GB2018/052004), predicting survival rates of patients with cancer (PCT/GB2020/050221), identifying patients whose cancer responds to treatment (PCT/GB2018/051912), detecting tumor mutations (PCT/US2017/28013), methods for lung cancer detection (US20190106751A1), and identifying insertion/deletion mutation targets (European and US, PCT/GB2018/051892), and is co-inventor to a patent application to determine methods and systems for tumor monitoring (PCT/EP2022/077987). CS is a named inventor on a provisional patent protection related to a ctDNA detection algorithm.

Figures

Figure 1
Figure 1
Meta-analysis of RNA signatures associated with CPI response. (A) Pre-therapy meta-analysis. Pre-therapy-derived signatures are shown as rows and individual cohorts within the “CPI∆ plus CPI1000+” cohorts as columns; studies in which each cohort was included are indicated (∆=CPI∆; +=CPI1000+; bottom of the heatmap). (B) On-therapy meta-analysis. Here on-therapy-derived signatures are shown as rows and individual cohorts within the CPI∆ cohort as columns. The heatmaps indicates the effect size of each signature in each cohort, measured using the log2 odds ratio (OR) for response versus non-response (RECIST criteria), derived from logistic regression. Red represents an association with response, blue an association with non-response, and significance indicated with an asterisk. Both cohort size (bottom of the heatmap) and drug received (top of the heatmap) are indicated. Signatures are split into the cancer type in which they were derived (left of heatmaps; melanoma, non-small-cell lung cancer (NSCLC), urothelial; renal; NCTS (non-cancer-type-specific)). The forest plots on the right display the overall effect size and significance (p values) of each signature in the meta-analysis across all studies, based on the effect sizes and SEs from each individual cohort. A random-effects model was used for the meta-analysis to account for different cancer types .
Figure 2
Figure 2
Dynamics of RNA signatures pre-therapy and on-therapy. (A–D) Longitudinal expression of (a) CD8A, (b) GZMA, (c) EOMES, (d) CYT marker genes within the “breast” CPI∆ cohort. Top density plots display pre-therapy (gray curve) and on-therapy (black curve) expression across the breast cancer cohort with longitudinal data available (n=25). Bottom residual plot demonstrates pre-therapy expression (log2(TPM+1)) plotted along the diagonal line (x-axis) and on-therapy (y-axis) expression which is joined to paired patient-level pre-therapy expression with a vertical line. Red indicates cohort stratification into patient-tumors with high overall survival (OS; >median (OS)) and dark blue indicates patient-tumors with low OS (OS<median (OS)). (E) Summary plot of all available signatures (n=25) within the breast cancer cohort. Signatures are depicted on the x-axis and number of patient tumors which either increase (top arrow) or decrease (bottom arrow) in expression for each signature on the y-axis. Bars in red (OS high) and dark blue (OS low) depict patient-tumor stratification based on OS. Significance was tested using a Fisher’s exact test and displayed. CPI, checkpoint inhibitor.
Figure 3
Figure 3
CPI induced gene expression dynamics in breast cancer. (A) Left diagram depicting RNA dynamics (∆+ “increase,” ∆− “decrease,” ∆ neutral expression change on-therapy) observed across tumors stratified into CPI-responding-tumors (RECIST Responder(R)/OS high (>median OS)) and CPI-non-responding-tumors (RECIST non-responder (NR)/OS low (https://biorender.com). (B, C) Upset plots of genes comprising the (B) “Response Pos” and (C) “Response Neg” categories across six of the CPI∆ cohorts, subsetted for 778 genes within the “breast” CPI∆ immune NanoString panel. For each upset plot, the left bar plots indicate the number of genes identified in each gene category per CPI∆ cohort, including “breast” (pink), “melanoma (a)” (light blue), “melanoma (b)” (dark blue), “urothelial (a)” (orange), “urothelial (b)” (yellow). The top bar plot indicates the total number of genes which are unique to each cohort and the number of shared genes between cohorts, with interactions highlighted in the bottom dot plot. (D) Proportion plots depicting gene identified to “increase” or “decrease” in expression on-therapy across gene categories (“Response Pos,” purple; “Response Neg,” blue; “Resistance Pos,” green; “Resistance Neg,” yellow) in the “breast” CPI∆ cohort only. Y axis indicates the number of genes identified per gene category at F1 (filter one), followed by the number of genes identified per gene category to not be confounded by sampling bias F2 (filter 2; Methods section) within the “breast” CPI∆ cohort. Analysis was conducted on 778 genes comprising the immune NanoString panel. (E) Scatter plot left, depicting the overall effect size (OR; x-axis) and significance (p value; y-axis) of identified genes (each point) identified within one of the four gene categories (“Response Pos,” circle; “Response Neg,” triangle; “Resistance Pos,” square; “Resistance Neg,” cross) and not confounded by sampling bias (results from figure 3D). Associations with clinical outcomes were assessed using RECIST radiological response across the “breast” CPI∆ cohort. Gray indicates genes with no association with CPI response, in red a significant association with CPI response, and in blue associated with clinical outcomes in CPI-naïve tumors within the TCGA dataset. Scatter plot right, depicting the hazard ratio (HR; x-axis) and significance (p value; y-axis) of identified genes. Associations with clinical outcomes were assessed using OS across the “breast” CPI∆ cohort. CPI, checkpoint inhibitor; OS, overall survival; RECIST, Response Evaluation Criteria in Solid Tumors.
Figure 4
Figure 4
Differential mechanisms of CPI dynamics breast cancer versus melanoma. (A) Box plots comparing pre-therapy expression (y-axis) of genes identified to increase in expression on-therapy (Response Pos genes) and be associated with clinically favorable response to CPI in breast cancer (figure 2E, right), within the “melanoma (a)” and “breast” CPI∆ cohort (x-axis). This analysis used RNA sequencing data processed from FASTq to TPM matrix through a standardized pipeline allowing for comparison across both cohorts. Significance was tested using a Wilcoxon test and displayed. (B) Box plots comparing pre-therapy expression (y-axis) of genes identified to decrease in expression on-therapy (Response Neg genes) and observed to be associated with no response to CPI breast cancer (figure 2D, right), within the “melanoma (a)” and “breast” CPI∆ cohort (x-axis). Data used here were RNA sequencing across both cohorts processed from FASTq to TPM matrix through a standardized pipeline allowing for comparison. Significance was tested using a Wilcoxon test and displayed. (C) Proportion plots depicting gene identified to “increase” or “decrease” in expression across gene categories (“Response Pos,” purple; “Response Neg,” blue; “Resistance Pos,” green; “Resistance Neg,” yellow) on-therapy across the “melanoma (a)” CPI∆ cohort only. Y axis indicates the number of genes identified per gene category at F1 (filter one), followed by the number of genes identified per gene category to not be confounded by sampling bias F2 (filter 2; Methods section) within the “melanoma (a)” CPI∆ cohort. This analysis was conducted on 778 genes comprising the immune NanoString panel. (D) Scatter plot depicting the overall effect size (OR; x-axis) and significance (p value; y-axis) of identified genes (each point) identified within one of the four gene categories (“Response Pos,” circle; “Response Neg,” triangle; “Resistance Pos,” square; “Resistance Neg,” cross) and not confounded by sampling bias (results from figure 3D). Associations with clinical outcomes were assessed using RECIST radiological response across the “Melanoma (a)” cohort. Gray symbols indicates genes with no association with CPI response, in red a significant associations with CPI response, and in blue associated with clinical outcomes in CPI-naïve tumors within the TCGA dataset. CPI, checkpoint inhibitor; RECIST, Response Evaluation Criteria in Solid Tumors.

References

    1. Johnson DB, Nebhan CA, Moslehi JJ, et al. . Immune-Checkpoint inhibitors: long-term implications of toxicity. Nat Rev Clin Oncol 2022;19:254–67. 10.1038/s41571-022-00600-w - DOI - PMC - PubMed
    1. Larkin J, Chiarion-Sileni V, Gonzalez R, et al. . Five-year survival with combined Nivolumab and Ipilimumab in advanced Melanoma. N Engl J Med 2019;381:1535–46. 10.1056/NEJMoa1910836 - DOI - PubMed
    1. Adams S, Loi S, Toppmeyer D, et al. . Pembrolizumab monotherapy for previously untreated, PD-L1-positive, metastatic triple-negative breast cancer: cohort B of the phase II KEYNOTE-086 study. Ann Oncol 2019;30:405–11. 10.1093/annonc/mdy518 - DOI - PubMed
    1. Emens LA, Cruz C, Eder JP, et al. . Long-term clinical outcomes and biomarker analyses of Atezolizumab therapy for patients with metastatic triple-negative breast cancer: A phase 1 study. JAMA Oncol 2019;5:74–82. 10.1001/jamaoncol.2018.4224 - DOI - PMC - PubMed
    1. Havel JJ, Chowell D, Chan TA. The evolving landscape of biomarkers for Checkpoint inhibitor Immunotherapy. Nat Rev Cancer 2019;19:133–50. 10.1038/s41568-019-0116-x - DOI - PMC - PubMed

Publication types