. 2023 Nov 1;14(1):6991.
doi: 10.1038/s41467-023-42801-6.

Follicle-stimulating hormone orchestrates glucose-stimulated insulin secretion of pancreatic islets

Affiliations

Follicle-stimulating hormone orchestrates glucose-stimulated insulin secretion of pancreatic islets

Yi Cheng et al. Nat Commun. .

Abstract

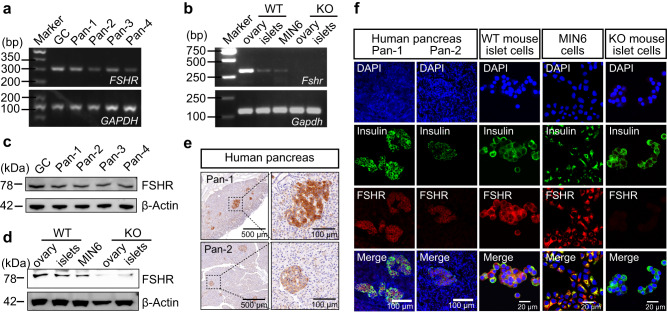
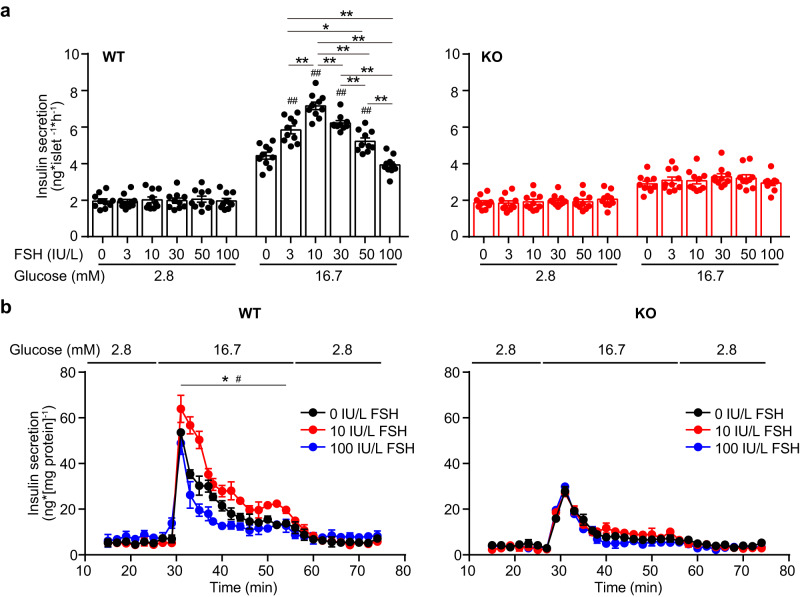
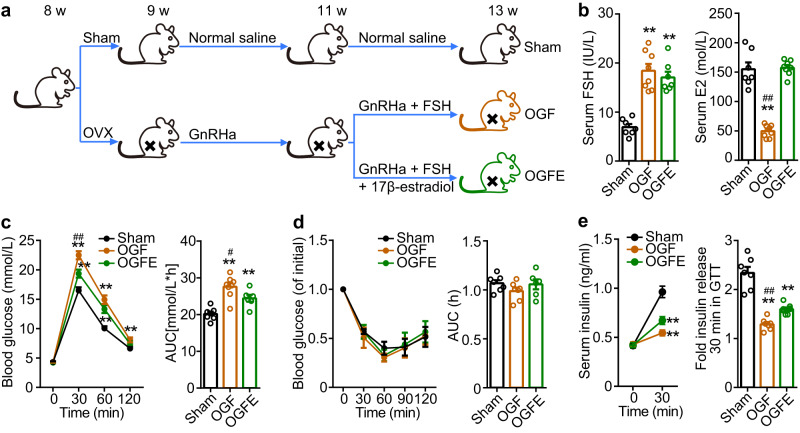
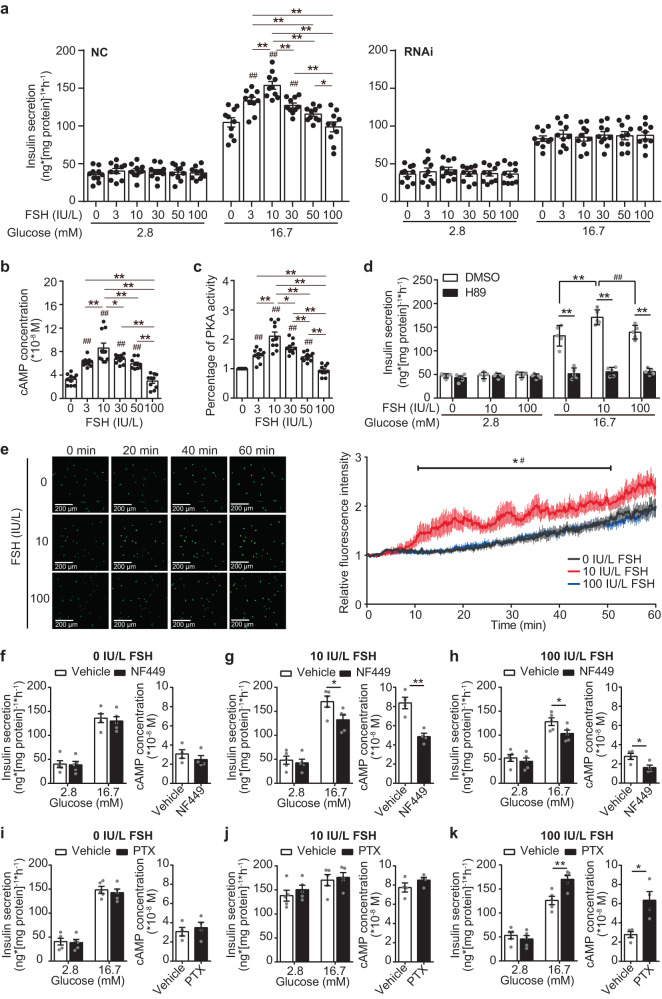
Follicle-stimulating hormone (FSH) is involved in mammalian reproduction via binding to FSH receptor (FSHR). However, several studies have found that FSH and FSHR play important roles in extragonadal tissue. Here, we identified the expression of FSHR in human and mouse pancreatic islet β-cells. Blocking FSH signaling by Fshr knock-out led to impaired glucose tolerance owing to decreased insulin secretion, while high FSH levels caused insufficient insulin secretion as well. In vitro, we found that FSH orchestrated glucose-stimulated insulin secretion (GSIS) in a bell curve manner. Mechanistically, FSH primarily activates Gαs via FSHR, promoting the cAMP/protein kinase A (PKA) and calcium pathways to stimulate GSIS, whereas high FSH levels could activate Gαi to inhibit the cAMP/PKA pathway and the amplified effect on GSIS. Our results reveal the role of FSH in regulating pancreatic islet insulin secretion and provide avenues for future clinical investigation and therapeutic strategies for postmenopausal diabetes.


Conflict of interest statement

The authors declare no competing interests.

Figures

Fig. 1
Fig. 1. FSHR expression in human and mouse pancreatic β-cells and MIN6 cells.
a, b The mRNA expression of FSHR in human female granulosa cells and pancreas (a), female mouse ovarian tissue and pancreatic islets, and MIN6 cells (b). GAPDH served as a loading control. c, d Protein expression of FSHR in human female granulosa cells and pancreas (c), female mouse ovarian tissues and pancreatic islets, and MIN6 cells (d). β-Actin served as a loading control. The ovary and pancreatic islets from Fshr−/− (KO) mice as negative controls. GC, granulosa cells; Pan, pancreas. e Localization of FSHR in the human female pancreas. Scale bars, 500 µm (main images), 100 µm (magnified images). f Localization of FSHR (red) in the human female pancreas, mouse pancreatic islets single cells, and MIN6 cells. Insulin (green) was the marker of pancreatic β-cells. Nuclei (blue) were stained with DAPI. Scale bars, 100 µm (human pancreas), 20 µm (mouse islet cells, MIN6 cells, and NC). The experiments in (af) were performed twice independently. Source data are provided as a Source data file.
Fig. 2
Fig. 2. FSH, independent of estrogen, regulates GSIS via FSHR.
a Schematic of Fshr+/+ (WT) and Fshr−/− (KO) female mice subjected to different treatments. b Serum FSH and E2 levels in WT, KO and KO + E2 female mice with E2 supplement. nWT = 10, nKO = 9, nKO+E2 = 10. **P < 0.01 vs. WT, ##P < 0.01 vs. KO + E2. c Glucose tolerance test and AUC of female mice in different treatment groups. nWT = 10, nKO = 9, nKO+E2 = 10. *P < 0.05 vs. WT, **P < 0.01 vs. WT, ##P < 0.01 vs. KO + E2. d Insulin tolerance test and AUC of female mice in different treatment groups. nWT = 10, nKO = 9, nKO+E2 = 10. e Blood insulin levels at 0 min and 30 min after glucose injection and its fold changes of female mice with different treatments. nWT = 10, nKO = 9, nKO+E2 = 10. **P < 0.01 vs. WT. All the WT, KO and KO + E2 mice were performed the serum and metabolic tests at 10 weeks of age. f Glucose tolerance test and AUC of Ctrl (Fshrf/f) and CKO (Fshrf/f; Pdx1-Cre) female mice. nCtrl = 9, nCKO = 8. *P < 0.05, **P < 0.01. g Insulin tolerance test and AUC of Ctrl and CKO female mice. nCtrl = 9, nCKO = 8. h Blood insulin levels at 0 min and 30 min after glucose injection and its fold changes of Ctrl and CKO female mice. nCtrl = 9, nCKO = 8. **P < 0.01. All the Ctrl and CKO mice were performed the serum and metabolic tests at 8 weeks of age. Data (bh) were shown as mean ± s.e.m. and analyzed by one-way ANOVA (be) or unpaired two-tailed Student’s t-tests (fh). Statistical details are in Supplementary Table 2. Source data are provided as a Source data file.
Fig. 3
Fig. 3. FSH regulates GSIS via FSHR in pancreatic islets.
a GSIS in pancreatic islets from WT and KO female mice, with or without FSH, n = 10 repeats for each group. **P < 0.01; #P < 0.05, ##P < 0.01 compared to 0 IU/L FSH group. b Perfusion analyses of dynamic GSIS in islets from WT, and KO female mice. Each islet sample was pooled from at least three animals, n = 3 technical replicates, *P < 0.05 0 IU/L vs. 10 IU/L, #P < 0.05 10 IU/L vs. 100 IU/L. All the data were presented as mean ± s.e.m. and analyzed by one-way ANOVA. Statistical details are in Supplementary Table 2. Source data are provided as a Source data file.
Fig. 4
Fig. 4. High circulating levels of FSH impaired glucose tolerance and insulin secretion.
a Schematic of C57BL/6 female mice receiving different treatments. b Serum FSH and serum E2 levels in female mice with different treatments. nSham = 7, nOGF = 8, nOGFE = 7. **P < 0.01 vs. Sham, ##P < 0.01 vs. OGFE. c Glucose tolerance test and AUC of female mice in each group. nSham = 7, nOGF = 8, nOGFE = 6. *P < 0.05 vs. Sham, **P < 0.01 vs. Sham, #P < 0.05 vs. OGFE. d Insulin tolerance test and AUC in female mice with different treatments. nSham = 7, nOGF = 7, nOGFE = 6. e Blood insulin levels at 0 min and 30 min after glucose injection and its fold changes of female mice with different treatments. n = 7 per group, **P < 0.01 vs. Sham, #P < 0.05 vs. OGFE. All the female mice were performed the serum and metabolic tests at 13 weeks of age. Data (be) were shown as mean ± s.e.m. and analyzed by one-way ANOVA. Statistical details are in Supplementary Table 2. Source data are provided as a Source data file.
Fig. 5
Fig. 5. FSH orchestrates GSIS via the cAMP/PKA and Ca2+ pathway, which is controlled by Gαs and Gαi switch.
a MIN6 cells were transfected with either the scramble (left) or the Fshr siRNA (right), followed by GSIS assays with different concentrations of FSH. n = 10 repeats each group, *P < 0.05, **P < 0.01; #P < 0.05, ##P < 0.01 compared to 0 IU/L FSH group. b, c Intracellular cAMP concentration (b) and PKA activity (c) was measured in MIN6 cells after stimulated with 16.7 mM glucose and different concentrations of FSH for 1 h. n = 10 repeats each group, *P < 0.05, **P < 0.01; #P < 0.05, ##P < 0.01 compared to 0 IU/L FSH group. d GSIS was tested in MIN6 cells treated with or without PKA inhibitor (H89, 10 μM). n = 5 repeats each group, *P < 0.05, **P < 0.01, #P < 0.05. e Intracellular Ca2+ levels were measured by fluorescence of the Ca2+ dye Fluo-4 AM in MIN6 cells treated with or without FSH, addition of 16.7 mM glucose. n = 10 repeats each group, *P < 0.05 vs. 0 IU/L FSH, #P < 0.05 vs. 100 IU/L FSH. fh MIN6 cells were pre-treated with or without 10 μM NF449 (Gαs protein inhibitor) for 1 h, followed by GSIS assays and intracellular cAMP concentration measurements, under different concentrations of FSH. n = 5 repeats each group of GSIS assays, n = 4 repeats each group of intracellular cAMP concentration measurements, *P < 0.05, **P < 0.01. ik GSIS assays and intracellular cAMP concentration measurements under different concentrations of FSH in MIN6 cells pre-treated with or without 100 ng/ml PTX (Gαi protein inhibitor), n = 5 repeats each group of GSIS assays, n = 4 repeats each group of intracellular cAMP concentration measurements, *P < 0.05, **P < 0.01. ak Data were shown as mean ± s.e.m., n = 4 or 5 per group, analyzed by one-way ANOVA (ae) and unpaired two-tailed Student’s t-tests (fk). Statistical details are in Supplementary Table 2. Source data are provided as a Source data file.

References

    1. Dias JA, et al. Molecular, structural, and cellular biology of follitropin and follitropin receptor. Vitam. Horm. 2002;64:249–322. doi: 10.1016/S0083-6729(02)64008-7. - DOI - PubMed
    1. Casarini L, Crepieux P. Molecular Mechanisms of Action of FSH. Front. Endocrinol. 2019;10:305. doi: 10.3389/fendo.2019.00305. - DOI - PMC - PubMed
    1. Liu XM, et al. FSH regulates fat accumulation and redistribution in aging through the Galphai/Ca(2+)/CREB pathway. Aging Cell. 2015;14:409–420. doi: 10.1111/acel.12331. - DOI - PMC - PubMed
    1. Liu P, et al. Blocking FSH induces thermogenic adipose tissue and reduces body fat. Nature. 2017;546:107–112. doi: 10.1038/nature22342. - DOI - PMC - PubMed
    1. Song Y, et al. Follicle-stimulating hormone induces postmenopausal dyslipidemia through inhibiting hepatic cholesterol metabolism. J. Clin. Endocr. Metab. 2016;101:253–262. doi: 10.1210/jc.2015-2724. - DOI - PubMed

Publication types

LinkOut - more resources