. 2023 Nov 1;14(1):6982.
doi: 10.1038/s41467-023-42785-3.

Hepatocyte FBXW7-dependent activity of nutrient-sensing nuclear receptors controls systemic energy homeostasis and NASH progression in male mice

Affiliations

Hepatocyte FBXW7-dependent activity of nutrient-sensing nuclear receptors controls systemic energy homeostasis and NASH progression in male mice

Hui Xia et al. Nat Commun. .

Abstract

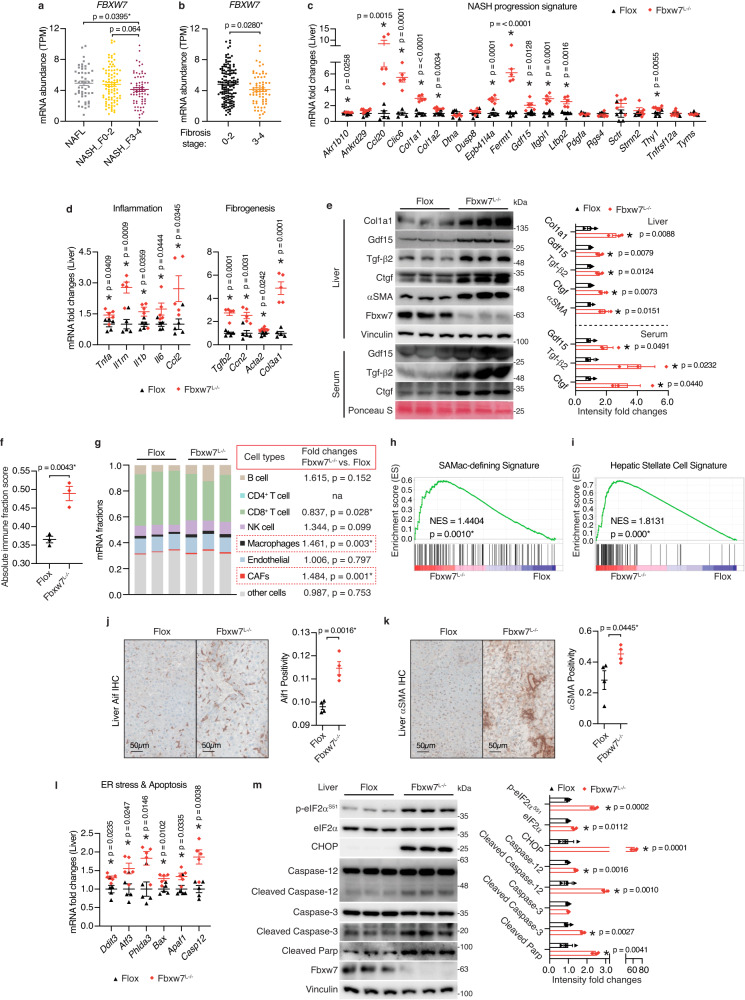
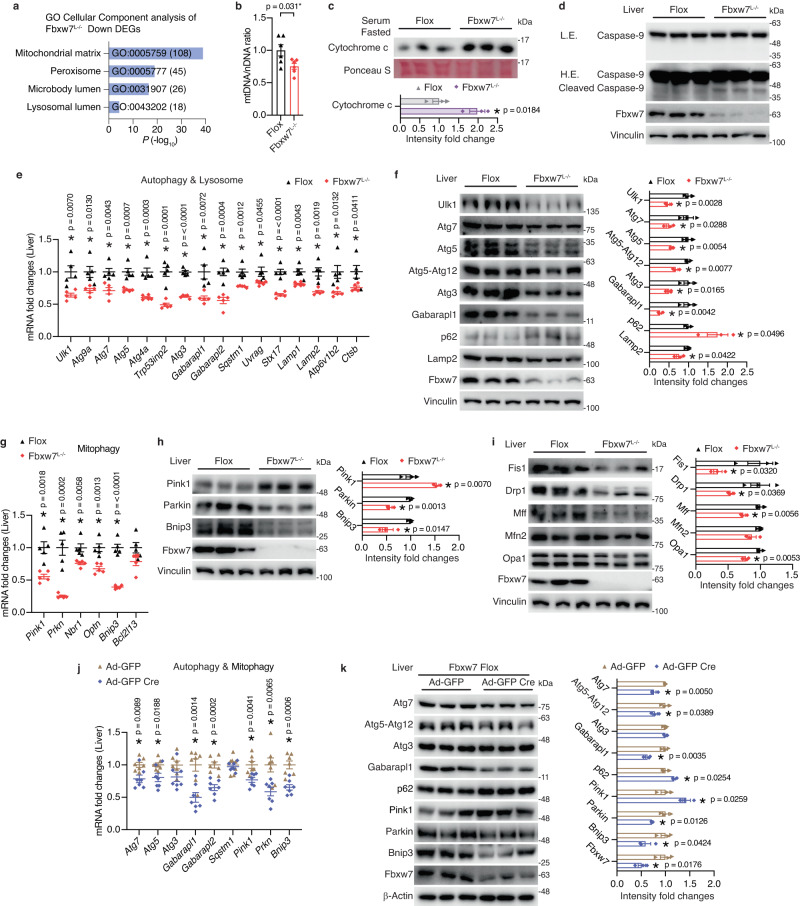
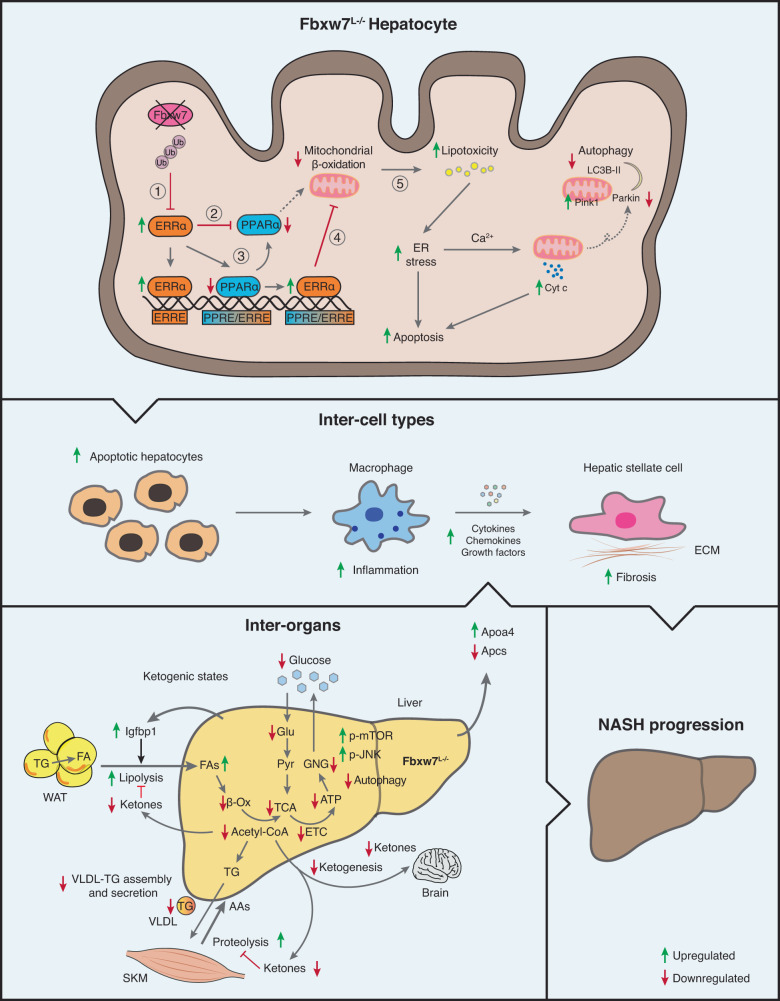
Nonalcoholic steatohepatitis (NASH) is epidemiologically associated with obesity and diabetes and can lead to liver cirrhosis and hepatocellular carcinoma if left untreated. The intricate signaling pathways that orchestrate hepatocyte energy metabolism and cellular stress, intrahepatic cell crosstalk, as well as interplay between peripheral tissues remain elusive and are crucial for the development of anti-NASH therapies. Herein, we reveal E3 ligase FBXW7 as a key factor regulating hepatic catabolism, stress responses, systemic energy homeostasis, and NASH pathogenesis with attenuated FBXW7 expression as a feature of advanced NASH. Multiomics and pharmacological intervention showed that FBXW7 loss-of-function in hepatocytes disrupts a metabolic transcriptional axis conjointly controlled by the nutrient-sensing nuclear receptors ERRα and PPARα, resulting in suppression of fatty acid oxidation, elevated ER stress, apoptosis, immune infiltration, fibrogenesis, and ultimately NASH progression in male mice. These results provide the foundation for developing alternative strategies co-targeting ERRα and PPARα for the treatment of NASH.


Conflict of interest statement

The authors declare no competing interests.

Figures

Fig. 1
Fig. 1. FBXW7 protects against NASH.
a Analysis of hepatic FBXW7 expression in patients across the severity stages of NAFLD progression. n = 50 for NAFL; n = 87 for NASH_F0-2; n = 68 for NASH_F3-4. b FBXW7 mRNA levels in fibrotic liver biopsies from patients with NAFLD. n = 137 for Fibrosis stage 0-2; n = 68 for Fibrosis stage 3-4. Relative mRNA levels of NASH progression signature genes (c), inflammation and fibrogenesis genes (d) in Flox (control) and Fbxw7-null livers, n = 5. e Immunoblots and quantification of proteins related to NASH progression in livers and serum from Flox and Fbxw7L−/− littermates. Each lane represents one mouse, n = 3. f Overall immune contents of control and Fbxw7-null livers, reflected by the absolute immune fraction scores, n = 3. g Stacked bar chart illustrating cell distributions of control and Fbxw7-null livers, n = 3. CAFs Cancer-associated fibroblasts, na non-applicable. GSEA of SAMac-defining signature (h) and hepatic stellate cell signature (i). Array genes were ordered from the highest in Fbxw7-null livers (left) to the highest in control livers (right). Locations of genes in each signature are indicated by the vertical black bars. NES normalized enrichment score. Representative images and quantification of Aif1 (j) and αSMA (k) immunohistochemistry (IHC) staining, n = 4. Scale bars, 50 μm. l mRNA expression of ER stress and apoptotic genes in control and Fbxw7-null livers, n = 5. m Immunoblots and quantification of proteins related to ER stress and apoptosis. Each lane represents one mouse, n = 3. Data are presented as means ± SEM (af, jm). *p < 0.05, unpaired two-tailed Student’s t test (ag, jm). Source data are provided as a Source Data file.
Fig. 2
Fig. 2. Fat accumulation in Fbxw7-null livers is independent of hepatic lipogenesis.
a Schematic representation of Fbxw7L−/− and Flox liver metabolomics study. See methods for further details. b Relative levels of free fatty acid (FFA) and esterified FA in Fbxw7L−/− mice versus Flox mice. n = 6 for FFA and n = 7 for esterified FA unless otherwise indicated in Supplementary Data 1 due to missing values. c Relative de novo lipogenesis (DNL) index measured as the ratio of hepatic C16:0 content to C18:2n6 content (n = 6 for nonesterified, n = 7 for esterified). d Schematic illustration of intermediate metabolites and genes involved in glycolysis/gluconeogenesis, FA synthesis, glyceroneogenesis and triacylglyceride (TG) synthesis. Glu glucose, G6P glucose 6-phosphate, F1,6BP fructose 1,6-bisphosphate, PEP phosphoenolpyruvate, Pyr pyruvate, OAA oxaloacetate, DHAP dihydroxyacetone phosphate, LPA lysophosphatidic acid, PA phosphatidic acid, DG diacylglycerol. e Relative abundance of selected metabolites involved in glucose metabolism and lipogenesis illustrated in Fig. 2d. n = 6 unless otherwise indicated in Supplementary Data 1 due to missing values. f Fed blood glucose and lactate levels of Flox (n = 8) and Fbxw7L−/− (n = 9) mice. g Liver mRNA levels of genes illustrated in Fig. 2d in Flox and Fbxw7L−/− mice, n = 5. h Immunoblots and quantification of proteins involved in glucose and fat metabolism. Each lane represents one mouse, n = 3. Hepatic ACC (i) and Fasn (j) activities in control and Fbxw7-null livers, n = 6. k Serum triglyceride concentrations of fed Flox (n = 4) and Fbxw7L−/− (n = 5) mice. l Liver mRNA levels of Apoc2 and Apoa4, n = 5. mRNA (m) and protein levels (n, each lane represents one mouse) of genes involved in glucose and fat metabolism in epididymal white adipose (eWAT) of Flox and Fbxw7L−/− mice, n = 3. Serum FFA (o) and insulin (p) concentrations of fed Flox and Fbxw7L−/− mice, n = 8. Data are presented as means ± SEM, *p < 0.05, unpaired two-tailed Student’s t test (b, c, ep). Source data are provided as a Source Data file.
Fig. 3
Fig. 3. Loss of Fbxw7 impairs PPARα-dependent lipid oxidation.
a Schematic diagram of genes regulating diverse aspects of hepatic fat metabolism. Significantly downregulated (blue), upregulated (red), and non-significant (black) genes from liver RNA-seq analysis of Fbxw7L−/− versus Flox mice (n = 3, p < 0.05, |FC| > 1.30). Red arrows, processes leading to accumulation of intrahepatic TG, green arrows, fat clearance processes. CM Chylomicron, LD Lipid Droplet. b Schematic illustration of intermediate metabolites and genes involved in each step of FA β-oxidation (FAO). VLCFA Very long chain FA, MUFA Monounsaturated FA, PUFA Polyunsaturated FA. c Relative abundance of fatty acyl-CoA in Fbxw7-null and control livers revealed by LC-MS. n = 6 unless otherwise indicated in Supplementary Data 1. d Hepatic FAO activities in control and Fbxw7-null livers, n = 6. e RT-qPCR analysis of genes in Fig. 3a, b regulating fat degradation in control and Fbxw7-null livers, n = 5. f Hepatic Ppara transcript levels, n = 5. g PPARA expression in patients across the severity stages of NAFLD progression. n = 50 for NAFL; n = 87 for NASH_F0-2; n = 68 for NASH_F3-4. h PPARA mRNA levels in fibrotic liver biopsies from patients with NAFLD. n = 137 for Fibrosis stage 0-2; n = 68 for Fibrosis stage 3-4. Correlation analysis of FBXW7 and PPARA mRNA levels in human livers with NAFLD progression (i, see Fig. 3g for sample numbers) and human fibrotic liver biopsies (j, see Fig. 3h for sample numbers). k Immunoblots and quantification of proteins involved in hepatic fat degradation. Each lane represents one mouse, n = 3. Fbxw7 Flox mice were injected with adenovirus expressing GFP or Cre recombinase and livers were collected and subjected to RT-qPCR (l, n = 7) and immunoblot (m, n = 3) analysis of FAO genes. Each lane represents one mouse. Immunoblot quantification results are shown on the lower panel (m). Data are presented as means ± SEM, *p < 0.05, non-parametric Spearman’s test (two-tailed) (i, j), unpaired two-tailed Student’s t test (ch, km). Source data are provided as a Source Data file.
Fig. 4
Fig. 4. Fbxw7-null livers exhibit mitochondrial dysfunction and autophagy deficiency.
a GO cellular component analysis of downregulated DEGs (p < 0.05, |FC| > 1.30) in Fbxw7-null livers. Top enriched terms are shown. The number of genes in each category are shown in parentheses. b Relative amounts of mitochondrial DNA (mtDNA), normalized to nuclear DNA (nDNA) in control and Fbxw7-null livers (n = 6). c Immunoblots and quantification of serum Cytochrome c levels of Flox and Fbxw7L−/− littermates. Each lane represents one mouse, n = 3. d Immunoblots and quantification of hepatic Caspase-9 and cleaved Caspase-9. Each lane represents one mouse, n = 3. L.E. Low Exposure, H.E. High Exposure. e mRNA expression of autophagy and lysosome-related genes in control and Fbxw7-null livers, n = 5. f Immunoblots and quantification of key autophagy components. Each lane represents one mouse, n = 3. g mRNA expression of mitophagy genes in control and Fbxw7-null livers, n = 5. Immunoblots and quantification of key mitophagy components (h) and proteins mediating mitochondrial fission and fusion (i). Each lane represents one mouse, n = 3. j, k Fbxw7 Flox mice were injected with adenovirus expressing GFP or Cre recombinase and livers were collected and subjected to RT-qPCR (j, n = 7) and immunoblot (k, n = 3) analysis of autophagy and mitophagy genes. Each lane represents one mouse. Immunoblot quantification results are shown on the right panel (k). Data are presented as means ± SEM, *p < 0.05, unpaired two-tailed Student’s t test (b, c, ek). Source data are provided as a Source Data file.
Fig. 5
Fig. 5. Fbxw7L−/− mice adapt poorly to starvation.
a Illustration of hepatic energy metabolism. b mRNA expression of TCA cycle and OXPHOS genes in control and Fbxw7-null livers, n = 5. c Immunoblots and quantification of OXPHOS subunits. Each lane represents one mouse, n = 3. d Relative hepatic ATP abundance, n = 6. Gross liver morphology (e) and liver weights (f) of fed and fasted Flox and Fbxw7L−/− mice. n = 7 for fed, n = 8 for fasted Flox and n = 7 for fasted Fbxw7L−/− mice. g Liver L-amino acid contents of fasted Flox and Fbxw7L−/− mice, n = 7. h Immunoblots and quantification of proteins involved in hepatic fat degradation and autophagy from Flox and Fbxw7L−/− mice in the fed and fasted states. Each lane represents one mouse, n = 3. i Body weight and tissue weights of fasted Flox and Fbxw7L−/− mice. See Source data file for sample numbers. mRNA (j, n = 5 for Flox and n = 6 for Fbxw7L−/− mice) and protein levels (k, each lane represents sample from one mouse, n = 3) of the indicated genes in Skm of fasted Flox and Fbxw7L−/− mice. Immunoblot quantification shown on the right panel (k). l Serum L-amino acids concentrations of Flox and Fbxw7L−/− mice in the fed and fasted states, n = 8. m Representative hematoxylin and eosin (H&E)-stained eWAT from fasted Flox and Fbxw7L−/− mice. Scale bars, 50 μm. See Supplementary Fig. 5f for quantification of eWAT size. n Serum FFA concentrations, n = 6. mRNA (o, n = 4 for Flox mice and n = 5 for Fbxw7L−/− mice) and protein levels (p, each lane represents sample from one mouse, n = 3) of the indicated genes in eWAT from fasted Flox and Fbxw7L−/− mice. Immunoblot quantification shown on the right panel (p). Data are presented as means ± SEM, *p < 0.05, unpaired two-tailed Student’s t test (bd, fl, np). Source data are provided as a Source Data file.
Fig. 6
Fig. 6. Hepatic Fbxw7 deficiency inhibits ketogenic diet-induced fat utilization.
a Body weight of Flox (n = 8) and Fbxw7L−/− (n = 7) mice during a 20-day keto diet. Hourly plot (b) and overall average (c) of whole-body oxygen consumption of Flox and Fbxw7L−/− mice switching from a normal diet to keto diet, n = 7. Hourly plot (d) and overall average (e) of fatty acid oxidation rate of Flox and Fbxw7L−/− mice switching from a normal diet to keto diet, n = 7. f Tissue weights of Flox and Fbxw7L−/− mice post a 20-day keto diet, n = 6 for Flox mice and n = 5 for Fbxw7L−/− mice. Concentrations of serum L-amino acids (g, n = 8 for Flox and n = 7 for Fbxw7L−/− mice) and FFA (h, n = 5 for Flox and n = 4 for Fbxw7L−/− mice) of mice post a 20-day keto diet. i Gross morphology (left) and representative eWAT H&E staining (right) from Flox and Fbxw7L−/− mice post a 20-day keto diet. Scale bars, 50 μm. j Immunoblots and quantification of Hsl phosphorylation levels post a 20-day keto diet. Each lane represents eWAT from one mouse, n = 3. k Schematic illustration of intermediate metabolites and genes involved in ketogenesis. l Representative liver H&E staining of Flox and Fbxw7L−/− mice post a 20-day keto diet. Scale bars, 50 μm. m RT-qPCR of hepatic levels of ketogenesis genes, n = 5. n Blood B-Ketone levels in Flox and Fbxw7L−/− mice before and after 16 days of keto diet, n = 6. Data are represented as means ± SEM (ah, j, m, n). *p < 0.05, unpaired two-tailed Student’s t test (a, ch, j, m, n) and one-way ANCOVA using body weight as the covariate (b). Source data are provided as a Source Data file.
Fig. 7
Fig. 7. Metabolic stress aggravates NASH in the absence of Fbxw7.
a Heatmap showing mRNA fold changes of NASH-related genes in the fed, fasted and keto diet nutritional regimens, assessed by RT-qPCR, n = 5-6 (see Source data file for specific sample numbers). b Representative images of H&E and Masson’s trichrome (MTC) stained liver tissue sections from Flox and Fbxw7L−/− mice under different nutritional regimens. Arrowhead, fibrotic area (blue). Images are representative of n = 3 mice per group. Immunoblots and quantification of the indicated proteins from Flox and Fbxw7L−/− mice upon fasting (c) or post a 20-day keto diet (d). Each lane represents one mouse, n = 3. e HepG2 cells stably expressing empty vector or FBXW7 were treated with 500 nM Thapsigargin (Tg) or DMSO for 24 h followed by immunoblot examination. Immunoblots are from one experiment representative of 3 independent experiments with similar results. f Overlap of liver-enriched secreted factors with hepatic DEGs (p < 0.05, |FC|>1.30) induced by Fbxw7 deficiency, by fasting, or by a keto diet. g Ranking of the secreted factors identified in Fig. 7f by the sum of absolute mRNA fold changes of the four transcriptome datasets. h, i Hepatic mRNA expression of Apoa4, Apcs and Igfbp1 from Flox and Fbxw7L−/− mice upon fasting (h, n = 5) or post a 20-day keto diet (i, n = 6 for Flox and n = 5 for Fbxw7L−/− mice). Immunoblots and quantification of serum and liver levels of the hepatic secreted factors from Flox and Fbxw7L−/− mice upon fasting (j) or post a 20-day keto diet (k). Each lane represents one mouse, n = 3. Data are represented as means ± SEM (c, d, hk). *p < 0.05, unpaired two-tailed Student’s t test (a, c, d, hk). Source data are provided as a Source Data file including Fig. 7a p-values.
Fig. 8
Fig. 8. Inhibition of Fbxw7 substrate ERRα alleviates NASH.
a Enriched transcription factors downstream of Fbxw7 signaling visualized using -log10 (p-value). b Heatmap representing the rho correlation coefficient of ESRRA with NASH-related genes in human NAFLD liver biopsies (see Fig. 3g for patient numbers). c Heatmap showing RT-qPCR mRNA fold changes of NASH-related genes under a HFD. n = 8 for ERRα3SA mice and their littermates; n = 5 for ERRα3SA C29 and n = 4 for control; n = 4 for ERRα KO and WT mice. Upregulation of GSEA SAMac-defining (d) and hepatic stellate cell (e) signatures in HFD-fed WT mice compared to ERRα KO mice. f GO cellular component analysis of DEGs identified in livers of HFD-fed ERRα-null and Fbxw7L−/− mice (p < 0.05, |FC|>1.30). Top enriched terms are presented using -log10 (p-value). The number of genes per category are indicated in parentheses. g Volcano plot of DEGs identified in Fbxw7-null livers (p < 0.05, |FC|>1.30). Cluster I is ERRα-dependent DEGs, found differentially bound by ERRα in Fbxw7-null versus Flox liver ChIP-seq (±20 kb, |FC|≥1.5); Cluster II is ERRα-independent DEGs that show no differences in ERRα-binding between genotypes (±20 kb, |FC|<1.5). Representative liver oil red O staining (h) and hepatic triglyceride levels (i, n = 4) of Flox and Fbxw7L−/− mice post C29 administration. Scale bars, 40 μm. j Overlap of PPARα ChIP-seq targets (±20 kb) with ERRα ChIP-seq targets (±20 kb) identified in control and Fbxw7-null livers (left) and whether the shared targets harbor distinct or overlapping peaks (middle). ERRE and PPRE motif occurrences in 4056 overlapping PPARα and ERRα (Fbxw7L−/−) peaks at 3140 co-targeted genes whereby 28% harbor an ERRα motif embedded within the PPARα motif (right). k RT-qPCR analysis of hepatic genes regulating fat degradation from Flox and Fbxw7L−/− littermates post control or C29 injection, n = 5. Data are represented as means ± SEM (i, k). *p < 0.05, non-parametric Spearman’s test (two-tailed) (b), unpaired two-tailed Student’s t test (c, i, k). Source data are provided as a Source Data file including Fig. 8b, c p-values.
Fig. 9
Fig. 9. Hepatocyte FBXW7 protects against NASH and regulates systemic energy homeostasis by coordinating nutrient-sensing nuclear receptors.
Schematic summary of the mechanisms of NASH progression in the absence of Fbxw7. Hepatocyte Fbxw7 deficiency relieves ERRα degradation (red line) thus elevating ERRα levels (green arrow) ultimately leading to reduced PPARα activity (red arrow). Mechanistically, 1) Loss of Fbxw7 leads to overexpression of ERRα; 2) ERRα transcriptionally represses the expression of PPARα; 3) Elevated levels of ERRα displaces PPARα on shared sites; 4) Combined increased ERRα and decreased PPARα occupancy on shared sites results in inhibition of FAO; 5) Decreased FAO leads to a cascade of cellular stresses including lipotoxicity, increased ER stress, mitochondrial dysfunction, and decreased autophagy leading to apoptosis, immune infiltration, fibrogenesis and ultimately NASH progression. Investigation of physiological conditions during which Fbxw7-dependent signaling became challenged, such as enhanced hepatic FA influx induced by fasting and a keto diet, further revealed hepatocyte Fbxw7 as a crucial regulator of whole-body stress response and susceptibility to NASH. Cyt c Cytochrome c, ECM extracellular matrix, Glu glucose, Pyr pyruvate, GNG gluconeogenesis. The Figure was partly generated using Servier Medical Art, provided by Servier, licensed under a Creative Commons Attribution 3.0 unported license.

References

    1. Younossi ZM. Non-alcoholic fatty liver disease - a global public health perspective. J. Hepatol. 2019;70:531–544. doi: 10.1016/j.jhep.2018.10.033. - DOI - PubMed
    1. Brunt EM, et al. Nonalcoholic fatty liver disease. Nat. Rev. Dis. Primers. 2015;1:15080. doi: 10.1038/nrdp.2015.80. - DOI - PubMed
    1. Wesolowski SR, Kasmi KC, Jonscher KR, Friedman JE. Developmental origins of NAFLD: a womb with a clue. Nat. Rev. Gastroenterol. Hepatol. 2017;14:81–96. doi: 10.1038/nrgastro.2016.160. - DOI - PMC - PubMed
    1. Nakagawa H, et al. ER stress cooperates with hypernutrition to trigger TNF-dependent spontaneous HCC development. Cancer Cell. 2014;26:331–343. doi: 10.1016/j.ccr.2014.07.001. - DOI - PMC - PubMed
    1. Schuster S, Cabrera D, Arrese M, Feldstein AE. Triggering and resolution of inflammation in NASH. Nat. Rev. Gastroenterol. Hepatol. 2018;15:349–364. doi: 10.1038/s41575-018-0009-6. - DOI - PubMed

Publication types

Substances