. 2023 Nov 2;14(1):6997.
doi: 10.1038/s41467-023-42736-y.

Toxic PARP trapping upon cAMP-induced DNA damage reinstates the efficacy of endocrine therapy and CDK4/6 inhibitors in treatment-refractory ER+ breast cancer

Affiliations

Toxic PARP trapping upon cAMP-induced DNA damage reinstates the efficacy of endocrine therapy and CDK4/6 inhibitors in treatment-refractory ER+ breast cancer

Ozge Saatci et al. Nat Commun. .

Abstract

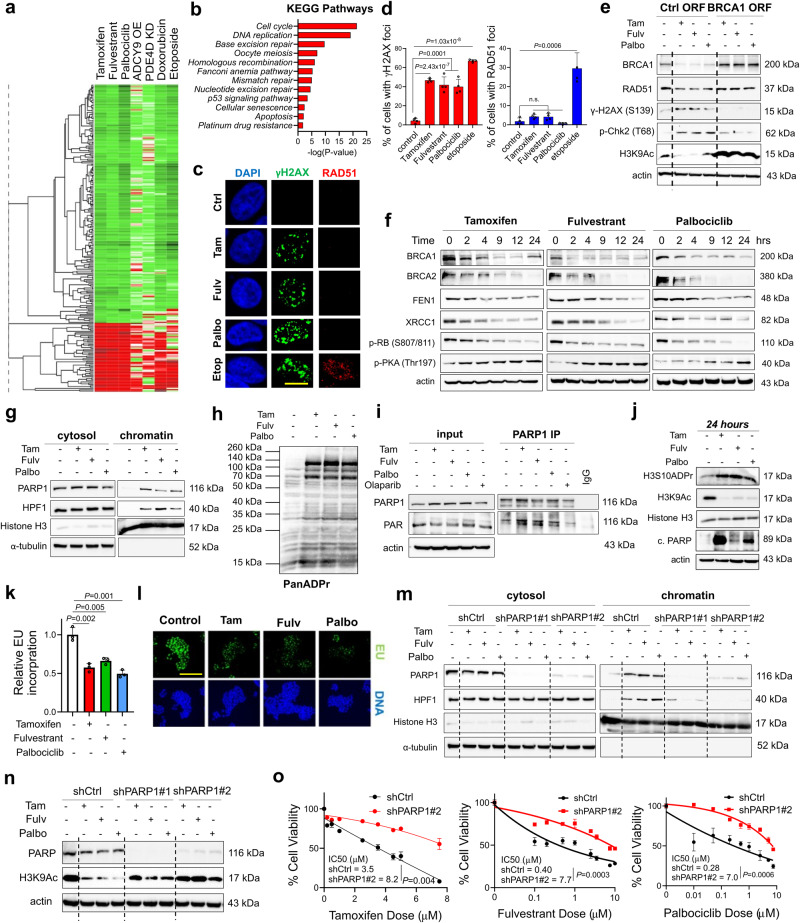
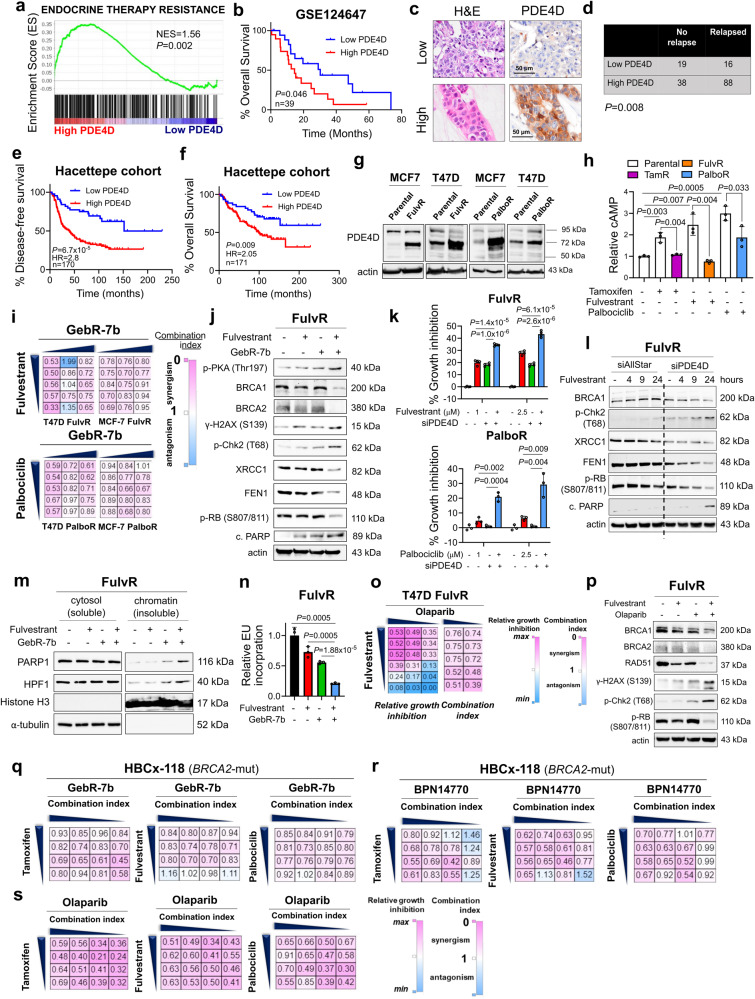
Resistance to endocrine therapy and CDK4/6 inhibitors, the standard of care (SOC) in estrogen receptor-positive (ER+) breast cancer, greatly reduces patient survival. Therefore, elucidating the mechanisms of sensitivity and resistance to SOC therapy and identifying actionable targets are urgently needed. Here, we show that SOC therapy causes DNA damage and toxic PARP1 trapping upon generation of a functional BRCAness (i.e., BRCA1/2 deficiency) phenotype, leading to increased histone parylation and reduced H3K9 acetylation, resulting in transcriptional blockage and cell death. Mechanistically, SOC therapy downregulates phosphodiesterase 4D (PDE4D), a novel ER target gene in a feedforward loop with ER, resulting in increased cAMP, PKA-dependent phosphorylation of mitochondrial COXIV-I, ROS generation and DNA damage. However, during SOC resistance, an ER-to-EGFR switch induces PDE4D overexpression via c-Jun. Notably, combining SOC with inhibitors of PDE4D, EGFR or PARP1 overcomes SOC resistance irrespective of the BRCA1/2 status, providing actionable targets for restoring SOC efficacy.


Conflict of interest statement

O. Sahin is the co-founder and manager of OncoCube Therapeutics LLC, developing TACC3 inhibitors, and the founder and president of LoxiGen, Inc, developing lysyl oxidase inhibitors. The other authors declare no potential conflicts of interest.

Figures

Fig. 1
Fig. 1. SOC therapy commonly induces DNA damage, BRCAness and toxic PARP1 trapping, leading to transcriptional blockage and growth inhibition in ER+ breast cancer.
a Heatmap of commonly differentially expressed genes in MCF-7 cells treated with SOC (tamoxifen or fulvestrant or palbociclib) for 24 hours from the Connectivity Map database. Green: downregulated genes; red: upregulated genes. b The pathway enrichment analysis of the SOC sensitivity signature. c IF staining of γ-H2AX (S139) (green) and RAD51 foci (red) in T47D cells upon treatment with SOC for 4 hours. DAPI (blue) was used to stain the nucleus, here and in all relevant figures. Etoposide was used as a positive control. Scale bar = 100 µm. d The quantification of γ-H2AX positive cells (left) and those that are also RAD51 foci positive (right) (n = 4 different areas, with at least 100 cells per area). e Western blot analyses of BRCA1, RAD51, DNA damage markers and H3K9Ac in T47D cells overexpressing ctrl vs. BRCA1 ORF and treated with SOC for 4 hours. f Western blot analyses of DNA repair proteins, BRCA1, BRCA2, FEN1 and XRCC1 and G1/S transition marker, p-RB (S807/811) and p-PKA (Thr197) in T47D cells treated with SOC in a time-dependent manner. g Chromatin occupancy of PARP1 and HPF1 upon treatment of T47D cells with SOC therapies for 2 hours. Histone H3 and α-tubulin were used as the loading controls for nuclear and cytosol fractions, respectively, here and in all relevant figures. h Western blot analysis of ADP ribosylation (ADPR) in T47D cells treated with SOC for 1 hour. i PARP1 immunoprecipitation (IP) in SOC-treated T47D cells followed by immunoblotting for PARylation. j Western blot analysis of H3S10 ADPR, acetylated H3K9 (H3K9Ac), Histone H3 and cleaved PARP in T47D cells treated with SOC for 24 hours. k Relative EU incorporation in SOC-treated cells to show blockage of global transcription (n = 3). l Representative images of the EU staining (green) in SOC-treated cells from k. Scale bar = 200 µm. m Chromatin occupancy of PARP1 and HPF1 upon treatment of T47D shCtrl vs. shPARP1 cells with SOC therapies for 2 hours. n Western blot analysis of H3K9Ac in T47D shCtrl vs. shPARP1 cells treated with SOC for 4 hours. o Percentage growth inhibition in T47D cells with shPARP1 and treated with increasing doses of SOC for 5 days (n = 4). Actin is used as a loading control in in all Western blots unless stated otherwise. Data are presented as mean values ± standard deviation (SD). P-values were calculated with paired (o) or unpaired (d, k), two-tailed Student’s t test. n.s., not significant (P > 0.05). µM: micromolar, for all figures. Experiments in e-j, m are repeated twice with similar results. Source data for this figure are provided as a Source Data file.
Fig. 2
Fig. 2. SOC-induced DNA damage, G1 arrest and apoptosis are mediated by cAMP-regulated mitochondrial ROS generation.
a Relative cytoplasmic ROS levels in T47D cells treated with tamoxifen or fulvestrant or palbociclib in the presence or absence of NAC (n = 3). b MitoSOX staining in T47D cells upon treatment with SOC for 1 hour (n = 4). c, d Relative cAMP levels in T47D (c) and MCF-7 (d) cells treated with SOC (n = 3). e MitoSOX staining quantification in T47D cells upon treatment with SOC with or without 1-hour pretreatment with 50 µM of the PKA inhibitor, Rp-Cyclic AMPS (n = 3). f Western blot analyses of p-PKA (Thr197), γ-H2AX (S139) and p-Chk2 (Thr68) in T47D cells treated with SOC with or without 1-hour pretreatment with 50 µM of the PKA inhibitor, Rp-Cyclic AMPS. The experiment is repeated twice with similar results. g-i Percentage of apoptotic cells in T47D cells treated with tamoxifen (g), fulvestrant (h) or palbociclib (i) for 72 hours with or without 20 µM of the PKA inhibitor, Rp-Cyclic AMPS, measured by Annexin V/DAPI staining (n = 2). j COXIV-1 IP in SOC-treated T47D cells blotted for p-PKA substrate antibody. k Heatmap of proliferation score, SOC sensitivity score, cAMP score and DNA repair score in ER+ breast cancer patients from GSE93204 treated with endocrine therapy (ET), followed by addition of palbociclib (P) upon endocrine resistance development and finally underwent surgery. SENS represents sensitive patients at surgery while RES represents resistant patients. l Correlations of proliferation score, SOC sensitivity, cAMP and DNA repair scores in ER+ breast cancer patients from GSE93204 (n = 16 for BSL and ET, n = 13 for ET + P, n = 6 for SURG-sens and SURG-res). mp Changes of proliferation score (m), SOC sensitivity score (n), DNA repair score (o), and cAMP score (p) in paired samples of sensitive patients from baseline to 2 weeks of endocrine therapy treatment from GSE87411 (n = 27). Data are presented as mean values ± SD. P-values for the bar graphs were calculated with the unpaired, two-tailed Student’s t test while the P-value for m-p were calculated with the paired two-tailed Student’s t test. Source data for this figure are provided as a Source Data file.
Fig. 3
Fig. 3. SOC therapy triggers mitochondrial ROS generation, BRCAness and DNA damage via inhibiting PDE4D.
a Western blot analyses of ER and PDE4D in T47D cells treated with SOC in a time-dependent manner. b Quantification of PDE4D band intensities relative to actin in SOC-treated T47D cells in a time-dependent manner. c Relative cAMP levels in T47D cells treated with increasing doses of the PDE4D inhibitor, GebR-7b or the cAMP inducer, forskolin as a positive control (n = 3). d Western blot analyses of p-PKA and p-CREB in T47D cells treated with increasing doses of GebR-7b. e Relative ROS levels in T47D cells treated with increasing doses of GebR-7b (n = 3). f, g MitoSOX staining in T47D (f) and MCF-7 (g) cells upon treatment with increasing doses of GebR-7b (n = 4). h Western blot analyses of DNA damage, DNA repair, G1 arrest and apoptosis markers in T47D cells treated with increasing doses of GebR-7b for 24 hrs. i, j Percent growth inhibition in T47D (i) and MCF-7 (j) cells treated with increasing doses of GebR-7b for 3 days (n = 6 for control and n = 4 for GebR treatment for i; n = 4 for j). k MitoSOX staining in T47D cells upon treatment with SOC in the presence or absence of the PDE4D ORF (n = 3). l Western blot analyses of DNA damage and G1 arrest markers in T47D cells overexpressing PDE4D ORF and treated with tamoxifen. m-o Percentage growth inhibition in control (ctrl) vector vs. PDE4D vector-transfected T47D cells treated with increasing doses of tamoxifen (m) or fulvestrant (n) or palbociclib (o) for 2 days (n = 3). Data are presented as mean values ± SD. P-values were calculated with the unpaired, two-tailed Student’s t test. Experiments in a, h, l are repeated twice with similar results. Source data for this figure are provided as a Source Data file.
Fig. 4
Fig. 4. SOC therapy reduces ER signaling via modulating PDE4D/cAMP which in turn regulates ER activity in a feedforward loop.
a ERE reporter assay in E2-stimulated (10 nM) MCF-7 cells with or without SOC (n = 3). b, c qRT-PCR of PDE4D (b) (n = 3) and Western blot analyses of PDE4D, Cyclin D1 and BRCA1 (c) in MCF-7 cells stimulated with 10 nM E2 in the presence or absence of SOC. d ChIP assay of ER in MCF-7 cells showing binding to PDE4D promoter (n = 6). The putative ER binding sites on the PDE4D promoters are depicted. The isoforms PDE4D3, PDE4D8 and PDE4D9 express the 70 kDa protein. e GSEA analysis showing enrichment of genes upregulated in ER+ tumors among high PDE4D-expressing ER+/HER2- breast cancer patients’ tumors from GSE81538. f, g Relative growth (f) and ER activity (g) in MCF-7 cells stimulated with 10 nM E2 in the presence or absence of SOC, GebR-7b, BPN14770 or forskolin (n = 5). h, i Western blot analyses in MCF-7 cells treated with tamoxifen, GebR-7b or the ERK inhibitor, ulixertinib for 20 min (h) or 24 hours (i) in combination with E2. GAPDH is used as the loading control. j Western blot analysis of p-ER, ER and p-ERK in MCF-7 cells stimulated with E2 (10 nM) in the presence of PKA inhibitor (100 µM) with or without GebR-7b (20 µg/mL). Data are presented as mean values ± SD. P-values were calculated with the unpaired, two-tailed Student’s t test. Experiments in h-j are repeated twice with similar results Source data for this figure are provided as a Source Data file.
Fig. 5
Fig. 5. PDE4D mediates SOC resistance and inhibiting PDE4D induces BRCAness, DNA damage, PARP1 trapping and transcriptional blockage to restore SOC sensitivity.
a GSEA analysis showing enrichment of endocrine therapy resistance genes among high PDE4D-expressing endocrine resistant patients from GSE124647. b Kaplan-Meier overall survival analysis in endocrine-resistant metastatic ER+ breast cancer patients from GSE124647 based on PDE4D mRNA expression. c IHC images of ER+ breast cancer patient tissues with low and high PDE4D protein expression, together with the corresponding H&E staining in the Hacettepe cohort. d Chi-square testing showing significant association of high PDE4D protein expression with disease relapse. e, f Kaplan-Meier disease-free (e) and overall (f) survival analyses in endocrine-treated ER+ breast cancer patients from the Hacettepe cohort based on PDE4D protein expression. g Western blot analysis of PDE4D in SOC parental vs. resistant MCF-7 and T47D cells. h Relative cAMP levels in SOC parental vs. resistant T47D cells treated with SOC therapy (n = 3). i The heatmap of combination indices upon treatment of SOC resistant cells with the combination of SOC (fulvestrant: 0.05, 0.1, 05, 2.5, 10 µM for T47D and 1, 5, 10, 12.5, 25 µM for MCF-7; palbociclib: 0.25, 0.5, 1, 2.5, 3.5 µM for T47D and 5, 10, 12.5, 15, 16.5 µM for MCF-7) and the PDE4D inhibitor, GebR-7b (10, 15, 20 µg/mL). The scale bar for the combination index matrices is provided at the right-hand side, here and for all heatmaps. j Western blot analyses of DNA damage, DNA repair, G1 arrest and apoptosis markers in T47D FulvR cells treated with the combination of fulvestrant with GebR-7b. k Percent growth inhibition in T47D FulvR and PalboR cells upon PDE4D knockdown and treatment with fulvestrant or palbociclib, respectively for 3 days (n = 4). l Western blot analyses of DNA damage, G1 arrest and apoptosis markers in T47D FulvR cells upon PDE4D knockdown and treatment with fulvestrant. m Chromatin occupancy of PARP1 and HPF1 in T47D FulvR cells treated with fulvestrant in combination with GebR-7b. n Relative EU incorporation in T47D FulvR cells treated with the combination of fulvestrant and GebR-7b (n = 3). o Heatmaps of relative growth inhibition and combination indices in T47D FulvR cells treated with the combination of fulvestrant (0.05, 0.1, 0.5, 2.5, 10 µM) with olaparib (5, 7.5 µM). p Western blot analysis of DNA damage, DNA repair and G1 arrest markers in T47D FulvR cells treated with fulvestrant, olaparib or their combination. q-s Heatmaps of combination indices in primary cell cultures of HBCx-118 (BRCA2-mut) model treated with the combination of different SOC therapies (tamoxifen: 2, 3, 4, 4.5 µM; fulvestrant: 1, 5, 10, 20 µM; palbociclib: 0.5, 1, 1.5, 2.5 µM), and PDE4D inhibitors, GebR-7b (30, 40, 50, 60 µg/mL) (q) or BPN14770 (35, 40, 45, 50 µg/mL) (r) or with olaparib (2.5, 5, 7.5, 10 µM) (s). Data are presented as mean values ± SD. P-values for the bar graphs were calculated with the unpaired, two-tailed Student’s t test. Significance for the Kaplan-Meier survival graphs was calculated with Log-rank test. Chi-square test was used for d. NES: normalized enrichment score. Experiments in j, l, p are repeated twice with similar results. Source data for this figure are provided as a Source Data file.
Fig. 6
Fig. 6. A switch from ER to EGFR dependence characterizes SOC resistance, upstream of PDE4D, and inhibition of EGFR signaling overcomes SOC resistance.
a-c Relative growth of tamoxifen (a), fulvestrant (b) and palbociclib (c) resistant MCF-7 cells under E2-deprived media, treated with GebR-7b or BPN14770 (n = 4). d GSEA analysis showing enrichment of genes upregulated upon EGFR overexpression among high PDE4D-expressing ER+/HER2- breast cancer patients’ tumors from GSE81538. e, f EGFR array image (e) and its quantification (f) (n = 2) in T47D parental vs. fulvestrant resistant cells. g Western blot analysis of EGFR and its downstream pathways in parental vs. SOC-resistant T47D cells. For TamR and FulvR cells, EGFR/HER2 (Y1173/Y1248) is shown while for PalboR cells p-EGFR (Y845) is shown. h Western blot analysis of PDE4D and c-Jun in T47D and MCF-7 cells transfected with siJun and stimulated with EGF (20 nM) for 24 hours. i qRT-PCR analysis of PDE4D in T47D cells transfected with siJun and stimulated with EGF (n = 3). j ChIP assay of c-Jun in T47D cells stimulated with EGF for 16 hours to show binding to PDE4D promoter (n = 3 different wells). The putative c-Jun binding sites on the PDE4D promoters are depicted. The isoforms, PDE4D5, PDE4D7 and PDE4D4 express the 90 kDa protein, while PDE4D3, PDE4D8 and PDE4D9 express the 70 kDa protein. k Heatmaps of combination indices in SOC resistant cells treated with the combination of different SOC therapies (tamoxifen: 0.1, 1, 2.5, 5, 7.5 µM for T47D and 1, 2.5, 5, 7.5, 10 µM for MCF-7; fulvestrant: 0.05, 0.1, 05, 2.5, 10 µM for T47D and 1, 5, 10, 12.5, 25 µM for MCF-7; palbociclib: 0.25, 0.5, 1, 2.5, 3.5 µM for T47D and 5, 10, 12.5, 15, 16.5 µM for MCF-7) and gefitinib (5, 7.5, 10 µM). l Western blot analyses of PDE4D, DNA damage, DNA repair and G1 arrest markers in T47D FulvR cells treated with the combination of fulvestrant and gefitinib. m Chromatin occupancy of PARP1 and HPF1 in T47D FulvR cells treated with fulvestrant in combination with gefitinib. n Heatmaps of relative growth inhibition (upper panel) and combination indices (lower panel) in primary cell cultures of HBCx-118 model treated with the combination of different SOC therapies (tamoxifen: 2, 3, 4, 4.5 µM; fulvestrant: 1, 5, 10, 20 µM; palbociclib: 0.5, 1, 1.5, 2.5 µM) and gefitinib (1, 5, 7.5, 10 µM). Data are presented as mean values ± SD. P values were calculated with the unpaired, two-tailed Student’s t test. NES: normalized enrichment score. Experiments in g, l, m are repeated twice with similar results. Source data for this figure are provided as a Source Data file.
Fig. 7
Fig. 7. Targeting PDE4D or EGFR overcomes resistance to fulvestrant and palbociclib in PDX organoids and in vivo.
a, b HBCx-118 organoid growth upon the combination of PDE4D inhibitor, GebR-7b (30 µg/mL) and SOC therapies (fulvestrant (a) or palbociclib (b)) for a week (n = 3 different wells). c Representative images from HBCx-118 organoids treated with the combination of SOC therapies (fulvestrant or palbociclib) and GebR-7b. Scale bar=50 µm. d Tumor growth curves of HBCx-118 PDXs upon treatment with fulvestrant (35 mg/kg, subcutaneous) or palbociclib (35 mg/kg, oral gavage) in combination with PDE4D inhibitor, GebR-7b (3 µg/kg, intraperitoneal) (n = 5–8). e H&E and Ki67 staining of HBCx-118 PDX tumors treated with fulvestrant or palbociclib in combination with GebR-7b. Scale bar=100 µm. f Quantification of Ki67 staining in tumors from d (n = 10). The center line shows the median, the box limits show the 75th and 25th percentiles and the whiskers show minimum-maximum values. g. TUNEL staining of tumors from d. Scale bar=100 µm. Data for the bar graphs and box plots are represented as mean values ± SD, while data for the tumor volume graph are represented as mean values ± standard error of the mean (SEM). P values for the bar graphs were calculated with the unpaired, two-tailed Student’s t test. The significance for the tumor volume graph and box plot were calculated with two-way and one-way ANOVA, respectively. Source data for this figure are provided as a Source Data file.
Fig. 8
Fig. 8. Targeting PDE4D, EGFR or PARP1 using clinically tested or approved inhibitors overcomes resistance to standard-of-care fulvestrant+palbociclib therapy in PDX organoids and in vivo.
a HBCx-118 organoid growth under the combination of fulvestrant and palbociclib (F + P, Dose #1: 2.5 µM fulvestrant and palbociclib; Dose #2: 5 uM fulvestrant and 2.5 µM palbociclib) with the PDE4D inhibitor, BPN-14770 (50 µg/mL) or pan-HER inhibitor, neratinib (0.5 µM), or PARP1 inhibitor, olaparib (5 µM) for a week (n = 3 different wells). b Representative images from HBCx-118 organoids from a. Scale bar=50 µm. c HBCx-131 organoid growth upon the combination of fulvestrant and palbociclib (F + P) with the PDE4D inhibitor, BPN-14770 (50 µg/mL) or pan-HER inhibitor, neratinib (0.5 µM) for a week (n = 3 different wells). d Percentage organoid growth inhibition of HBCx-131 model treated with fulvestrant (5 µM) + palbociclib (5 µM) in combination with olaparib (10 µM) (n = 3 different wells). e Tumor growth curves of HBCx-118 PDXs upon treatment with fulvestrant (20 mg/kg, subcutaneous) plus palbociclib (20 mg/kg, oral gavage) in combination with PDE4D inhibitor, BPN14770 (0.75 mg/kg, oral gavage) or the pan-HER inhibitor, neratinib (15 mg/kg, oral gavage) (n = 4-6). f Tumor pictures at the end of the experiment from e. g Western blot analysis of DNA damage and G1 arrest markers in 3 separate HBCx-118 tumors, collected from different mice treated with fulvestrant plus palbociclib with or without BPN14770 or neratinib. h, i Tumor growth curves (h) and representative tumor images (i) of HBCx-118 (BRCA2-mut) model upon treatment with fulvestrant (F, 25 mg/kg, subcutaneous) + palbociclib (P, 25 mg/kg, p.o.) in combination with PARP inhibitor, olaparib used at a low-to-moderate dose (35 mg/kg) (n = 7 different mice for vehicle, F + P and F + P+olaparib, and n = 6 different mice for olaparib in h). j Western blot analysis of the markers in 3 separate HBCx-118 PDX tumors, collected from different mice treated with the combination of F + P and olaparib. k, l Tumor growth curves (k) and representative tumor images (l) of HBCx-131 (BRCA1/2-wt) model upon treatment with fulvestrant (F), 25 mg/kg, subcutaneous + palbociclib (P), 25 mg/kg, p.o. in combination with BPN14770 (0.75 mg/kg, p.o.), neratinib (15 mg/kg, p.o.) or olaparib (35 mg/kg, p.o.) (n = 6 different mice for each group in k). m Tumor weight measurements of tumors from k (n = 6 different tumors). Data for the bar graphs and box plots are represented as mean values ± SD, while data for the tumor volume graph are represented as mean values ± standard error of the mean (SEM). P-values for the bar graphs and box plots were calculated with the unpaired, two-tailed Student’s t test. Significance for the tumor volume graphs was calculated with two-way ANOVA. Source data for this figure are provided as a Source Data file.
Fig. 9
Fig. 9. Schematic summary of the proposed mechanism of SOC sensitivity/resistance and overcoming resistance via targeting EGFR/PDE4D/PARP1 axis.
a In SOC-sensitive ER+ breast cancer cells, SOC therapies (here: tamoxifen, fulvestrant, and palbociclib) target ER and thereby reducing PDE4D expression, which is a novel ER target gene. Upon reduced PDE4D, cAMP accumulates that further activates PKA, leading to phosphorylation of mitochondrial COXIV subunit I (COXIV-1), mitochondrial stress, generation of reactive oxygen species (ROS) and DNA damage. Meanwhile, PDE4D acts in a feedforward loop with ER, increasing the ER transcriptional activity by inhibiting PKA and activating ERK1/2-mediated ER phoshorylation, leading to the expression of ER targets, including BRCA1 and BRCA2. PDE4D reduction upon SOC treatment, on one hand, facilities the inhibitory effects of SOC on ER, and on the other hand, generates a BRCAness phenotype, rendering the BRCA1/2-wt cells sensitive to ROS-induced DNA damage. The SOC-induced DNA damage and BRCAness are followed by PARP1 trapping in complex with its interactor, HPF1. Ultimately, toxic PARP1 accumulation on the chromatin counteracts with transcription shown by increased H3S10 ADPR (PAR) and reduced H3K9Ac (acetylation), leading to blockage of global transcription, induction G1 arrest and apoptosis (left panel). In SOC-resistant cells, the ER to EGFR switch mediates PDE4D transcription via c-Jun, and thereby counteracts the SOC-induced cAMP induction, ROS generation, DNA damage, transcription blockage, G1 arrest and apoptosis (right panel). Dashed lines represent inhibited events. b Targeting either PDE4D or EGFR in combination with SOC therapy in SOC-resistant cells restores cAMP induction and the downstream ROS-DNA damage-PARP1 trapping axis, leading to SOC sensitization irrespective of the BRCA1/2 status. Similarly, targeting PARP1 with PARP inhibitors overcomes SOC resistance, showing the key roles of PARP1 trapping in SOC sensitivity. The figure is created with BioRender.com.

References

    1. Bray F, et al. Global cancer statistics 2018: GLOBOCAN estimates of incidence and mortality worldwide for 36 cancers in 185 countries. CA Cancer J. Clin. 2018;68:394–424. - PubMed
    1. DeSantis CE, et al. Breast cancer statistics, 2019. CA Cancer J. Clin. 2019;69:438–451. - PubMed
    1. Lin NU, Winer EP. Advances in adjuvant endocrine therapy for postmenopausal women. J. Clin. Oncol. 2008;26:798–805. - PubMed
    1. Herrera-Abreu MT, et al. Early Adaptation and Acquired Resistance to CDK4/6 Inhibition in Estrogen Receptor-Positive Breast Cancer. Cancer Res. 2016;76:2301–2313. - PMC - PubMed
    1. Lloyd MR, Spring LM, Bardia A, Wander SA. Mechanisms of Resistance to CDK4/6 Blockade in Advanced Hormone Receptor-positive, HER2-negative Breast Cancer and Emerging Therapeutic Opportunities. Clin. Cancer Res. 2022;28:821–830. - PubMed

Publication types

MeSH terms