. 2023 Nov 1;14(1):6770.
doi: 10.1038/s41467-023-42150-4.

ARF1 prevents aberrant type I interferon induction by regulating STING activation and recycling

Affiliations

ARF1 prevents aberrant type I interferon induction by regulating STING activation and recycling

Maximilian Hirschenberger et al. Nat Commun. .

Abstract

Type I interferon (IFN) signalling is tightly controlled. Upon recognition of DNA by cyclic GMP-AMP synthase (cGAS), stimulator of interferon genes (STING) translocates along the endoplasmic reticulum (ER)-Golgi axis to induce IFN signalling. Termination is achieved through autophagic degradation or recycling of STING by retrograde Golgi-to-ER transport. Here, we identify the GTPase ADP-ribosylation factor 1 (ARF1) as a crucial negative regulator of cGAS-STING signalling. Heterozygous ARF1 missense mutations cause a previously unrecognized type I interferonopathy associated with enhanced IFN-stimulated gene expression. Disease-associated, GTPase-defective ARF1 increases cGAS-STING dependent type I IFN signalling in cell lines and primary patient cells. Mechanistically, mutated ARF1 perturbs mitochondrial morphology, causing cGAS activation by aberrant mitochondrial DNA release, and leads to accumulation of active STING at the Golgi/ERGIC due to defective retrograde transport. Our data show an unexpected dual role of ARF1 in maintaining cGAS-STING homeostasis, through promotion of mitochondrial integrity and STING recycling.


Conflict of interest statement

The authors declare no competing interests.

Figures

Fig. 1
Fig. 1. Genetic identification of ARF1 R99C and clinical phenotype.
ag Erythematous vasculitic chilblain-like lesions on the hands (a) and face (b) of AGS460 aged 9 years. Right hand of the same patient at age 18 years showing frank tissue loss (c). Similar lesions were observed on the hands and feet of patients RH2003 (d, e) and KW2022 (f, g), at the ages of 18 and 2 years respectively. h Schematic overview of the domain structure of ARF1. Residue R99 is indicated by a red arrow. SW, Switch domain. i Multiple sequence alignment showing the conservation of residue R99 of ARF1 in indicated species. j ISG profile of patient AGS3133 (red) compared to the average of 27 healthy donors (blue). n = 27 (blue bars, healthy donors) ± SD; n = 1 (red bars, patient). See also Supplementary Fig. 1.
Fig. 2
Fig. 2. Expression of ARF1 R99C induces a STING-dependent type I IFN response.
a ISRE promoter activity by SEAP reporter in 293-Dual-hSTING-R232 cells transiently expressing FLAG-tagged ARF1 WT, R99C, Q71L or T31N on (32 h post transfection and normalised to cell viability). Dots represent mean of n = 3 ± SEM (biological replicates). Lower panel: Corresponding immunoblots of whole-cell lysates (WCLs) stained with anti-FLAG. b Area under the curve analysis of the data in (a). c ISRE promoter activity by Firefly luciferase (Fluc) quantification in HEK293T cells transiently expressing STING (+STING) or empty vector (-STING) and FLAG-tagged ARF1 WT and R99C (32 h post transfection and normalised to GAPDH-Renilla luciferase). Dots represent mean of n = 3 ± SEM (biological replicates). Lower panel: Corresponding immunoblots of WCLs stained by anti-FLAG. d, e ISRE (d) or NF-κB (e) promoter activity in A549 Dual cells transduced with ARF1 WT and R99C. IFN-β (1000 U/mL, 16 h) and cGAMP (10 µg/ml, 16 h) served as positive controls. Bars represent mean of n = 3 ± SEM (biological replicates). Lower panels: Corresponding immunoblots of WCLs stained by anti-FLAG, anti-STING and anti-GAPDH. f Exemplary immunoblot of HEK293T WCLs transiently expressing indicated ARF1 constructs, cGAS and STING. Blots were stained with anti-pTBK1, anti-TBK1, anti-IRF3, anti-FLAG and anti-GAPDH. g Quantification of the pTBK1 band intensities in (f) normalized to TBK1. Bars represent mean of n = 4 (vector, WT), n = 3 (R99C, Q71L, T31N) ± SEM (biological replicates). h qPCR of OAS1 mRNA in primary normal human lung fibroblasts transduced to express ARF1 WT and R99C 72 h post transduction. IFN-β (1000 U/mL, 16 h) and cGAMP (10 µg/ml, 16 h). Bars represent mean of n = 3 (cGAMP, IFN-β) and n = 6 (vector, WT, R99C) ± SEM (biological replicates). Lower panel: Corresponding immunoblots of WCLs stained with anti-FLAG, anti-STING and anti-GAPDH. i Supernatant (SN) transfer of primary fibroblasts from healthy donors (n1, f1) or a patient (AGS460) to 293-Dual-hSTING-R232 cells. IFN-β (100 U/mL, 48 h) and cGAMP (10 µg/ml, 48 h). SEAP (ISRE) activity 48 h post transfer and normalised to cell viability. Bars represent mean of n = 5 (n1) and n = 6 (f1, R99C, cGAMP) ± SEM (biological replicates). See also Supplementary Fig. 2. Statistical analysis was performed using two-tailed Student’s t test with Welch’s correction. *p < 0.05; **p < 0.01; ***p < 0.001. Exact P values and Source data are provided in the Source data file.
Fig. 3
Fig. 3. ARF1 R99C disrupts mitochondria, releasing mtDNA into the cytoplasm.
a ISRE promoter activity quantified by Lucia luciferase (LLuc) in THP-1-Dual WT (grey) or cGAS KO (pink) transduced to express ARF1 WT or R99C (72 h post transduction). IFN-β (1000 U/mL, 16 h) and cGAMP (10 µg/ml, 16 h). Bars represent mean of n = 3 ± SEM (biological replicates). Lower panel: Corresponding immunoblots of WCLs stained by anti-FLAG, anti-STING, anti-cGAS and anti-GAPDH. b Exemplary electron microscopy analysis of HEK293T cells transiently expressing ARF1 WT or R99C. Electron-dense granules, black arrows. Inflated cristae, white arrows. cp, cytoplasm. er, endoplasmic reticulum. g, Golgi apparatus. lv, large vesicle. ly, lysosome. m, mitochondria. nc, nucleus. c Exemplary immunoblots showing fractionation of HEK293T cells transiently expressing ARF1 WT, R99C, Q71L or vector. WCLs and fraction blots stained with anti-FLAG, anti-TFAM, anti-LAMIN B1 and anti-GAPDH. This experiment was repeated to similar results independently at least two times. d qPCR of mtDNA (MT-D-Loop) in the cytosolic fraction of (c) normalized to cellular mtDNA (mtDNA/nuclear DNA). n = 3 ± SEM. e qPCR of mtDNA (MT-D-Loop) in the cytosolic fraction of primary fibroblasts of healthy donors (n2, f1, I7) or patient (AGS460) relative to total normalized cellular mtDNA (mtDNA/nuclear DNA). n = 5 ± SEM. f qPCR of OAS1 mRNA in U2OS cells stably expressing STING and depleted of mtDNA by ddC, or untreated (NT). Transiently transfected with empty vector, ARF1 WT or R99C. n = 6 ± SEM. g Exemplary live cell confocal laser scanning microscopy images of HeLa cells transiently expressing TagRFP-tagged ARF1 WT, R99C or vector control (red). Cells were stained with Mitotracker (grey, 1 µM, 30 min, 37 °C). Nuclei, Hoechst (blue). Scale bar, 10 μm. h Analysis of the perimeter, circularity, branch length (per cell) and branches (per cell) of the images in (g). Lines represent mean of n = 37 (WT, perimeter), n = 29 (R99C, perimeter), n = 80 (WT, circularity), n = 60 (R99C, circularity), n = 40 (WT, branch length, branches), n = 29 (R99C, branch length, branches) ± SEM. i Exemplary immunoblot of WCLs of HEK293T cells transiently expressing ARF1 WT, R99C or vector. Blots were stained with anti-MFN1, anti-RHOT1, anti-FLAG and anti-GAPDH. Quantification of the band intensities of MFN1 normalized to GAPDH. Bars represent mean of n = 6 ± SEM (biological replicates). j qPCR of mtDNA (MT-D-Loop) in the cytosolic fraction of HEK293T cells transiently expressing ARF1 WT, R99C or vector control as well as VCP normalized to cellular mtDNA (mtDNA/nuclear DNA). n = 5 ± SEM. See also Supplementary Fig. 3. Statistical analysis was performed using two-tailed Student’s t test with Welch’s correction or two-way ANOVA (f). *p < 0.05; **p < 0.01; ***p < 0.001. Exact P values and Source data are provided in the Source data file.
Fig. 4
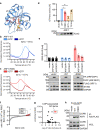
Fig. 4. GTPase activity of ARF1 R99C is reduced.
a Model of ARF1 (PDB: 2J59) ATP-bound (orange/yellow). R99 and D26 are highlighted. b, c Interaction of ARF1 WT (b) or R99C (c) with GTP and protein stability analysed by fluorescence thermal shift assay. Data are representative of two biological replicates. d GTPase activity of indicated ARF1 mutants purified from HEK293T cells expressing FLAG-ARF1. Lower panel: Corresponding immunoblot stained with anti-FLAG. Bars represent mean of n = 4 ± SEM (biological replicates). e ISRE promoter activity in 293-Dual-hSTING-R232 cells quantified by SEAP transiently expressing ARF1 WT or R99C with indicated GEF or GAP normalized to cell viability. Corresponding immunoblots of WCLs stained with anti-HA, anti-turboGFP (tGFP), anti-FLAG, anti-STING and anti-GAPDH. Bars represent mean of n = 3 ± SEM (biological replicates). f Protein abundance in ARF1 WT versus R99C large scale purification from HEK293T cells as assessed by SILAC mass spectrometry. Components of the COPI machinery are highlighted in red. g Gene Ontology Analysis (PantherDB) of the top 30 proteins less associated with ARF1 R99C in (f). Fold enrichment of individual GO terms versus the −log P value. COPI-associated GO terms are highlighted in red. h Co-immunoprecipitation using anti-FLAG beads from WCLs of HEK293T cells transiently expressing FLAG-ARF1 WT, R99C or vector. Immunoblots stained with anti-COPB, anti-ARF1 and anti-GAPDH. Asterisk denotes unspecific background band. The experiment was repeated three times independently to similar results. See also Supplementary Fig. 4. Statistical analysis was performed using two-tailed Student’s t test with Welch’s correction. *p < 0.05; **p < 0.01; ***p < 0.001. Exact P values and Source data are provided in the Source data file.
Fig. 5
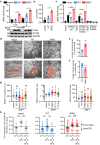
Fig. 5. ARF1 is responsible for retrograde transport from the Golgi/ERGIC to the ER.
a ISRE promoter activity quantified by SEAP in 293-Dual-hSTING-R232 cells transiently expressing FLAG-tagged ARF1 WT or R99C (32 h post transfection, normalized to cell viability). cGAMP (1.25 µg/ml or 5 µg/ml, 16 h). Bars represent mean of n = 3 ± SEM (biological replicates). Lower panel: Representative corresponding immunoblots stained with anti-FLAG, anti-STING and anti-GAPDH. b Area under the curve analysis of the data in (a). c ISRE-promoter activity quantified by firefly luciferase in HEK93T cells transiently expressing ARF1 WT or R99C in the presence of indicated STING mutants (32 h post transfection, normalised to GAPDH-Renilla luciferase). Bars represent mean of n = 3 ± SEM (biological replicates). d Representative electron microscopic images of HEK293T cells transiently expressing indicated ARF1 mutants. Luminal area (orange). Scale bar, 0.5 μm. e Golgi/ERGIC luminal volume and f associated vesicle volume quantified in tomograms of cells in (d), as percentage of the total volume of the analysed section. Bars represent mean of n = 9 ± SEM (images). g Quantification of particles of ERGIC-53 staining (left panel), particle size (middle panel) or the total are (right panel), in HeLa cells transiently expressing ARF1 WT, R99C, Q71L or T31N. Cells were stained 24 h post transfection with anti-ERGIC-53 and anti-FLAG. Black lines represent mean of n = 61 (vector), n = 39 (WT), n = 45 (R99C), n = 41 (Q71L, T31N) ± SEM (individual cells). h Pearson’s correlation coefficient indicating co-localisation between GM130 and thermosensitive VSV-G (VSVG-ts045) in HeLa cells transiently expressing VSVG-ts045-KDELR, ARF1 WT or ARF1 R99C. Temperature shifts (37 °C/32 °C/40 °C) as indicated. Lines represent mean of n = 27/19/27 (vector, 37 °C/32 °C/40 °C), n = 24/27/14 (WT, 37 °C/32 °C/40 °C), n = 29/23/18 (R99C, 37 °C/32 °C/40 °C) ± SEM (cells). See also Supplementary Fig. 5. Statistical analysis was performed using two-tailed Student’s t test with Welch’s correction.: *p < 0.05; **p < 0.01; ***p < 0.001. Exact P values and Source data are provided in the Source data file.
Fig. 6
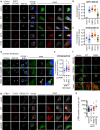
Fig. 6. STING accumulates at the ERGIC in the presence of ARF1 R99C.
a Exemplary confocal laser scanning microscopy images of HeLa cells transiently expressing STING-eGFP (green) and FLAG-tagged ARF1 mutants (red). Cells were stained 24 h post transfection with anti-FLAG and anti-GM130 (grey). Nuclei, DAPI (blue). Scale bar, 10 µm or 5 μm (inset). b Quantification of the co-localisation of ARF1 and GM130 and c STING and GM130 from the images shown in (a), as Pearson’s correlation coefficient. Lines represent mean of n = 26 (vector), n = 21 (WT, R99C), n = 19 (Q71L), n = 20 (T31N) ± SEM (individual cells). d Exemplary confocal laser scanning microscopy images of primary fibroblasts from healthy donors or patient. cGAMP (10 µg/ml, 3 h). Cells were stained with anti-STING (green) and anti-GM130 (grey). Nuclei, DAPI (blue). Scale bar, 10 µm or 5 μm (inset). e Quantification of the co-localisation of STING and GM130 from (d) as Pearson’s correlation coefficient. Lines represent mean of n = 71 (WT), n = 70 (WT + cGAMP), n = 75 (R99C) ± SEM (individual cells). f Exemplary STED super-resolution microscopy images primary human lung fibroblasts (NHLF) transduced with lentiviruses expressing ARF1 constructs or empty vector. Cells were stained with anti-STING (green), anti-FLAG (not shown) and anti-GM130 (red) 48 h post transduction. Scale bar, 5 µm or 1 μm (inset merge, bottom panel). The experiment was repeated two times independently to similar results. g pTBK1 (green) in NHLF cells transduced with lentiviruses expressing indicated FLAG-tagged ARF1 constructs. Cells were stained with anti-FLAG (red) and anti-ERGIC-53 (white). cGAMP (10 µg/ml, 3 h). Scale bar, 10 µm or 5 μm (inset). h Quantification of the area of pTBK1 in (g). Lines represent mean of n = 50 (vector), n = 16 (WT), n = 27 (R99C), n = 61 (cGAMP) ± SEM (individual cells). See also Supplementary Fig. 6. Statistical analysis was performed using two-tailed Student’s t test with Welch’s correction. *p < 0.05; **p < 0.01; ***p < 0.001. Exact P values and Source data are provided in the Source data file.

References

    1. Schoggins JW. Interferon-stimulated genes: what do they all do? Annu. Rev. Virol. 2019;6:567–584. - PubMed
    1. Sparrer KMJ, Gack MU. Intracellular detection of viral nucleic acids. Curr. Opin. Microbiol. 2015;26:1–9. - PMC - PubMed
    1. Koepke L, Gack MU, Sparrer KM. The antiviral activities of TRIM proteins. Curr. Opin. Microbiol. 2021;59:50–57. - PMC - PubMed
    1. Crow, Y. J. & Stetson, D. B. The type I interferonopathies: 10 years on. Nat. Rev. Immunol. 22, 471–483 (2022). - PMC - PubMed
    1. Crow YJ. Type I interferonopathies: a novel set of inborn errors of immunity. Ann. N. Y. Acad. Sci. 2011;1238:91–98. - PubMed

Publication types

MeSH terms