. 2023 Nov;623(7986):423-431.
doi: 10.1038/s41586-023-06675-4. Epub 2023 Nov 1.

Mouse genome rewriting and tailoring of three important disease loci

Affiliations

Mouse genome rewriting and tailoring of three important disease loci

Weimin Zhang et al. Nature. 2023 Nov.

Abstract

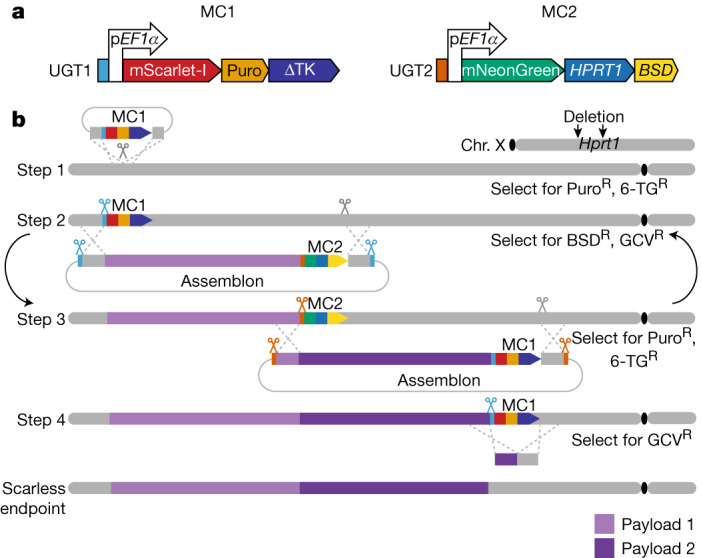
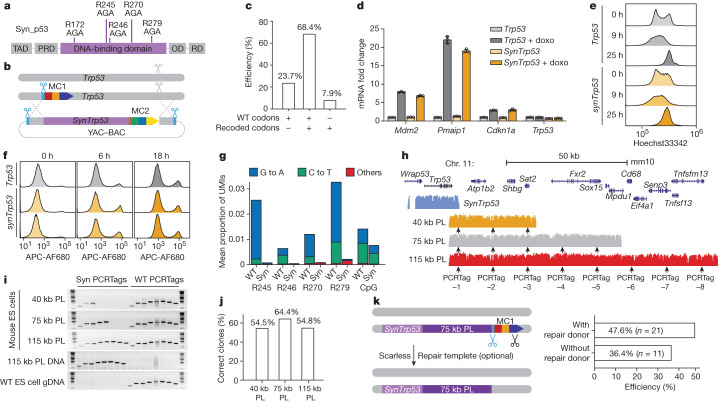
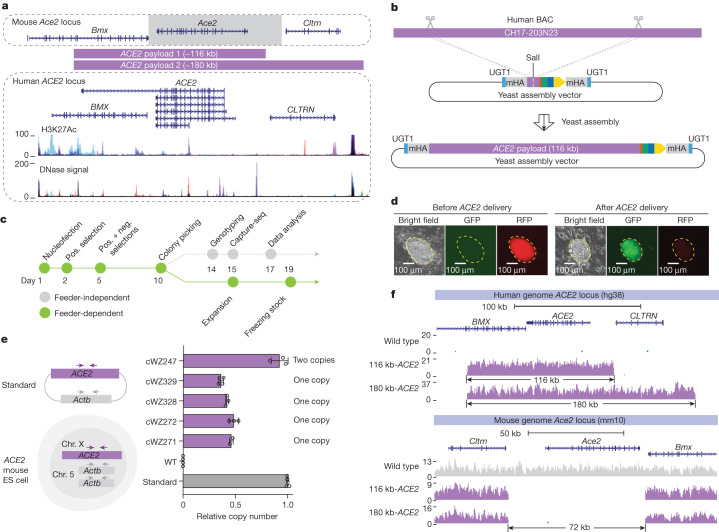
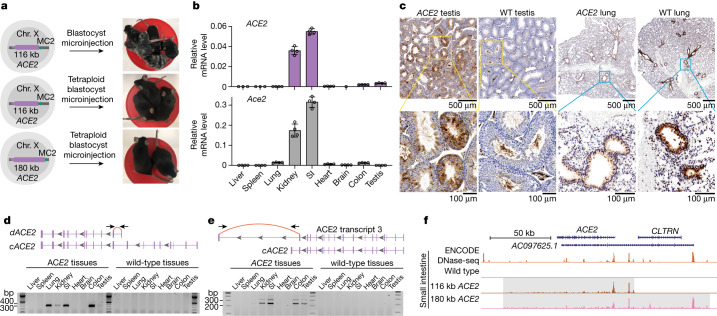
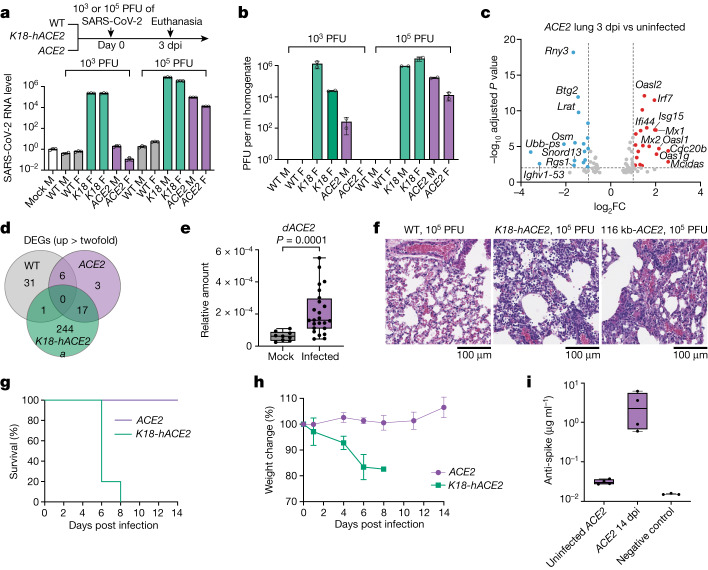
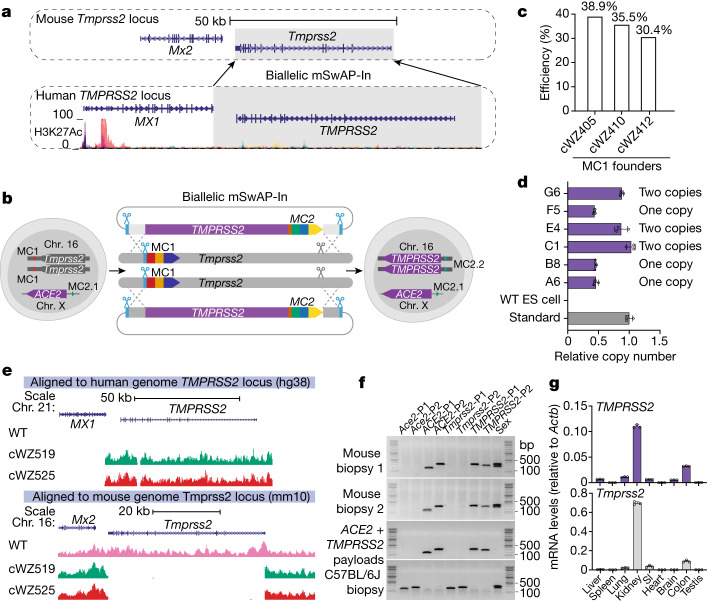
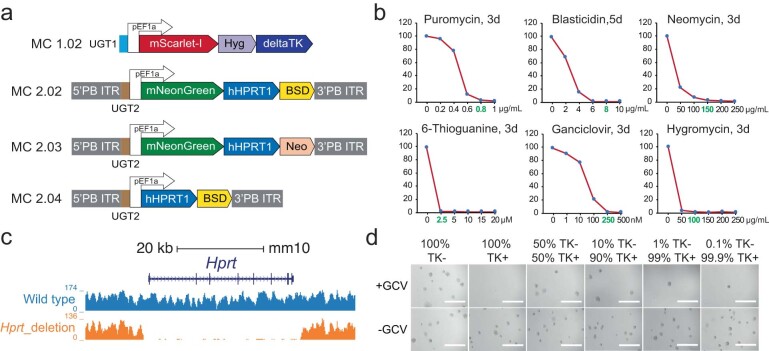
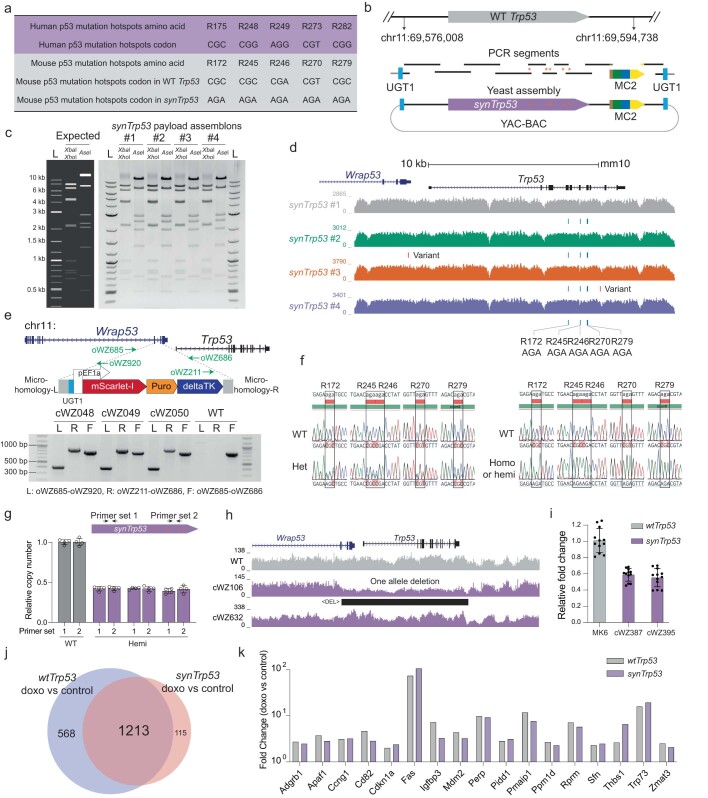
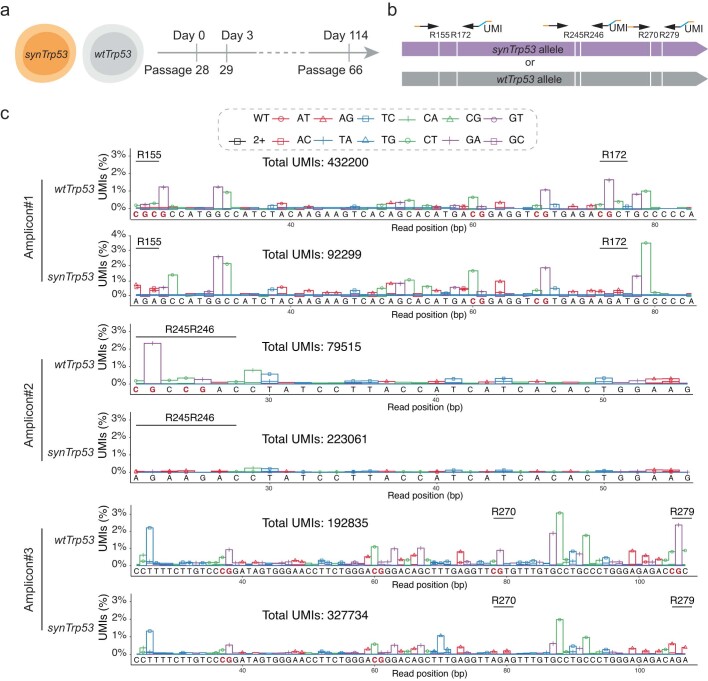
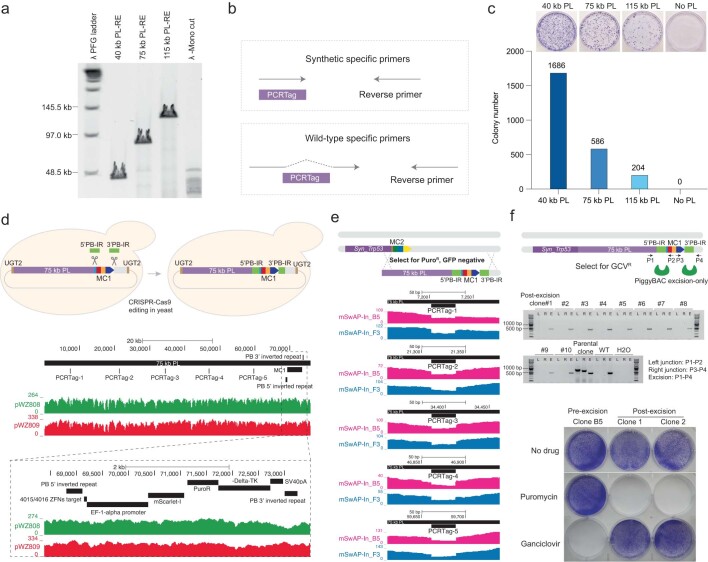
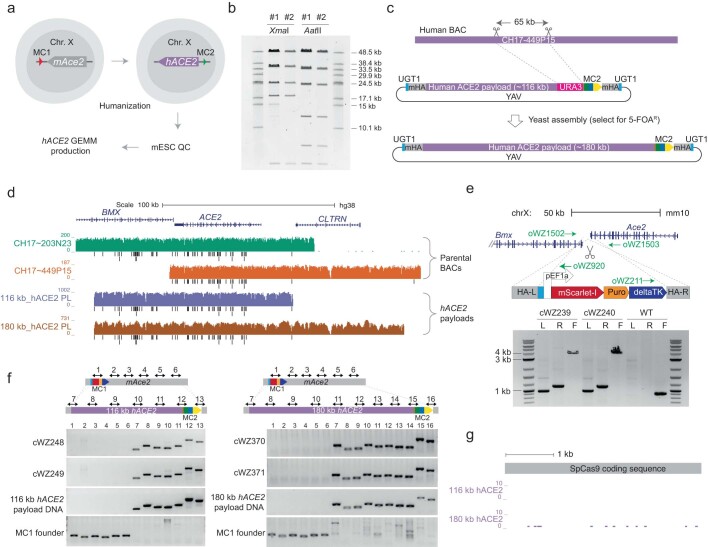
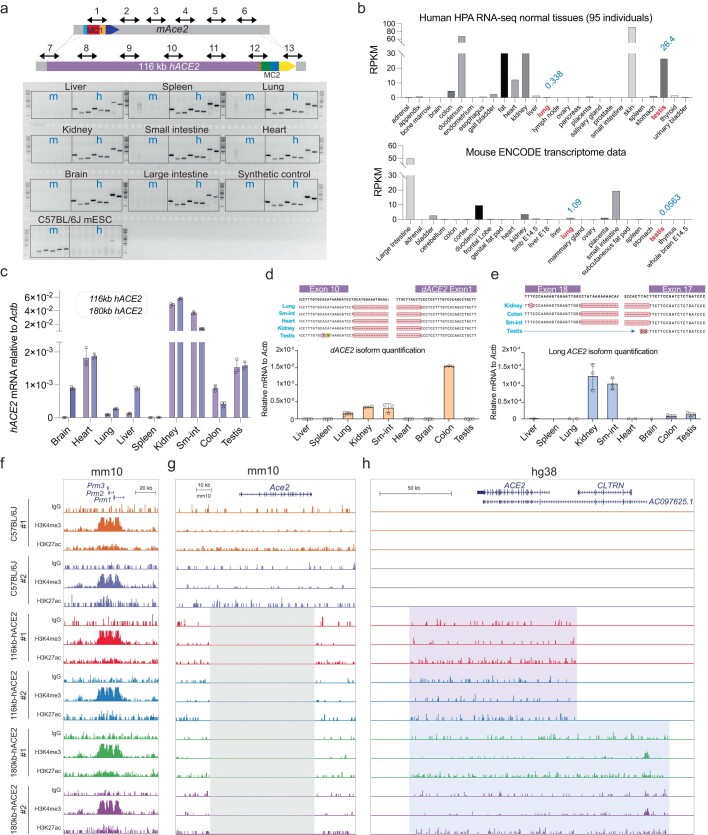
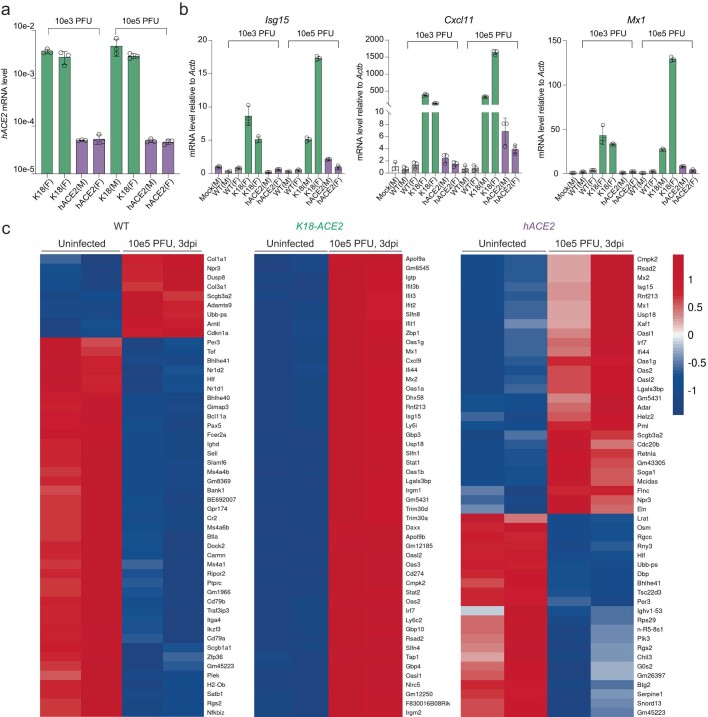
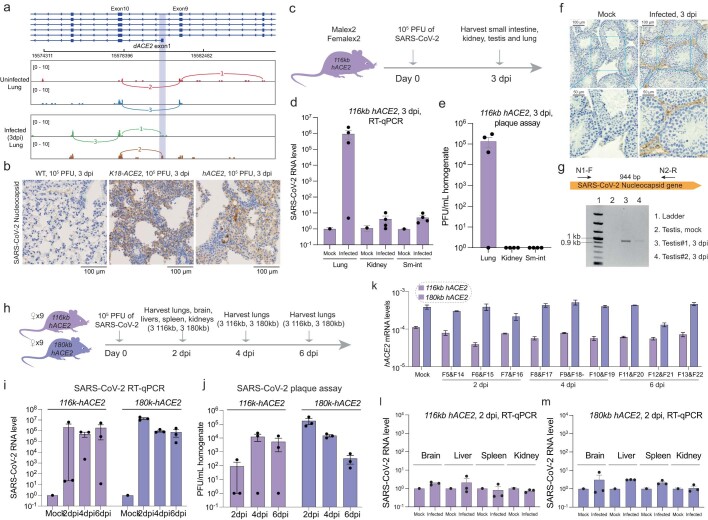
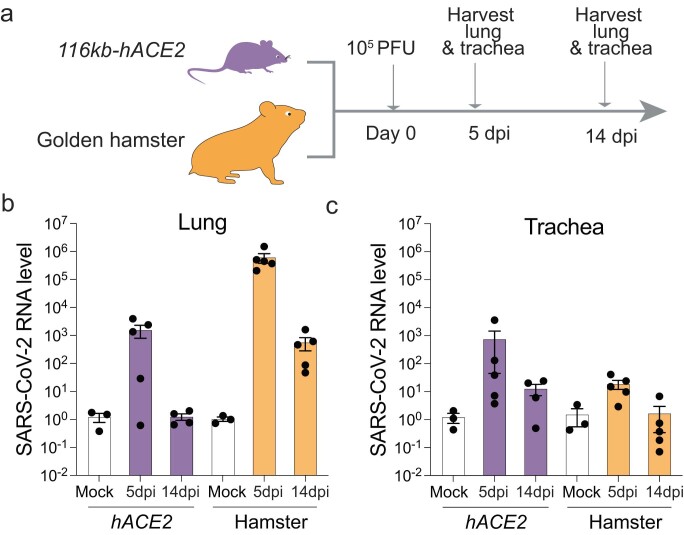
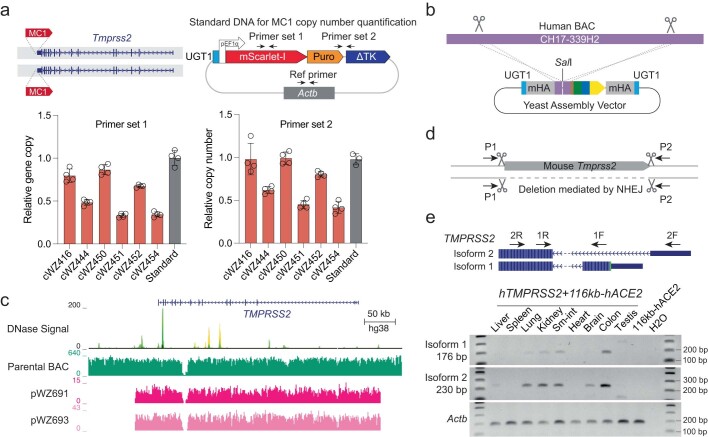
Genetically engineered mouse models (GEMMs) help us to understand human pathologies and develop new therapies, yet faithfully recapitulating human diseases in mice is challenging. Advances in genomics have highlighted the importance of non-coding regulatory genome sequences, which control spatiotemporal gene expression patterns and splicing in many human diseases1,2. Including regulatory extensive genomic regions, which requires large-scale genome engineering, should enhance the quality of disease modelling. Existing methods set limits on the size and efficiency of DNA delivery, hampering the routine creation of highly informative models that we call genomically rewritten and tailored GEMMs (GREAT-GEMMs). Here we describe 'mammalian switching antibiotic resistance markers progressively for integration' (mSwAP-In), a method for efficient genome rewriting in mouse embryonic stem cells. We demonstrate the use of mSwAP-In for iterative genome rewriting of up to 115 kb of a tailored Trp53 locus, as well as for humanization of mice using 116 kb and 180 kb human ACE2 loci. The ACE2 model recapitulated human ACE2 expression patterns and splicing, and notably, presented milder symptoms when challenged with SARS-CoV-2 compared with the existing K18-hACE2 model, thus representing a more human-like model of infection. Finally, we demonstrated serial genome writing by humanizing mouse Tmprss2 biallelically in the ACE2 GREAT-GEMM, highlighting the versatility of mSwAP-In in genome writing.


Conflict of interest statement

J.D.B. is a founder and director of CDI Labs, a founder of and consultant to Neochromosome, a founder, scientific advisory board member of and consultant to ReOpen Diagnostics, and serves or served on the scientific advisory board of the following: Logomix, Modern Meadow, Rome Therapeutics, Sample6, Sangamo, Tessera Therapeutics and the Wyss Institute. The mSwAP-In method described here is the subject of a pending patent application. The other authors declare no competing interests.

Figures

Fig. 1
Fig. 1. The mSwAP-In strategy for genome writing.
a, Two interchangeable marker cassettes (MC1 and MC2) underlie mSwAP-In selection and counterselection. BSD, blasticidin S deaminase; Puro, puromycin resistance gene; ΔTK, truncated version of HSV1 thymidine kinase. b, Stepwise genome rewriting using mSwAP-In. A prior engineering step to delete endogenous Hprt1 enables later iteration. Step 1: integration of MC1 upstream of locus of interest. Step 2: delivery of payload DNA including MC2 and Cas9–gRNAs for integration through HR. Step 3: delivery of next payload DNA following the same strategy as step 2, swapping back to MC1. Iterative steps 2 and 3 can be repeated indefinitely using a series of synthetic payloads by alternating selection for MC1 and MC2 (curved arrows). Step 4: removal of final MC1 or MC2. Grey bars are native chromosome regions; purple bars are synthetic incoming DNAs; blue and brown scissors are universal Cas9–gRNAs that cut UGT1 and UGT2, respectively; grey scissors are genome-targeting Cas9–gRNAs. Superscript R indicates resistance to puromycin (PuroR), 6-thioguanine (6-TGR), blasticidin (BSDR) or ganciclovir (GCVR). Chr., chromosome.
Fig. 2
Fig. 2. Rewriting the Trp53 locus with mSwAP-In.
a, Design of p53 hotspot mutation recoding. Top, recoded codons. OD, oligomerization domain; PRD, proline-rich domain; RD, regulatory domain; TAD, transactivation domain. b,c, Schematic (b) and efficiency (c) of synTrp53 mSwAP-In. WT, wild type. d, Functional evaluation of recoded synTrp53. Mouse ES cells with either WT Trp53 or synTrp53 were treated with 250 nM of doxorubicin (doxo) for 20 h. Levels of Mdm2, Pmaip1, Cdkn1a and Trp53 mRNA were evaluated by RT–qPCR. mRNA levels were normalized to Actb. Data are mean ± s.d. of three technical replicates. e, Histogram of DNA content in mouse ES cells stained with Hoechst33342. f, Histogram of Alexa Fluor 680 conjugated to annexin V, the showing apoptotic cell population. g, Mutation frequencies at four mutational hotspots and remaining (non-recoded) CpG sites in Trp53 WT or synTrp53 (syn) mouse ES cells. Mutation frequencies were calculated by averaging UMI frequencies of analysed codons or dinucleotides. R155 and R172 codons from first amplicon were excluded because a similar genomic sequence was amplified from a Trp53 pseudogene, rendering those data uninformative. h, Sequence coverage of synTrp53 and three Trp53 downstream tailored payloads (PL) aligned to mm10. Arrows indicate positions of PCRTags. i, Genotyping of three representative mSwAP-In integrants from three Trp53 downstream PL. j, Summary of mSwAP-In success rates based on genotyping. k, Strategy for final marker cassette removal and genotyping-based summary of efficiency. Blue scissors indicate UGT1-targeting gRNA; black scissors indicate gRNA targeting the SV40 terminator.
Fig. 3
Fig. 3. Fully humanizing ACE2 in mouse ES cells.
a, Genome browser screenshots of mouse Ace2 and human ACE2 loci. H3K27 acetylation and DNase signal tracks in the ACE2 locus indicate functional regulatory elements. The grey box demarcates the overwritten mouse genomic region. Purple bars demarcate human genomic regions included in ACE2 payloads. b, ACE2 payload assembly strategy. Scissors mark in vitro CRISPR–Cas9 digestion sites. mHA, mouse homology arm. c, Mouse ES cell engineering workflow. Neg., negative; pos., positive. d, Representative images of fluorescence marker switching in outlined mouse ES cell clones. More than 80% of mouse ES cell clones exhibited the expected fluorescence switch; the mSwAP-In experiment was repeated at least three times with similar results. e, ACE2 copy number determination by qPCR. The ratio between ACE2 and Actb is 0.5, indicating that a single copy of ACE2 was delivered to male mouse ES cells, as expected. Copy number was normalized to Actb. Data are mean ± s.d. of three technical replicates. f, Sequencing coverage of 116 kb-ACE2 and 180 kb-ACE2 mSwAP-In clones. Reads were mapped to hg38 (top) and mm10 (bottom).
Fig. 4
Fig. 4. Characterization of ACE2 expression in mouse.
a, Production of ACE2 mice via injection of chimeric blastocyst and tetraploid blastocyst embryos. b, RT–qPCR analysis of ACE2 (top) and Ace2 (bottom) expression in nine tissues collected from four-week-old ACE2 and wild-type mice. Expression was normalized to mouse Actb. Data are mean ± s.d. of three technical replicates. SI, small intestine. c, Immunohistochemistry analysis of ACE2 in testis and lung dissected from ten-week-old ACE2 or wild-type mice. The antibody reacts with both human and mouse ACE2. Yellow and blue boxes mark magnified areas. n = 2 independent mice for each tissue; the immunohistochemistry experiment was repeated twice. d, PCR with reverse transcription (RT–PCR) detection of dACE2 isoform (transcript variant 5) in tissues from ACE2 mice. cACE2, canonical ACE2 transcript. Independent PCR assays were performed at least twice. e, Detection of ACE2 transcript 3 in tissues from ACE2 mice. f, ATAC–seq analysis of ACE2 in Ace2 wild-type, 116 kb-ACE2 and 180 kb-ACE2 small intestinal cells. A human small intestine DNase-seq track (ENCODE, DS20770) is displayed as a positive control. Shaded areas indicate ACE2 regions.
Fig. 5
Fig. 5. Characterizing the ACE2 GEMM with SARS-CoV-2 infection.
a,b, Lungs dissected from wild-type, K18-hACE2 (K18) and 116 kb-ACE2 (ACE2) mice infected with SARS-CoV-2 were analysed for nucleocapsid gene expression by RT–qPCR (a) and infectious viral levels by plaque assay (b). n = 4 independent mice for each group. SARS-CoV-2 levels were normalized to Actb and an uninfected control. F, female mice; M, male mice. c, Volcano plot of infected lungs versus uninfected lungs from 116 kb-ACE2 mice. Red, upregulated genes in infected lungs; blue, downregulated genes in infected lungs. Fold change cut-off is set to 2; adjusted P value (Wald test) cut-off is set to 0.01. d, Venn diagram of upregulated (cut-off is twofold) differentially expressed genes (DEGs) in wild-type (WT), K18-hACE2 and 116 kb-ACE2 lungs. e, RT–qPCR analysis of dACE2 in uninfected and SARS-CoV-2-infected lungs. n = 3 for uninfected lungs, n = 8 for infected lungs; 3 technical replicates were performed for each sample. Unpaired two-tailed, Mann–Whitney t-test. f, Histopathological analysis of lungs from female WT, K18-hACE2 and 116 kb-ACE2 mice by haematoxylin and eosin staining. Two lungs from independent infected mice were used; two spaced 5-μm sections from the same infected lung were stained and imaged. g,h, K18-hACE2 (n = 5) and 116 kb-ACE2 (n = 4) mice were intranasally infected with 105 PFU of SARS-CoV-2 and were monitored every other day for morbidity (g) and weight (h). Data are mean ± s.d. of biological replicates. i, Serological detection of anti-SARS-CoV-2 mouse IgG by ELISA. n = 4 independent mice for uninfected and infected groups. Box plots contain 25th to 75th percentiles of the data, the horizontal line in each box denotes the median value, and whiskers represent minima (low) and maxima (high).
Fig. 6
Fig. 6. Serial, biallelic humanization of TMPRSS2 in ACE2 mouse ES cells.
a, Schematic of TMPRSS2 humanization design. Top, Tmprss2 gene locus; grey box highlights the region replaced by human TMPRSS2. Bottom, human TMPRSS2 locus; shading highlights the humanization region. The 3′ end of MX1 was defined as the left boundary; for the right boundary, sufficient TMPRSS2 upstream genomic sequence was used to include a putative enhancer. b, Schematic workflow for TMPRSS2 biallelic humanization in ACE2 mouse ES cells. c, Success rate of biallelic humanization in three MC1 mouse ES cell founder lines determined by genotyping PCR: cWZ405 (n = 76), cWZ410 (n = 81) and cWZ412 (n = 13). d, TMPRSS2 copy number determination by qPCR. Copy number determined as in Fig. 3e. WT, wild type. e, Sequencing coverage of TMPRSS2 mouse ES cell clones. Reads mapped to hg38 (top) and mm10 (bottom). f, A double-humanized GREAT-GEMM with both ACE2 and TMPRSS2 was established via tetraploid complementation. Sex: male, two bands (X and Y); female, one band (X only). g, Top, TMPRSS2 expression pattern in double-humanized ACE2 and TMPRSS2 mouse. Bottom, mouse Tmprss2 expression pattern in ACE2-only humanized mouse. Data are mean ± s.d. of three technical replicates.
Extended Data Fig. 1
Extended Data Fig. 1. mSwAP-In design and development.
(a) Alternative marker cassettes compatible with genetic backgrounds harboring preexisting drug resistance genes. PB ITR, piggyBac inverted terminal repeat; UGT, universal gRNA target. (b) mESC kill curve for each mSwAP-In selection marker. Selected concentrations are highlighted in green: 0.8 μg/ml for puromycin, 8 μg /ml for blasticidin, 150 μg/ml for neomycin, 2.5 μM for 6-thioguanine, 250 nM for ganciclovir and 100 μg/ml for hygromycin. (c) Capture-seq analysis of Hprt deletion. Sequencing reads were mapped to mm10. (d) The bystander effect of thymidine kinase can be overcome by plating single colonies. As few as 0.1% TK-negative cells can be isolated. GCV, ganciclovir (250 nM). Scale bar is 1 mm.
Extended Data Fig. 2
Extended Data Fig. 2. Synthetic Trp53 integration via mSwAP-In.
(a) p53 mutation hotspots and the corresponding DNA codons in human and mouse, as well as the recoded codons in synTrp53. (b) SynTrp53 assembly workflow. Red asterisks represent the recoded codons. (c) Restriction enzyme digestion verification of synTrp53 assemblons. XbaI+XhoI and AseI were used for each candidate. Predicted digestion patterns were simulated using Snapgene software. L, 1 kb plus ladder (NEB). (d) Sequencing coverage of synTrp53 payload candidates. Reads were mapped to mm10 reference. Clones 1 and 3 have expected variants reflecting the recoded codons in synthetic Trp53. Clone 2 and clone 4 have additional undesired variants likely introduced by PCR. (e) Marker cassette 1 insertion into the second intron of Wrap53. 20 bp microhomology arms were added to each end of MC1 during plasmid construction. Successful insertion was verified by junction PCR. Primers are indicated as green arrows. (f) Sanger sequencing validation of heterozygous and hemizygous synTrp53 integrants. (g) Trp53 copy number qPCR analysis for the three mESC clones only carrying recoded codons. Trp53 copy number was normalized to Pgk1 gene. Bars represent mean ± SD of three technical replicates. (h) Sequencing coverage for wild-type, hemizygous and heterozygous clones. Sequencing reads were mapped to mm10. Black bar indicates a deletion called by DELLY. (i) RT-qPCR analysis of Trp53 expression level. Bars represent mean ± SD of four technical replicates for cell culture and RNA extraction, as well as three qPCR technical replicates for each reverse transcribed cDNA sample. (j) Venn diagram of upregulated gene numbers in Trp53wt/wt and Trp53syn/syn mESCs upon doxorubicin (250 nM for 20 h) treatment. Fold change cutoff is 4, adjusted p value cut off is 0.01. (k) A fold change representation of 17 genes in the p53 signaling pathway in doxorubicin treated (250 nM for 20 h) Trp53wt/wt and Trp53syn/syn mESCs.
Extended Data Fig. 3
Extended Data Fig. 3. Spontaneous mutation frequencies in wtTrp53 and synTrp53 mESCs.
(a) Experimental design. Trp53syn/syn and Trp53wt/wt clones were passaged every three days for a total of 38 passages, to accumulate spontaneous mutations. (b) Amplicon-seq design. The six recoded codons in Trp53 gene were amplified in three amplicons. Black arrows are primer annealing sequences, blue lines are unique molecular identifiers (UMIs), orange lines are Illumina indexes. (c) UMI frequencies for all sequenced base pairs in wtTrp53 and synTrp53 mESCs.
Extended Data Fig. 4
Extended Data Fig. 4. Iterative mSwAP-In and marker cassette removal.
(a) Pulse field gel electrophoresis analysis of three Trp53 downstream payloads linearized with a single-cutter. PL-RE, payload DNA digested with restriction enzyme. (b) Synthetic and wild-type specific PCR assays employing a specific forward primer and a universal reverse primer. (c) Total colony number for the 40 kb, 75 kb and 115 kb payload deliveries using mSwAP-In. mESC colonies were fixed and stained with crystal violet. (d) CRISPR-Cas9 was used in yeast to facilitate insertion of the 5’ and 3’ piggyBAC inverted terminal repeat sequences into the flanking sites of marker cassette 1 within the 75 kb payload. (e) Engineered 75 kb payload containing piggyBAC adaptors from panel (d) was integrated into synTrp53 mESCs via mSwAP-In, and validated via capture-sequencing. (f) PiggyBAC excision-only transposase was employed to excise marker cassette 1 under negative (ganciclovir) selection. Ten clones were randomly chosen and genotyped by PCR, with two of the ten clones further tested for resistance to puromycin and ganciclovir.
Extended Data Fig. 5
Extended Data Fig. 5. Genomically rewriting mouse Ace2 with human ACE2.
(a) Schematic workflow. (b) Restriction enzyme digestion verification of the 116 kb-hACE2 payload. Digestion products were separated using low-melting-point agarose gel by pulse field gel electrophoresis (see methods). (c) 180 kb-hACE2 payload assembly. Scissors mark in vitro CRISPR-Cas9 digestion sites. mHA, mouse homology arm. YAV, yeast assembly vector. (d) Sequencing coverage of two human BACs and the two hACE2 payloads mapped to hg38. Black bars represent single nucleotide polymorphisms (SNPs). (e) Marker cassette 1 insertion to the downstream of mouse Ace2. Integration was confirmed by junction PCR. HA-L, left homology arm, HA-R, right homology arm. L, left junction assay with primers oWZ1502 and oWZ920. R, right junction assay with primers oWZ211 and oWZ1503. F, full MC1 amplification with primers oWZ1502 and oWZ1503. (f) Genotyping PCR analysis of 116 kb- hACE2 and 180 kb-hACE2 mSwAP-In clones. Double headed arrows mark PCR amplicons from either mAce2 (assays 1–6) or hACE2 payloads (assays 7–16). (g) Sequencing coverage of Cas9 in 116 kb- hACE2 and 180 kb-hACE2 mESCs.
Extended Data Fig. 6
Extended Data Fig. 6. hACE2 expression, slicing and epigenetic landscape characterization.
(a) Genotyping PCR analysis of eight tissues from a tetraploid complementation-derived male. Double headed arrows are PCR amplicons from either mouse Ace2 locus or human ACE2 locus. m, mAce2 amplicons; h, hACE2 amplicons. (b) Human ACE2 and mouse Ace2 transcriptomic data from NCBI database. Lung and testis are highlighted in red with RPKM values indicated above. (c) ACE2 expression profiling in 116kb-hACE2 and 180kb-hACE2 mouse models. RT-qPCR analysis of human ACE2 in nine tissues of the two ACE2 humanized mouse models. ACE2 expression level was normalized to Actb. Bars represent mean ± SD of three technical replicates. (d-e) Two hACE2 isoforms detected in hACE2 mice. dACE2 novel junction Sanger sequencing analysis (up) and tissue distribution (down) (d). hACE2 transcript 3 junction Sanger sequencing analysis (up) and tissue (down) (e). Expression levels were normalized to Actb gene, bars represent mean ± SD of three technical replicates. (f-h) Genome browser shot of mouse testis specific Prm1, Prm2, Prm3 locus (f), mouse Ace2 locus (g) and human ACE2 locus (h) loaded with CUT&RUN sequencing reads from IgG control, H3K4me3 and H3K27ac antibodies. Two biological replicates were used for each genotype. Greg box indicates the deleted mouse Ace2 region, purple box indicates the 116 kb humanized ACE2 region, light blue box indicates the 180 kb humanized ACE2 region.
Extended Data Fig. 7
Extended Data Fig. 7. Interferon responses in SARS-CoV-2 infected lungs.
(a) Human ACE2 expression level analysis by RT-qPCR, human ACE2 expression levels were normalized Actb. Bars represent mean ± SD of three technical replicates. F, female, M, male. (b) RT-qPCR analysis of three interferon-stimulated genes, Isg15, Cxcl11, Mx1 in SARS-CoV-2 infected lungs at 3 dpi. Expression was normalized to Actb and to an uninfected control. Bars represent mean ± SD of three technical replicates. F, female, M, male. (c) Heatmaps of top 50 differentially expressed genes of wild-type, K18-hACE2 and hACE2 infected lungs comparing uninfected lungs. Color scale, z-score.
Extended Data Fig. 8
Extended Data Fig. 8. SARS-CoV-2 infection characterization.
(a) RNA-seq Sashimi plots of SARS-CoV-2 infected (3 dpi) or uninfected lungs. Numbers are read counts spanning exon-exon junction. (b) IHC staining of wild-type, K18-hACE2 and hACE2 lungs with SARS-CoV-2 nucleocapsid protein antibody (Thermo Fisher Scientific, MA1-7404). Lung sections that are adjacent to H&E staining section (Fig. 5f) were used. (c) Two male and two female 116kb-hACE2 mice were intranasally infected with 105 PFU SARS-CoV-2. Lung, kidney, small intestine and testis were harvested at 3 day-post-infection. (d) SARS-CoV-2 nucleocapsid gene was detected by RT-qPCR, and normalized to Actb, and then normalized to uninfected control. Bars represent mean ± SEM of biological replicates, n = 4 independent mice. (e) Infectious viral from lung, kidney and small intestine were quantified by plaque assay. Bars represent mean ± SEM of biological replicates, n = 4 independent mice. (f) IHC staining of mock or infected (3 dpi) testes with SARS-CoV-2 nucleocapsid protein antibody (Thermo Fisher Scientific, MA1-7404). (g) RT-PCR SARS-CoV-2 nucleocapsid gene fragment from mock or infected (3 dpi) 116kb-hACE2 testes. A 944 bp DNA fragment was amplified from 3 dpi testes and the DNA fragments were loaded in a 1% agarose. (h) Nine 116kb-hACE2 and nine 180kb-hACE2 mice were intranasally infected with 105 PFU SARS-CoV-2. Lungs were harvested at 2 dpi, 4 dpi and 6 dpi. Brains, livers, spleens and kidneys were harvested at 2 dpi. (i-j) Lungs harvested from 116kb-hACE2 and 180kb-hACE2 mice infected with SARS-CoV-2 were analyzed for SARS-CoV-2 nucleocapsid gene expression by RT-qPCR (i), and infectious viral levels by plaque assay (j). SARS-CoV-2 levels were normalized Actb and then to an uninfected control. Bars represent mean ± SEM of biological replicates, n = 2 independent mice at each time point. (k) Human ACE2 expression levels in the infected lungs, hACE2 levels were normalized to Actb. Bars represent mean ± SD of three technical replicates. (l-m) RT-qPCR detection of SARS-CoV-2 nucleocapsid gene in indicated tissues from 116kb-hACE2 (l) and 180kb-hACE2 (m) mice. SARS-CoV-2 levels were normalized Actb and then to an uninfected control. Bars represent mean ± SEM of biological replicates, n = 2 independent mice at each time point.
Extended Data Fig. 9
Extended Data Fig. 9. Comparing SARS-CoV-2 infection between hACE2 mice and golden hamster.
(a) Schematic of the longitudinal SARS-CoV-2 infection experiment for 116kb mice and wild-type golden hamsters. (b-c) RT-qPCR analysis of SARS-CoV-2 nucleocapsid gene in lung (b) and trachea (c) of 116kb mice and hamsters. hACE2 mice, n = 5 (5 dpi), 4 (14 dpi). Hamsters, n = 5 (5 dpi), 5 (14 dpi). SARS-CoV-2 RNA level was normalized Actb and to uninfected control. Bars represent mean ± SEM of biological replicates.
Extended Data Fig. 10
Extended Data Fig. 10. Generalized design scheme for mouse gene humanization using mSwAP-In.
A logic flowchart guides mSwAP-In users to design mouse gene humanization.
Extended Data Fig. 11
Extended Data Fig. 11. TMPRSS2 humanization and characterization.
(a) Biallelic marker cassette 1 insertion and copy number quantification. A reference plasmid with one copy of marker cassette 1 and one copy of mouse Actb gene serves as the standard. Two pairs of primers targeting different regions of MC1, one pair of primer targeting Actb were used for qPCR. MC1 copy number was normalized to Actb, and then normalized to the standard DNA. Bars represent mean ± SD of three technical replicates. (b) Human TMPRSS2 mSwAP-In payload assembly strategy, scissors indicate Cas9-gRNA cutting sites in vitro. (c) UCSC browser shows sequencing verification of the hTMPRSS2 payload, reads were mapped to the hg38 reference. (d) Strategy for distinguishing truly biallelic TMPRSS2 integration from hemizygous integration. P1 and P2 are two primers that bind outside of the CRISPR-Cas9 cutting sites (500 bp to 1 kb away). (e) Two human TMPRSS2 splice isoforms were detected by RT-qPCR in various mouse tissues.

References

    1. Moore JE, et al. Expanded encyclopaedias of DNA elements in the human and mouse genomes. Nature. 2020;583:699–710. doi: 10.1038/s41586-020-2493-4. - DOI - PMC - PubMed
    1. Tam V, et al. Benefits and limitations of genome-wide association studies. Nat. Rev. Genet. 2019;20:467–484. doi: 10.1038/s41576-019-0127-1. - DOI - PubMed
    1. Fredens J, et al. Total synthesis of Escherichia coli with a recoded genome. Nature. 2019;569:514–518. doi: 10.1038/s41586-019-1192-5. - DOI - PMC - PubMed
    1. Gibson DG, et al. Creation of a bacterial cell controlled by a chemically synthesized genome. Science. 2010;329:52–56. doi: 10.1126/science.1190719. - DOI - PubMed
    1. Dymond JS, et al. Synthetic chromosome arms function in yeast and generate phenotypic diversity by design. Nature. 2011;477:471–476. doi: 10.1038/nature10403. - DOI - PMC - PubMed

Publication types