. 2023 Nov;623(7986):366-374.
doi: 10.1038/s41586-023-06678-1. Epub 2023 Nov 1.

Glioma synapses recruit mechanisms of adaptive plasticity

Affiliations

Glioma synapses recruit mechanisms of adaptive plasticity

Kathryn R Taylor et al. Nature. 2023 Nov.

Abstract

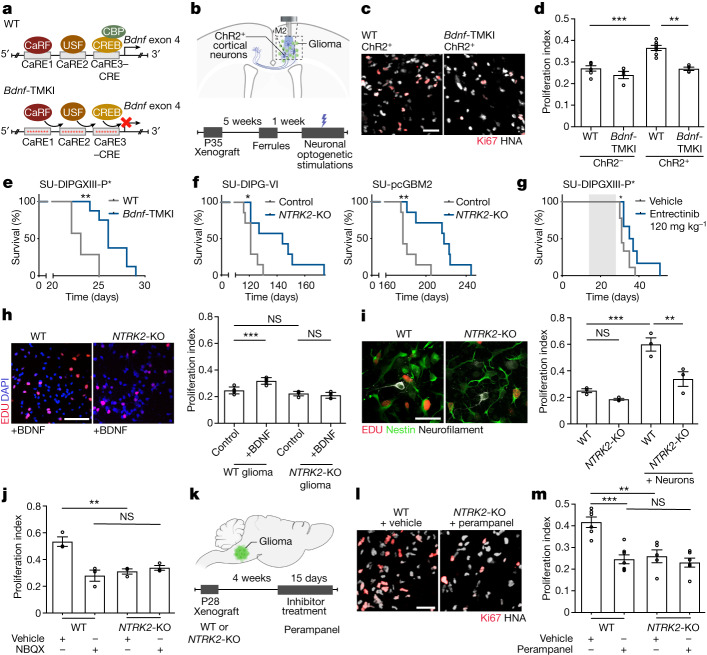
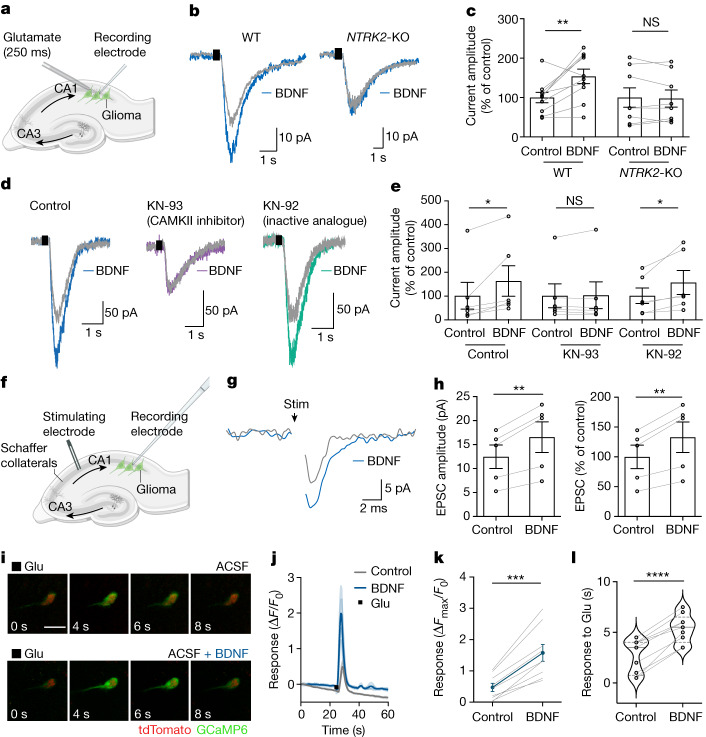
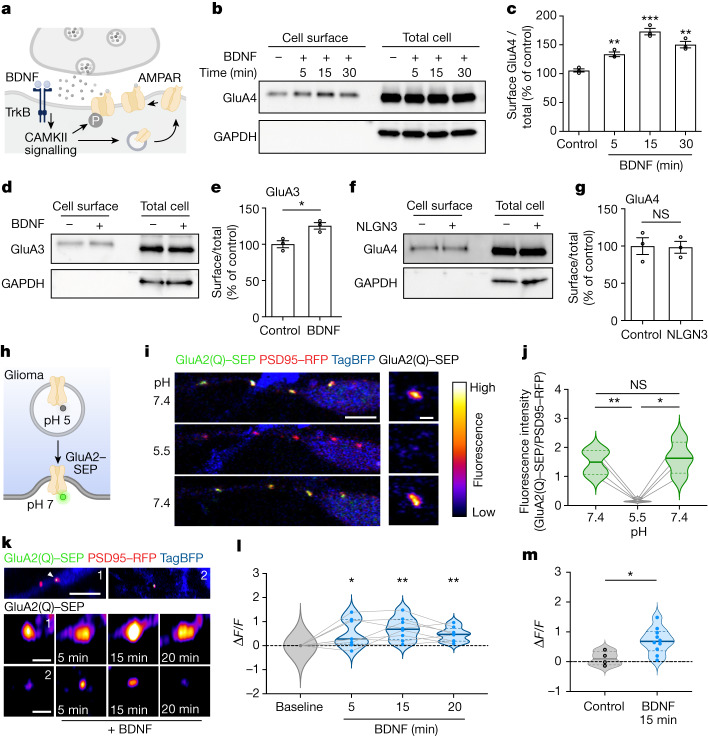
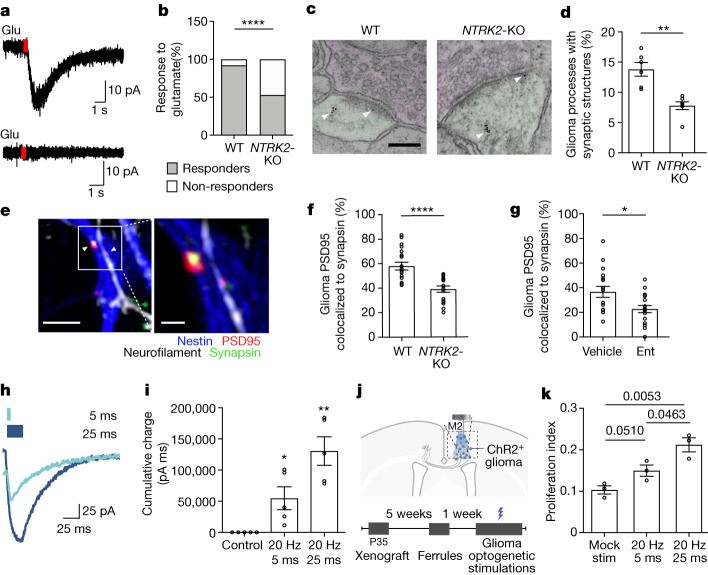
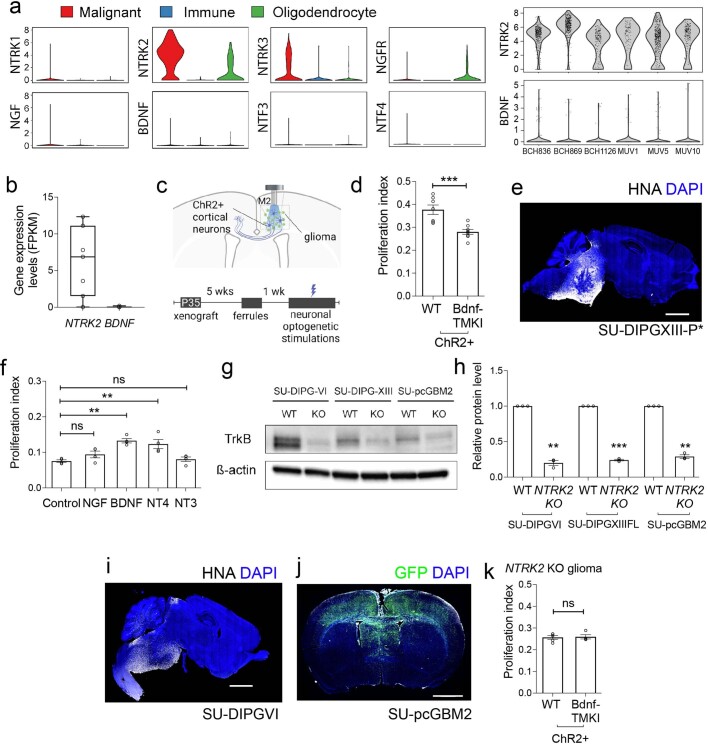
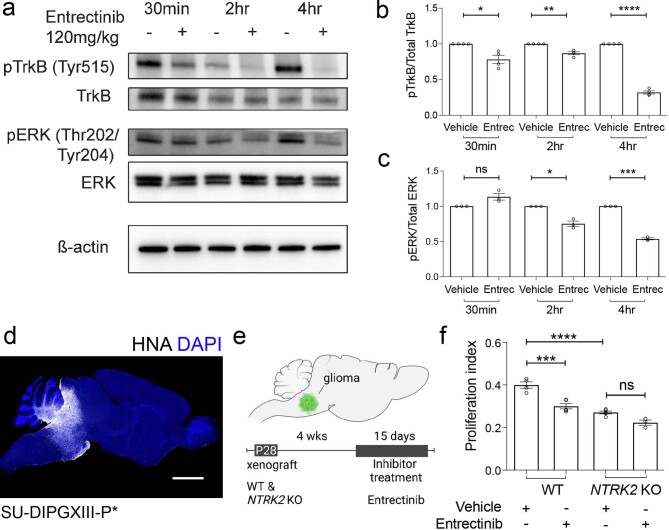
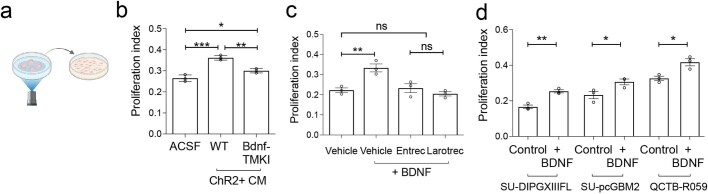
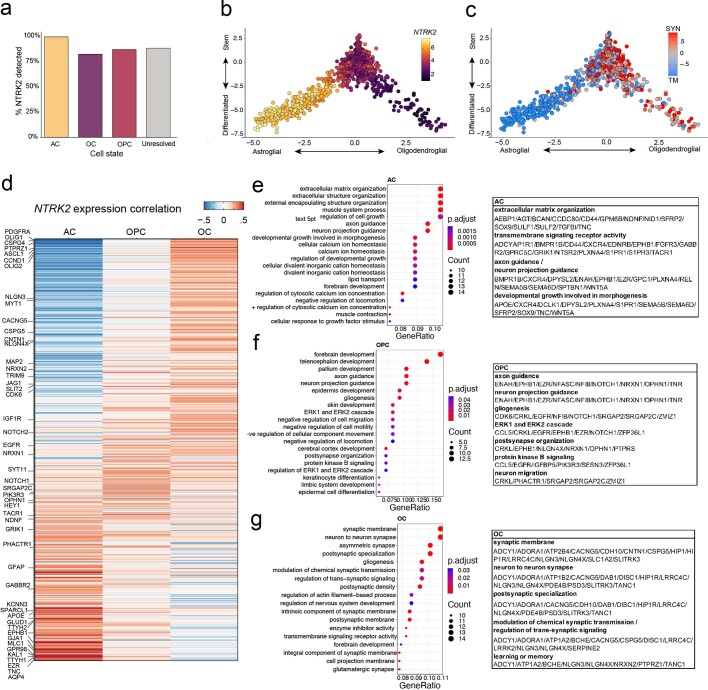
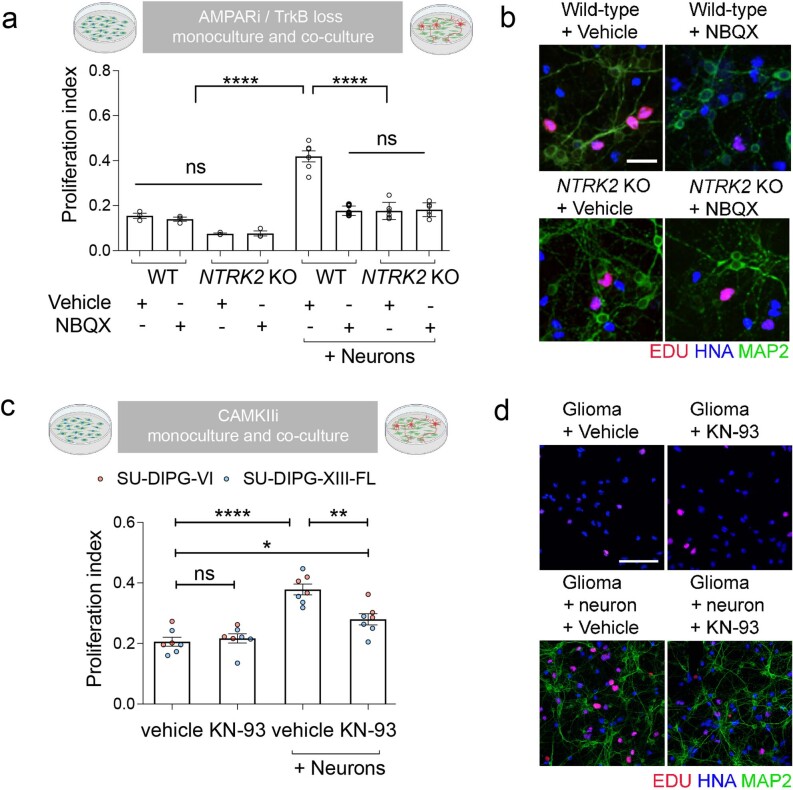
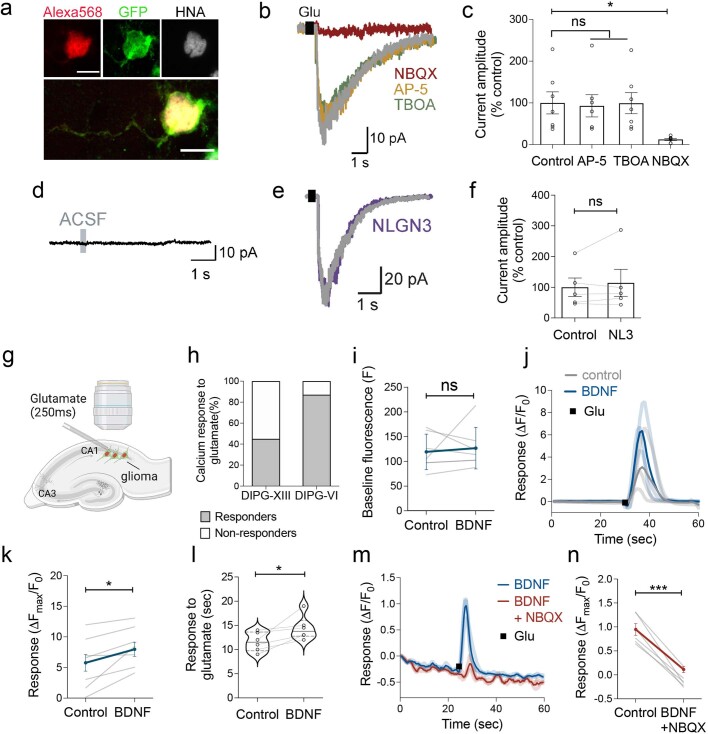
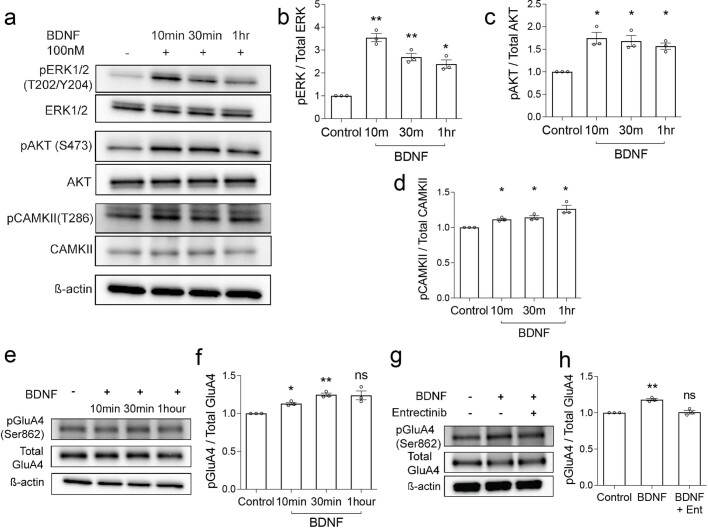
The role of the nervous system in the regulation of cancer is increasingly appreciated. In gliomas, neuronal activity drives tumour progression through paracrine signalling factors such as neuroligin-3 and brain-derived neurotrophic factor1-3 (BDNF), and also through electrophysiologically functional neuron-to-glioma synapses mediated by AMPA (α-amino-3-hydroxy-5-methyl-4-isoxazole propionic acid) receptors4,5. The consequent glioma cell membrane depolarization drives tumour proliferation4,6. In the healthy brain, activity-regulated secretion of BDNF promotes adaptive plasticity of synaptic connectivity7,8 and strength9-15. Here we show that malignant synapses exhibit similar plasticity regulated by BDNF. Signalling through the receptor tropomyosin-related kinase B16 (TrkB) to CAMKII, BDNF promotes AMPA receptor trafficking to the glioma cell membrane, resulting in increased amplitude of glutamate-evoked currents in the malignant cells. Linking plasticity of glioma synaptic strength to tumour growth, graded optogenetic control of glioma membrane potential demonstrates that greater depolarizing current amplitude promotes increased glioma proliferation. This potentiation of malignant synaptic strength shares mechanistic features with synaptic plasticity17-22 that contributes to memory and learning in the healthy brain23-26. BDNF-TrkB signalling also regulates the number of neuron-to-glioma synapses. Abrogation of activity-regulated BDNF secretion from the brain microenvironment or loss of glioma TrkB expression robustly inhibits tumour progression. Blocking TrkB genetically or pharmacologically abrogates these effects of BDNF on glioma synapses and substantially prolongs survival in xenograft models of paediatric glioblastoma and diffuse intrinsic pontine glioma. Together, these findings indicate that BDNF-TrkB signalling promotes malignant synaptic plasticity and augments tumour progression.


Conflict of interest statement

M.M. was on the scientific advisory board for Cygnal Therapeutics, is on the scientific advisory board for TippingPoint Biosciences, and holds equity in MapLight Therapeutics. M.L.S. is an equity holder, scientific co-founder and advisory board member of Immunitas Therapeutics. The other authors declare no competing interests.

Figures

Fig. 1
Fig. 1. Activity-regulated BDNF promotes glioma progression.
a, The Bdnf-TMKI model. CaRE, calcium regulatory element binding site; CRE, cAMP response element; WT, wild type. b, Optogenetic paradigm. M2, mouse premotor frontal cortex; P, postnatal day. c, Representative images of glioma (SU-DIPG-VI) xenografted into wild-type and Bdnf-TMKI cortex following blue-light stimulation of ChR2+ cortical neurons. HNA (grey) marks glioma cells, Ki67 (red) marks proliferating cells. Scale bar, 50 µm. d, Proliferation index (Ki67+ cells/HNA+ glioma cells) of xenografted SU-DIPG-VI glioma in wild-type or Bdnf-TMKI mice stimulated optogenetically (ChR2+ cortical neurons) or mock-stimulated (ChR2 neurons). n = 6 (wild-type ChR2), 4 (Bdnf-TMKI ChR2), 7 (wild-type ChR2+) and 4 (Bdnf-TMKI ChR2+) mice. e, Survival curves of wild-type and Bdnf-TMKI mice bearing SU-DIPG-XIII-P* xenografts. n = 7 (wild type) and 8 (Bdnf-TMKI mice). f, Survival curves of mice bearing wild-type and NTRK2-KO orthotopic xenografts (SU-DIPG-VI and SU-pcGBM; n = 7 mice per group). g, Survival curves of SU-DIPG-XIII-P* xenografted mice treated with entrectinib versus vehicle-treated controls. Grey shading indicates drug treatment. h, Representative images (left) and proliferation index (right; EdU+ cells/DAPI cells) of wild-type and NTRK2-KO glioma cultures (SU-DIPG-VI) with or without BDNF treatment (n = 5 coverslips per group). Scale bar, 100 µm. i, Representative images (left) and proliferation index (right; EdU+ cells/Nestin+ glioma cells) of wild-type and NTRK2-KO glioma (SU-DIPG-VI) cultured alone or with neurons (n = 3 coverslips per group). Scale bar, 50 µm. j, Proliferation index of SU-DIPG-VI wild-type and NTRK2-KO glioma co-culture with neurons (as in representative image in i), with or without NBQX (n = 3 coverslips per group; repeated in Extended Data Fig. 5a,b). km, Experimental scheme (k), Representative images (l) and quantification of proliferation rate (Ki67+ cells/HNA+ glioma cells) of wild-type and NTRK2-KO glioma xenografts (SU-DIPG-VI) treated with perampanel or vehicle control (m). n = 6 (wild type + vehicle), 7 (wild type + perampanel), 5 (NTRK2-KO + vehicle) and 6 (NTRK2-KO + perampanel) mice. Scale bar, 50 µm. Data are mean ± s.e.m. One-way ANOVA with Tukey’s post hoc analysis (d,hj,m); two-tailed log rank analysis (eg). *P < 0.05, **P < 0.01, ***P < 0.001, ****P < 0.0001; NS, not significant.
Fig. 2
Fig. 2. BDNF–TrkB signalling increases the amplitude of glutamatergic currents in glioma cells.
a, Electrophysiological model; GFP+ glioma xenografted in hippocampal CA1; local glutamate puff. b, Representative traces of glutamate-evoked (black rectangle) inward currents in xenografted SU-DIPG-VI glioma before (grey) and after (blue) 30 min of BDNF perfusion in wild-type and NTRK2-KO glioma. c, Quantification of current amplitude in b (n = 10 cells, 6 mice (wild type) and 8 cells, 6 mice (NTRK2-KO)). d, Representative traces of xenografted SU-DIPG-VI in response to glutamate puff (black rectangle) before (grey traces) and after (blue, purple, and green traces) 30 min of BDNF perfusion. Left, control trace. Middle, with 2-h incubation with the CAMKII inhibitor KN-93. Right, with 2-h incubation with KN-92, an inactive analogue of KN-93. e, Quantification of current amplitude in d (n = 6 cells per group from 5 mice (control), 3 mice (KN-93-treated) and 3 mice (KN-92-treated)). f, Electrophysiological model as in a, with Schaffer collateral afferent stimulation. g, Representative averaged voltage-clamp traces of evoked glioma excitatory postsynaptic current (EPSC) in response to axonal stimulation (black arrow) before (grey) and after (blue) BDNF application. h, Quantification of EPSC amplitude in g (n = 5 out of 43 glioma cells exhibiting EPSCs from 4 mice). i, Representative two-photon in situ imaging (8-s time series) of glioma cell calcium transients evoked by local glutamate puff before (top) and after (bottom) perfusion with BDNF (100 ng ml−1, 30 min). Green denotes glioma GCaMP6s fluorescence and red denotes tdTomato nuclear tag. Scale bar, 10 µm. j, GCaMP6s intensity traces of SU-DIPG-XIII-FL glioma cells response to glutamate puff with or without BDNF. n = 4 individual cells per group. Light grey shows traces for individual vehicle-treated cells and dark grey shows the average; light blue shows traces for individual BDNF-treated cells and dark blue shows the average. k, Responses of SU-DIPG-XIII-FL GCaMP6s cells to glutamate puff with or without BDNF (n = 9 cells, 3 mice). l, Duration of calcium transient in response to glutamate puff in SU-DIPG-XIII-FL GCaMP6s cells before and after BDNF exposure (n = 9 cells, 3 mice). Data are mean ± s.e.m. Two-tailed paired Student’s t-test (c,e,h,k,l).
Fig. 3
Fig. 3. BDNF regulates trafficking of AMPAR to the glioma postsynaptic membrane.
a, Schematic depicting AMPAR trafficking downstream of BDNF–TrkB–CAMKII signalling. b, Western blot analysis of cell surface and total cell protein levels of GluA4 in SU-DIPG-VI glioma with or without BDNF treatment for 5, 15 and 30 min. c, Quantification of cell surface GluA4 in b (n = 3 independent biological replicates). d, Western blot analysis of cell surface and total cell protein levels of GluA3 in SU-DIPG-VI glioma with or without BDNF treatment for 30 min. e, Quantification of cell surface GluA3 in d (n = 3 independent biological replicates). f, Western blot analysis of cell surface and total cell protein levels of GluA4 in SU-DIPG-VI cells treated with NLGN3 for 30 min. g, Quantification of cell surface GluA4 data in f (n = 3 independent biological replicates). h, Schematic showing GluA2–SEP experiments. i,j, Validation of pHluorin approach. i, Left, representative images of a glioma cell process expressing GluA2(Q)–SEP, PSD95–RFP and whole-cell TagBFP in co-culture with neurons. Right, representative GluA2(Q)–SEP puncta. Scale bars, 5 µm (left) and 1 µm (right). Cells were exposed to pH 7.4 followed by pH 5.5 and then pH 7.4. j, Quantification of fluorescence intensity of GluA2(Q)–SEP puncta before, during and after acidic exposure (n = 4 puncta from a representative cell). k, Top, representative images of two processes from glioma cells expressing GluA2(Q)–SEP, PSD95–RFP and TAG-BFP2 in co-culture with neurons (scale bar, 5 µm). Middle and bottom, representative images of GluA2(Q)–SEP puncta at 0, 5, 15 and 20 min of BDNF incubation (scale bar=1 µm). l, Fluorescence intensity of co-localized GluA2(Q)–SEP:PSD95–RFP puncta over time with BDNF treatment (n = 8 puncta, 6 cells). m, Fluorescence intensity of co-localized GluA2(Q)–SEP:PSD95–RFP puncta after 15 min versus basal fluorescence in control (vehicle, n = 4 puncta, 2 cells) or BDNF-treated cells (n = 8 puncta, 6 cells). Data are mean ± s.e.m. Two-tailed unpaired Student’s t-test (c,e,g,m); two-tailed paired Student’s t-test (j); two-tailed one-sample t-test (l).
Fig. 4
Fig. 4. Plasticity of neuron–glioma connectivity and functional effects of increasing synaptic strength.
a, Representative traces of glutamate-evoked (red rectangle) currents in xenografted glioma (SU-DIPG-VI). Top, glutamate responder cell. Bottom, non-responder cell. b, Quantification of glutamate responders and non-responders (n = 25 NTRK2 wild-type glioma cells from 13 mice and 15 NTRK2-KO glioma cells from 7 mice). c, Immuno-electron microscopy of GFP+ wild-type and NTRK2-KO SU-DIPG-VI cells xenografted into mouse hippocampus. Arrowheads denote immunogold labelling of GFP (glioma). Presynaptic neurons are shaded magenta and glioma cells are shaded green. Scale bar, 2 µm. d, Quantification of neuron-to-glioma synapses in c (n = 6 wild-type and 7 NTRK2-KO glioma xenografted mice). e, Representative images of neuron–glioma co-culture with PSD95–RFP-expressing NTRK2 wild-type and NTRK2-KO glioma cells. Neurofilament (axon, white), nestin (glioma, blue), synapsin (presynaptic puncta, green) and PSD95–RFP (glioma postsynaptic puncta, red) are labelled. Scale bars: 4 µm (left), 1 µm (right). f, Colocalization of postsynaptic glioma-derived PSD95–RFP with neuronal presynaptic synapsin in neuron-glioma co-cultures of NTRK2 wild-type (n = 19 cells, 12 coverslips from 3 independent experiments) or NTRK2-KO glioma (SU-DIPG-VI, n = 17 cells, 12 coverslips from 3 independent experiments). g, Colocalization of postsynaptic glioma-derived PSD95–RFP with neuronal presynaptic synapsin in neuron–glioma co-cultures (SU-DIPG-VI) treated with vehicle or entrectinib (Ent) (n = 18 cells per group, 6 coverslips per group from 3 independent experiments). h, Electrophysiological trace of ChR2+ glioma cells (SU-DIPG-XIII-FL) in response to 5-ms (light blue) or 25-ms (dark blue) light-pulse width optogenetic stimulation. i, Quantification of total accumulated charge upon 2 s of optogenetic stimulation with 5-ms or 25-ms light-pulse width as shown in h, compared with no blue light (n = 5 glioma cells per group). j, Optogenetic model for stimulation of xenografted ChR2+ glioma. k, Proliferation index (Ki67+ cells/HNA cells) of xenografted ChR2+ glioma cells (SU-DIPG-XIII-FL) after mock or blue-light stimulation at 5-ms or 25-ms light-pulse width (n = 3 mice per group). Data are mean ± s.e.m. Two-sided Fisher’s exact test (b); two-tailed unpaired Student’s t-test (d,f,g,k); two-tailed one-sample t-test (l).
Extended Data Fig. 1
Extended Data Fig. 1. TrkB is the key receptor mediating neuronal BDNF signaling in glioma.
a, Left, Primary human biopsy single cell transcriptomic data illustrating the expression of the neurotrophin family genes in H3K27M+ DMG (red; n = 2,259 cells, 6 study participants), tumor associated, non-malignant immune cells (blue; n = 96 cells, 5 participants) and oligodendrocytes (green; n = 232 cells). Right, NTRK2 and BDNF expression in H3K27M+ DMG malignant single cells primary human biopsy single-cell transcriptomic data from each of 6 study participants (case numbers denoted on x axis). For each individual violin plot, the y axis represents expression log2 (transcripts per million) and the x axis represents number of individual cells with indicated expression value. b, Expression levels of neurotrophin receptors analysed from previously published,, and newly reported (GEO# GSE222560) bulk RNA sequencing of human autopsy pediatric DMG (n = six patient-derived glioma samples SU-DIPG-IV, SU-DIPG-VI, SU-DIPG-XIII-P, SU-DIPG-XIII-FL, SU-DIPG-21 and SU-DIPG-25; means 2.36 NTRK1, 22.73 NTRK2, 8.688 NTRK3, 5.439 NGFR FPKM; NTRK2 minimum 0.03273, 25% percentile 1.537, median 6.873, 75% percentile 11.10, maximum 12.34; BDNF minimum 0.01429, 25% percentile 0.01499, median 0.03367, 75% percentile 0.04565, maximum 0.1951). c Model for optogenetic stimulation of ChR2-expressing neurons (blue) in microenvironment of glioma xenograft (green); light blue rectangle denotes region of analysis. P, postnatal day. d, Proliferation index of SU-DIPG-XIII-FL glioma xenografted to mice with neurons expressing Channelrhodopsin (ChR2 + ) in a wild-type or Bdnf-TMKI genetic background (Fig. 1a) after neuronal optogenetic stimulation (quantified by confocal microscopy of EdU + /HNA cells, as in representative Fig. 1c, n = 7 wild-type ChR2+ mice, 8 Bdnf-TMKI ChR2+ mice, P = 0.0007). e, Representative image of tumor burden in a mouse brain (sagittal section) bearing orthotopic xenograft of SU-DIPG-XIII-P* xenografted to the pons at endpoint. Survival analysis presented in Fig. 1e. White denotes HNA (tumor cells); DAPI nuclei are shown in blue (Scale bar = 2000 µm). f, Proliferation rate of SU-DIPG-XIII-FL cultures treated with recombinant proteins NGF, BDNF, NT3, NT4 (100 μM each), compared to vehicle control (quantified by confocal microscopy of EdU + /DAPI cells, as in representative Fig. 1h, n = 4 coverslips/group, Control vs BDNF P = 0.016, Control vs NT4 P = 0.0074). g, Representative western blot analysis of TrkB protein levels in wild-type, Cas9-control and NTRK2 KO cultures (SU-DIPG-VI, SU-pcGBM2, SU-DIPG-XIII-FL), using indicated antibodies. h, Quantification of g, with levels of TrkB normalized to total protein loading using ß-actin levels and compared to wild-type, Cas9-scramble control, cultures (y axis is in arbitrary units, n = 3 technical replicates, DIPGVI WT vs NTRK2 KO P = 0.0019, DIPGXIII WT vs NTRK2 KO P = 0.0002, pcGBM2 WT vs NTRK2 KO P = 0.0013). i-j, Representative images of tumors at survival endpoint for Fig. 1f. i, Orthotopic xenograft of SU-DIPG-VI into pons (sagittal section of mouse brain; scale bar = 2000 µm), and in j, cortical orthotopic xenograft of SU-pcGBM2 (coronal section of mouse brain). White denotes HNA (tumor cells); Green denotes GFP (tumor cells); DAPI nuclei are shown in blue (scale bar = 2000 µm). k, Proliferation index of NTRK2 KO SU-DIPG-VI glioma xenografted to mice with neurons expressing Channelrhodopsin (ChR2 + ) in a wild-type or Bdnf-TMKI genetic background after neuronal optogenetic stimulation (quantified by confocal microscopy of EdU + /HNA cells, as in representative Fig. 1c, n = 5 wild-type ChR2+ mice, n = 4 BDNF-TMKI ChR2+ mice). Data are mean ± s.e.m. *P < 0.05, **P < 0.01, ***P < 0.001, ns = not significant. Two-tailed unpaired Student’s t-test for d and k, one-way analysis of variance (ANOVA) with Tukey’s post hoc analysis for f and two-tailed one sample t-test for h.
Extended Data Fig. 2
Extended Data Fig. 2. Effect of the pan-Trk inhibitor entrectinib on glioma proliferation is mediated by TrkB inhibition.
a, Western blot of whole brain protein lysate collected from NSG mice that were either treated with one PO dose of 120 mg/kg of entrectinib or one dose of vehicle control (PO). The mouse brains were harvested after transcardial perfusion and mice were collected at either 30 min, 2 h and 4 h after vehicle or entrectinib dosing. The protein lysate was probed for the indicated antibodies to demonstrate inhibition of BDNF-TrkB signaling as an indication of effective drug penetration into brain tissue. b, Quantification of TrkB phosphorylation by comparing the ratio of the normalized phospho-TrkB (Tyr515) levels to corresponding total TrkB protein levels between the entrectinib treated and vehicle control mice (y axis is in arbitrary units, n = 4 technical replicates, pTrkB vehicle vs entrectinib 30 min P = 0.036, 2 h P = 0.0082, 4 h P < 0.0001). c, Quantification of MAPK pathway activation by comparing the ratio of the normalized phospho-ERK (T202/Y204) to corresponding total protein levels between the entrectinib treated and vehicle control treated mice (y axis is in arbitrary units, n = 3 technical replicates, pErk vehicle vs entrectinib 2 h P = 0.0220, 4 h P = 0.0010). d, Representative image of mouse brain (sagittal section) from SU-DIPG-XIII-P* xenografted to the pons treated with entrectinib (120 mg/kg PO) at endpoint in survival analyses (presented in Fig. 1g). White denotes HNA (tumor cells); DAPI nuclei are shown in blue (scale bar = 2000 µm). e, Experimental model of pontine xenografted WT and NTRK2 KO glioma (SU-DIPG-VI) treated with the Pan-Trk inhibitor, entrectinib, or vehicle control. f, Proliferation index of wild-type and NTRK2 KO SU-DIPG-VI glioma xenografted to the pons of NSG mice and treated with vehicle or entrectinib (120 mg/kg PO). Quantification by confocal microscopy analysis of EdU + /HNA+ co-positive tumor cells, as in representative Fig. 1c, n = 4 wild-type glioma xenografted, vehicle-treated mice, 5 wild-type glioma xenografted, entrectinib-treated mice, 5 NTRK2 KO glioma xenografted, vehicle-treated mice, 3 NTRK2 KO glioma xenografted, entrectinib-treated mice, WT vehicle vs WT entrectinib P = 0.0002, WT vehicle vs NTRK2 KO vehicle P < 0.0001). Data are mean ± s.e.m. *P < 0.05, **P < 0.01, ***P < 0.001, ****P < 0.0001, ns = not significant. Two-tailed one sample t test for b and c, one-way analysis of variance (ANOVA) with Tukey’s post hoc analysis for f.
Extended Data Fig. 3
Extended Data Fig. 3. Mitogenic effect of BDNF on glioma proliferation.
a, Collection of conditioned medium (CM) from optogenetically stimulated acute cortical slices. b, Proliferation index of SU-DIPG-VI cells exposed to wild-type or Bdnf-TMKI CM (n = 3 coverslips/group, quantified by confocal microscopy of EdU + /DAPI cells, as in representative Fig. 1h, ACSF vs WT CM P = 0.0002, ACSF vs Bdnf-TMKI CM P = 0.0334, WT CM vs Bdnf-TMKI CM P = 0.0024). c, Proliferation index of SU-DIPG-VI cells treated with 100 µM of BDNF protein in the presence of pan-Trk inhibitors, entrectinib and larotrectinib at 500 nM (quantified by confocal microscopy of EdU + /DAPI cells, as in representative Fig. 1h, n = 3 coverslips/group, P = 0.0068). d, Proliferation index of DIPG (SU-DIPG-XIII-FL), cortical (SU-pcGBM2) and thalamic (QCTB-R059) pediatric glioblastoma cultures treated with BDNF recombinant protein (100 nM) compared to control cells (vehicle-treated; quantified by confocal microscopy of EdU + /DAPI+ cells, as in representative Fig. 1h, n = 3 coverslips/group, DIPGXIII Control vs BDNF P = 0.0029, pcGBM2 Control vs BDNF P = 0.0494, R059 Control vs BDNF P = 0.0186). Data are mean ± s.e.m. *P < 0.05, **P < 0.01, ***P < 0.001, ns = not significant. One-way analysis of variance (ANOVA) with Tukey’s post hoc analysis for b and c, and two-tailed unpaired Student’s t-test for d.
Extended Data Fig. 4
Extended Data Fig. 4. NTRK2 correlates with unique cellular mechanisms in distinct cell-state subgroups of pediatric DMG.
a, Analysis of previously published H3K27M+ DMG single-cell RNASeq data quantifying the percentage of tumor cells in which NTRK2 (TrkB) was captured in either the astrocyte-like (AC), oligodendrocyte-like (OC) and oligodendroglial precursor cell-like (OPC) glioma cells. b, NTRK2 expression level in malignant H3K27M+ malignant single cells projected on the glial-like cell lineage (x axis) and stemness (stem to differentiated; y axis) scores. NTRK2 expression level was smoothened (for the purpose of data visualization only) for each cell by assigning each cell with the average NTRK2 expression of its nearest neighbors in the Lineage vs. Stemness 2-dimensional space. c, Difference between the scores of the synaptic (SYN) and tumor microtube (TM) gene signatures (i.e. SYN – TM) in H3K27M+ malignant single cells projected on the lineage (x axis) and stemness (stem to differentiated; y axis) scores. d, Heatmap of genes correlating with NTRK2 expression in distinct cellular subgroups (astrocyte-like, oligodendroglial precursor cell-like, oligodendrocyte-like) of H3K27M+ malignant single cells. Genes were ordered according to the AC-OC score difference. e-g, Gene Ontology (GO) enrichment analysis for the top genes correlated with NTRK2 expression in distinct cellular subgroups within H3K27M+ diffuse midline glioma tumors (145, 138, 97 genes with Pearson’s correlation coefficient greater than 0.25 for the AC-like, OC-like and OPC-like malignant cell states respectively) (e, astrocyte-like; f, oligodendroglial precursor cell-like; g, oligodendrocyte-like). Right, tables depicting the genes associated with the biological processes identified (GO terms) for each cellular subgroup.
Extended Data Fig. 5
Extended Data Fig. 5. Targeting AMPAR, TrkB and CAMKII reduces glioma proliferation in the context of neurons.
a, Proliferation index of SU-DIPG-VI WT and NTRK2 KO glioma monoculture (left), or glioma co-culture with neurons (right, as in Fig. 1i), in the presence and absence of the AMPAR blocker NBQX (10 μM) (quantified as fraction of EdU+/HNA+ co-positive tumor cells assessed by confocal microscopy, n = 3 coverslips/group for glioma monoculture experiments and 6 coverslips/group for neuron-glioma co-culture; experiment replicated in Fig. 1j, WT vehicle vs WT + neurons vehicle P < 0.0001, WT + neurons vehicle vs WT + neurons NBQX P < 0.0001, WT + neurons vs NTRK2 KO + neurons P < 0.0001). b, Representative images of data quantified in a; wild-type and NTRK2 KO glioma cells (SU-DIPG-VI) co-cultured with neurons in the presence and absence of NBQX (10 μM). Blue denotes HNA positive glioma cells; red denotes EdU (proliferative marker); green denotes MAP2 (neurons). Scale bar = 30 µm. c, Proliferation index of SU-DIPG-VI (red data points) and SU-DIPG-XIII-FL (blue data points) as a monoculture or cocultured with neurons in the presence of a CAMKII inhibitor, KN-93 (10 μM) or vehicle control (quantified as fraction of EdU+/HNA+ glioma cells; n = 7 coverslips/group, vehicle vs vehicle + neurons P < 0.0001, vehicle + neurons vs KN-93 + neurons P = 0.0017, vehicle vs KN93 + neurons P = 0.0212). d, Representative images of data quantified in c; glioma cells (SU-DIPG-VI) in monoculture, or co-cultured with neurons, in the presence and absence of KN-93 (10 μM). Blue denotes HNA positive glioma cells; red denotes EdU (proliferative marker); green denotes MAP2 (neurons). Scale bar = 100 µm. Data are mean ± s.e.m., *P < 0.05, **P < 0.01, ****P < 0.0001, ns = not significant, one-way analysis of variance (ANOVA) with Tukey’s post hoc analysis.
Extended Data Fig. 6
Extended Data Fig. 6. Heterogeneity and specificity of glioma electrophysiological response to glutamate.
a, Representative image of Alexa 568 (red)- filled GFP+ glioma cell following whole-cell patch clamp recording. Co-labelled with GFP (green) and human nuclear antigen (HNA, grey). Scale bars = 10 µm. b, Representative voltage-clamp traces of whole cell patch-clamp electrophysiological recordings in glioma cells. Hippocampal slices were perfused with ACSF containing tetrodotoxin (TTX, 0.5 µM), and response to a local puff (250 msec) application of 1 mM glutamate (black square) was recorded from xenografted glioma cells with sequential application of NMDAR blocker (AP-5, 100 µM), TBOA (200 µM), AMPAR blocker (NBQX, 10 µM). c, Quantification of data in b (n = 7 glioma cells, 4 mice, P = 0.0165). d, Whole cell patch-clamp electrophysiological recording of glioma cell with ACSF puff, representative voltage clamp trace. e, Representative traces of glutamate-evoked inward currents (black square) in patient-derived glioma xenografted cells before (grey) and after 30-minute perfusion with NLGN3 recombinant protein (100 ng/ml) in ACSF (containing TTX, 0.5 µM) (purple). f, Quantification of data in e (n = 5 glioma cells, 3 mice). g, Model of calcium imaging of tdTomato nuclear tagged (red nuclei), GCaMP6s-expressing (green calcium transients) glioma cells xenografted into the mouse hippocampal region. h, Quantification of number of xenografted SU-DIPG-XIII-FL or SU-DIPG-VI cells glioma cells demonstrating a calcium transient (as depicted in Fig. 2i, j and Extended Data Fig. 6j) in response to a glutamate puff (responders, grey, non-responders, white). i, Baseline GCaMP6s intensity in SU-DIPG-VI glioma cells before and 30-min after BDNF exposure, in the absence of glutamate puff (n = 7 cells, 3 mice). j, GCaMP6s intensity trace of SU-DIPG-VI glioma cells response to glutamate puff before (3 cells, 3 mice: light grey, average: dark grey) and after BDNF perfusion (three cells: light blue, average intensity: dark blue). k, SU-DIPG-VI GCaMP6s cell response to glutamate puff at baseline and after BDNF perfusion (100 ng/ml, 30 min, n = 7 cells, 4 mice, P = 0.0174). l, Duration of calcium transient response to glutamate puff in SU-DIPG-VI hippocampal xenografted cells, before and after perfusion with BDNF (100 ng/ml, 30 min, n = 6 cells, 4 mice, P = 0.0302). m, Representative traces of SU-DIPG-XIII glioma GCaMP6s intensity in the presence of BDNF (100 ng/ml, 30 min). Response to glutamate application (black) recorded with BDNF perfusion (3 cells, 2 mice: light blue, average: dark blue) or with BDNF and NBQX (10 µM, 3 cells: light red, average: red). n, Response of GCaMP6s cells to glutamate puff with BDNF application, in the presence and absence of NBQX (n = 6 cells, 3 mice, P = 0.0002). Data are mean ± s.e.m., *P < 0.05, ***P < 0.001, ns = not significant, two-tailed paired Student’s t-test for k, l, n, and two-tailed Wilcoxon signed pairs matched rank test for d, f and i.
Extended Data Fig. 7
Extended Data Fig. 7. TrkB isoform expression in DIPG.
a, Heatmap of single-cell RNASeq data of patient derived glioma xenograft models (SU-DIPG-VI and SU-DIPG-XIII) cells (n = 321 cells, 4 mice) demonstrating relative expression of TrkB (NTRK2) isoforms; Full (ENST-277120.7 and ENST-323115.9) and Truncated (527aa ENST-376208.5 and ENST-376208.5; 477aa ENST-359847 and ENST-395882.5), with representative Ensembl codes depicted below. b, Violin plots of relative expression level of TrkB isoforms (depicted in a,) for both SU-DIPG-VI and SU-DIPG-XIII cells combined, shown as log-transformed counts per million (CPM). c, Violin plots of relative expression of TrkB isoforms (depicted in a,) separated by patient-derived xenograft model type (SU-DIPG-VI (D6) and SU-DIPG-XIII (D13)). Y-axis is in log-transformed counts per million (CPM).
Extended Data Fig. 8
Extended Data Fig. 8. BDNF exposure induces PI3K, MAPK and CAMKII activation and AMPAR phosphorylation in pediatric glioma.
a, Western blot of proteins from SU-DIPG-VI cells treated with BDNF recombinant protein (100 nM) over a time course and probed for the indicated antibodies to demonstrate activation of downstream signaling pathways in comparison to untreated cells (vehicle only). b, Quantification of MAPK pathway activation in a, as the ratio of the normalized phospho-ERK (T202/Y204) levels to corresponding total protein levels for BDNF treated (100 nM) cultures compared to control (y-axis is in arbitrary units, n = 3 independent biological replicates, pERK Control vs 10 m P = 0.0048, Control vs 30 m P = 0.0094, Control vs 1 h P = 0.0167). c, Quantification of PI3K pathway activation in a, by comparing the ratio of the normalized phospho-AKT (S473) to corresponding total protein levels for BDNF treated (100 nM) cultures compared to control (y-axis is in arbitrary units, n = 3 independent biological replicates, pAKT Control vs 10 m P = 0.0293, Control vs 30 m P = 0.0307, Control vs 1 h P = 0.0148). d, Quantification of calcium pathway activation in a, by comparing the ratio of the normalized phospho-CAMKII (T286) to corresponding total protein levels for BDNF treated (100 nM) compared to control (y axis is in arbitrary units, n = 3 independent biological replicates, pCAMKII Control vs 10 m P = 0.0197, Control vs 30 m P = 0.0310, Control vs 1 h P = 0.0374). e, Representative Western blot analysis of primary patient-derived glioma culture, SU-DIPG-VI, treated with 100 nM BDNF at several timepoints using indicated antibodies. f, Quantification of the phospho-immunoblots ratio to corresponding total protein levels and normalized to vehicle treated control (y axis is in arbitrary units, n = 3 independent biological replicates, pGluA4 Control vs 10 m P = 0.0174, Control vs 30 m P = 0.0072), 8 h (pGluA4 Control vs BDNF P = 0.078). g, Representative Western blot analysis of 100 nM BDNF treated glioma cells (as in e,) at 30 min with and without entrectinib treatment (Ent, 5 µM). h, quantification of phospho-immunoblots (y axis is in arbitrary units, n = 3 independent biological replicates). Data are mean ± s.e.m. *P < 0.05, **P < 0.01, ns = not significant. Two-tailed one Sample t test for b, c, d, f, h.
Extended Data Fig. 9
Extended Data Fig. 9. Gene expression changes induced in pediatric glioma upon BDNF exposure.
a, Volcano plot demonstrating gene expression changes in SU-DIPG-VI after 16 h of treatment in vitro with and without BDNF recombinant protein (100 nM). The x axis demonstrates the log2 fold change in gene expression (of BDNF-treated compared to vehicle-treated SU-DIPG-VI samples) and the y axis demonstrates Log10P significance (log10-transformed two-tailed p value significance, as calculated by the Wald test) of the gene expression change following analysis with DESeq2 in R.
Extended Data Fig. 10
Extended Data Fig. 10. NTRK2 knockdown reduces colocalisation of neuron-to-glioma synaptic puncta, and optogenetic modeling of glioma membrane depolarization.
a, Electron microscopy images of glioma xenografted mouse hippocampal tissue sections with immuno-gold particle labeling of GFP. Left, secondary only stains to show background levels of non-specific gold particle labeling (black arrows). Right, examples of glioma processes and additional examples of neuron-to-glioma synapses positive for >4 immuno-gold particles (white arrows) in patient-derived SU-DIPG-VI cells xenografted to the hippocampus. Scale bar = 500 nm (left), all other scale bars = 200 nm. b, Representative western blot analysis of TrkB protein levels in control scramble shRNA and NTRK2 shRNA knockdown (KD) cultures (SU-DIPG-VI), using indicated antibodies. c, Quantification of western blot analysis with levels of TrkB normalized to total protein loading using ß-actin levels and compared to wild-type, Cas9-scramble control, cultures (y axis is in arbitrary units, n = 3 technical replicates, P < 0.0001). d, Quantification of the colocalization of postsynaptic glioma-derived PSD95-RFP with neuronal presynaptic synapsin in co-cultures of wild-type (n = 6 cells, 3 coverslips, P = 0.0050), or NTRK2 KD glioma cells (SU-DIPG-VI, n = 6 cells, 3 coverslips); replicates experiment in Fig. 4f, g using shRNA knockdown. e, The cation channel, Channelrhodopsin-2, is gated by blue light, inducing membrane depolarization of the cell. f, Electrophysiological traces of patch-clamped glioma cells stimulated with 470 nm light at 20 Hz, 1.0 mW/mm2 for 2 s (blue lines) at either 5 ms (light blue) or 25 ms (dark blue) light-pulse width. Note the difference in current amplitude elicited by 5 ms vs 25 ms light-pulse widths. g, Representative images of xenografted ChR2+ glioma cells quantified in 4k after mock stimulation, or optogenetic stimulation at 5 ms and 25 ms light-pulse width, gray denotes HNA-positive glioma cells; red denotes Ki67. Scale bar = 50 µm. Data are mean ± s.e.m. **P < 0.01. Two-tailed one sample t-test for c and two-tailed unpaired Student’s t-test for d.

Comment in

References

    1. Venkatesh HS, et al. Neuronal activity promotes glioma growth through neuroligin-3 secretion. Cell. 2015;161:803–816. doi: 10.1016/j.cell.2015.04.012. - DOI - PMC - PubMed
    1. Venkatesh HS, et al. Targeting neuronal activity-regulated neuroligin-3 dependency in high-grade glioma. Nature. 2017;549:533–537. doi: 10.1038/nature24014. - DOI - PMC - PubMed
    1. Pan Y, et al. NF1 mutation drives neuronal activity-dependent initiation of optic glioma. Nature. 2021;594:277–282. doi: 10.1038/s41586-021-03580-6. - DOI - PMC - PubMed
    1. Venkatesh HS, et al. Electrical and synaptic integration of glioma into neural circuits. Nature. 2019;573:539–545. doi: 10.1038/s41586-019-1563-y. - DOI - PMC - PubMed
    1. Venkataramani V, et al. Glutamatergic synaptic input to glioma cells drives brain tumour progression. Nature. 2019;573:532–538. doi: 10.1038/s41586-019-1564-x. - DOI - PubMed

Publication types

MeSH terms

Substances