. 2023 Nov;623(7986):387-396.
doi: 10.1038/s41586-023-06680-7. Epub 2023 Nov 1.

Vagal sensory neurons mediate the Bezold-Jarisch reflex and induce syncope

Affiliations

Vagal sensory neurons mediate the Bezold-Jarisch reflex and induce syncope

Jonathan W Lovelace et al. Nature. 2023 Nov.

Abstract

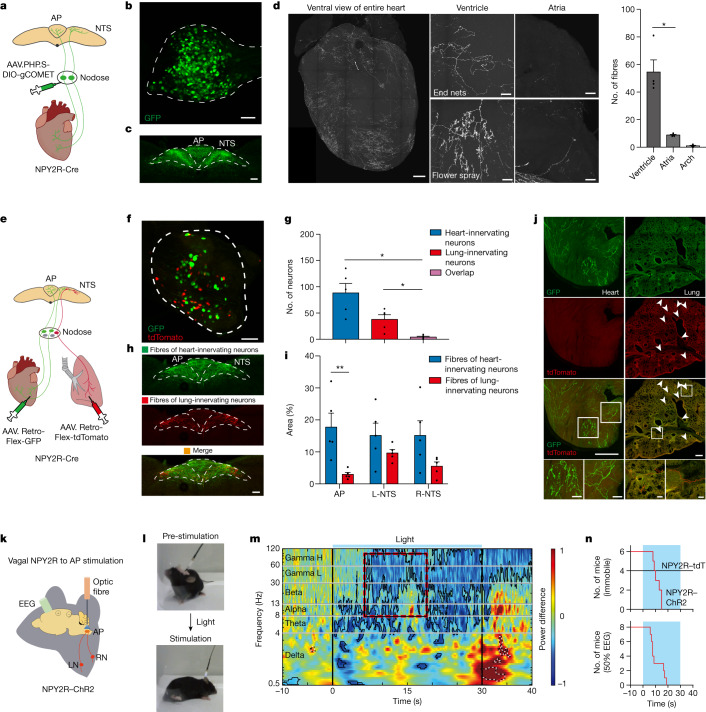
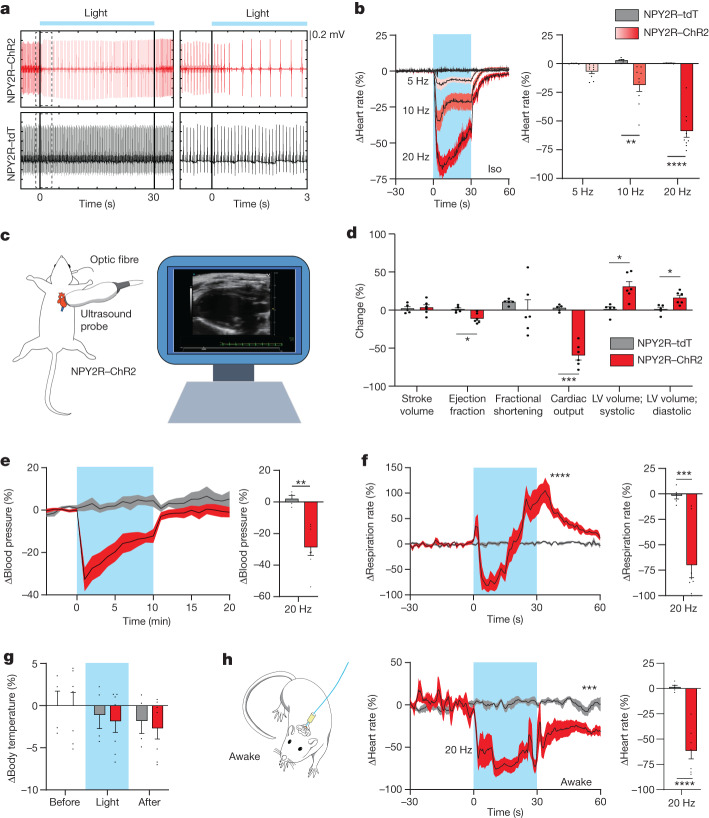
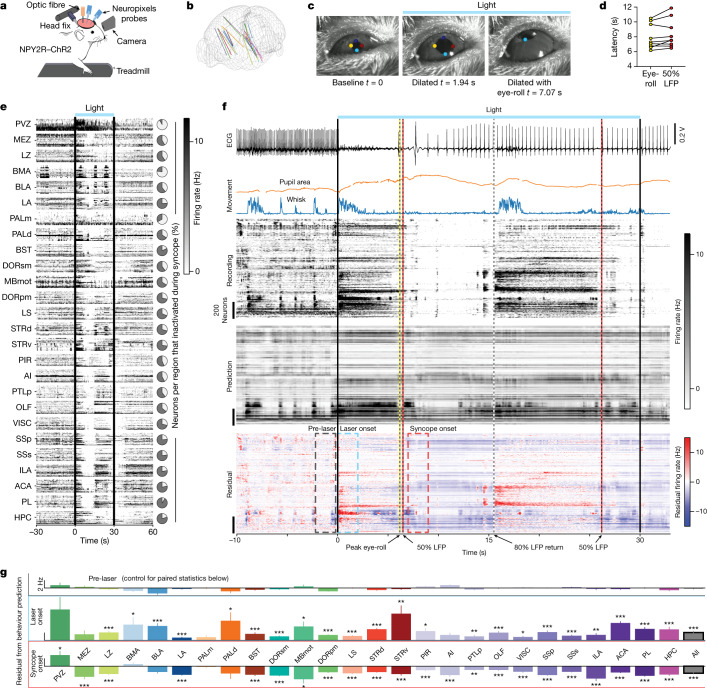
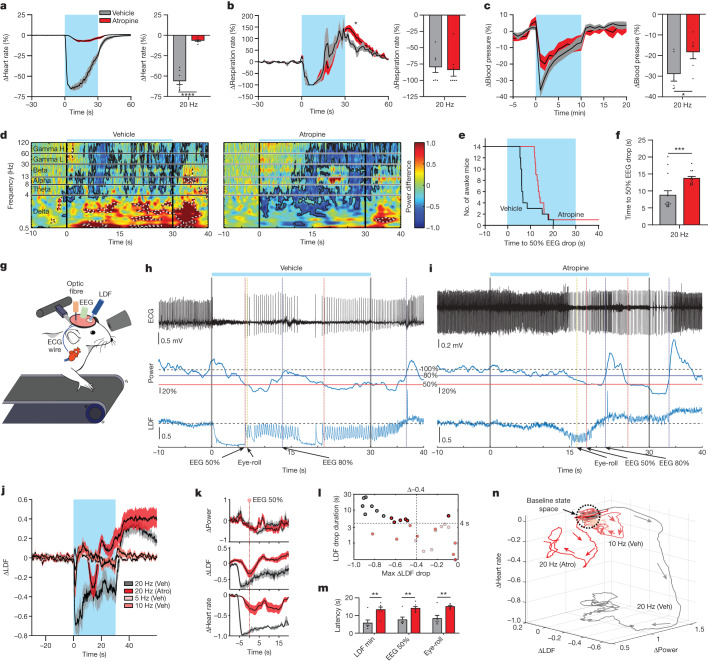
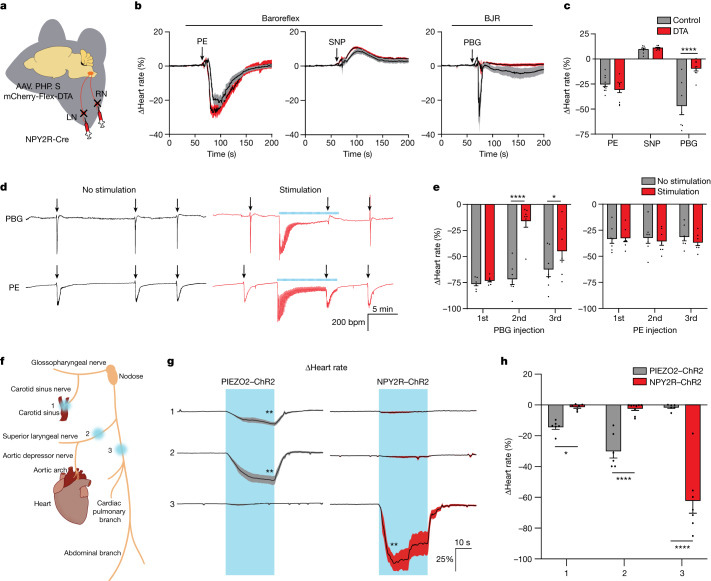
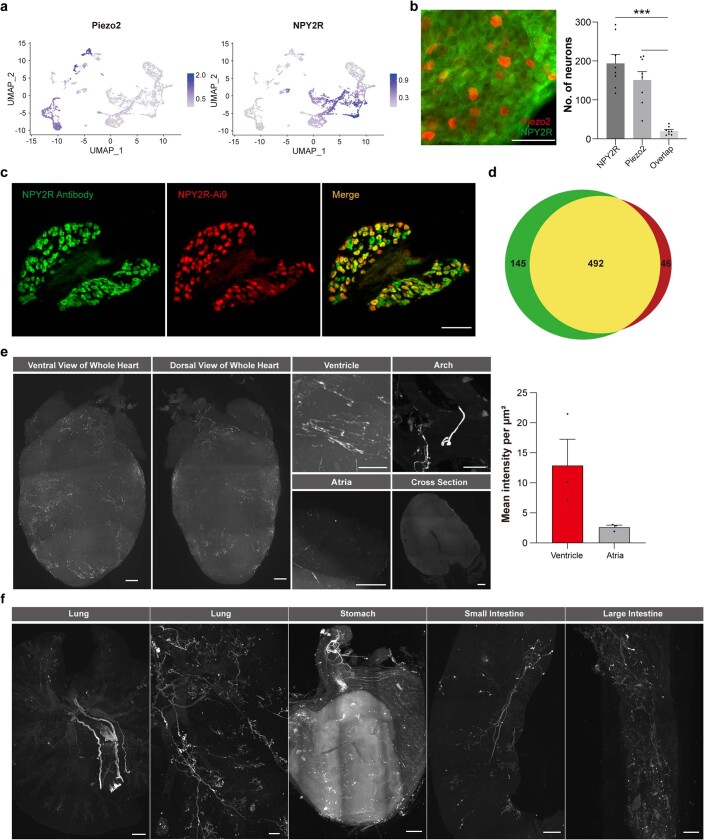
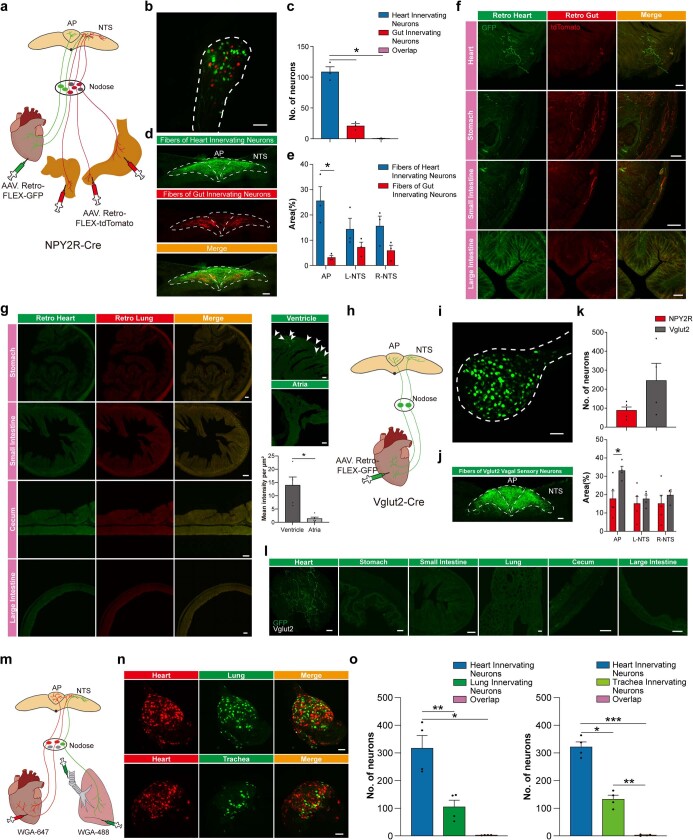
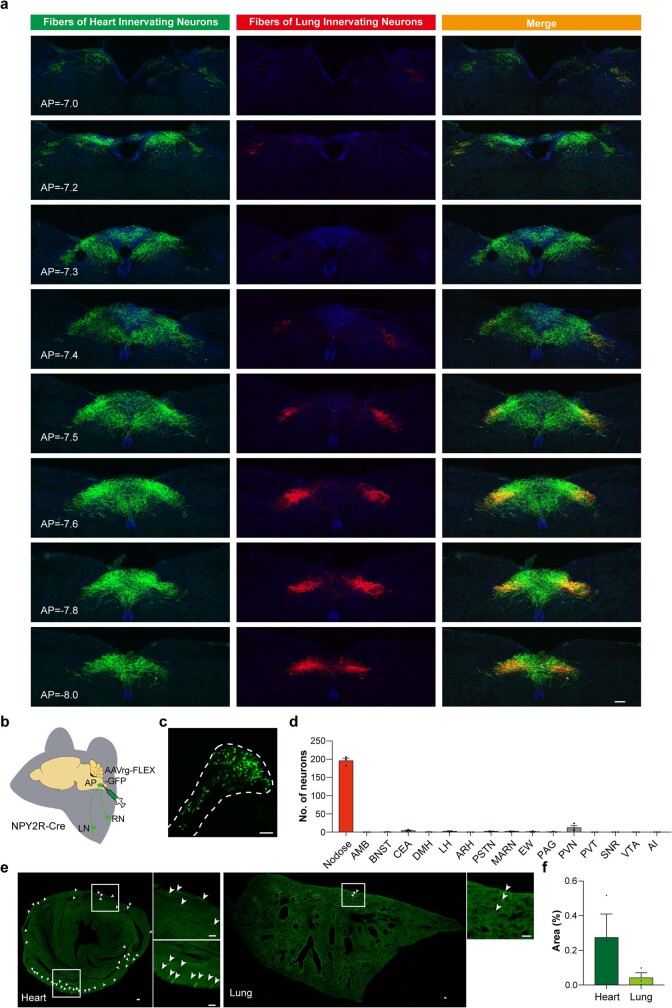
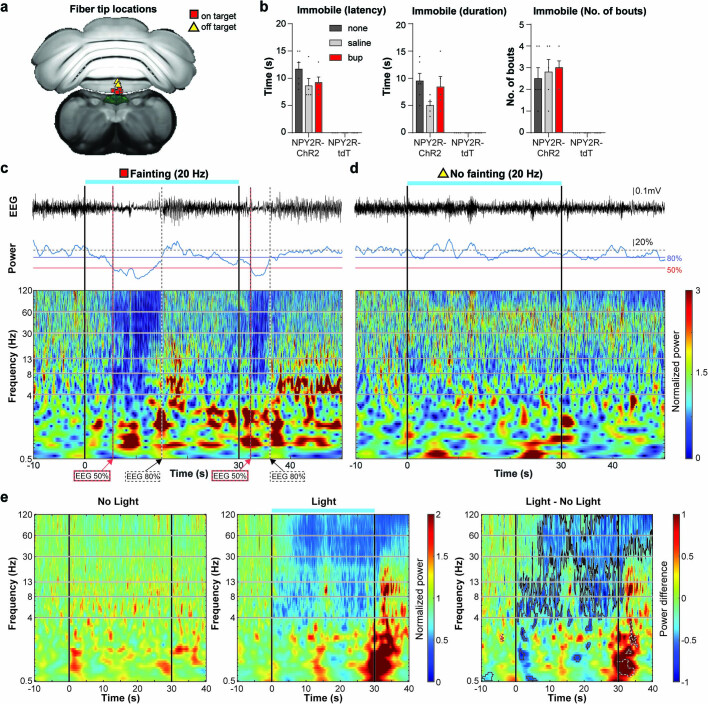
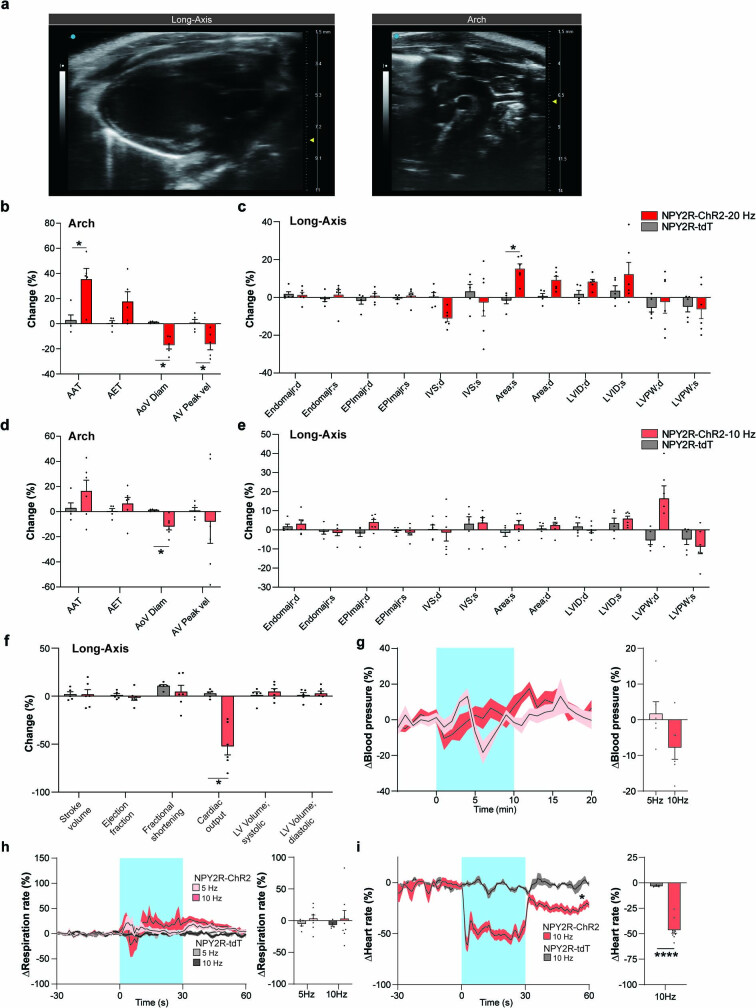
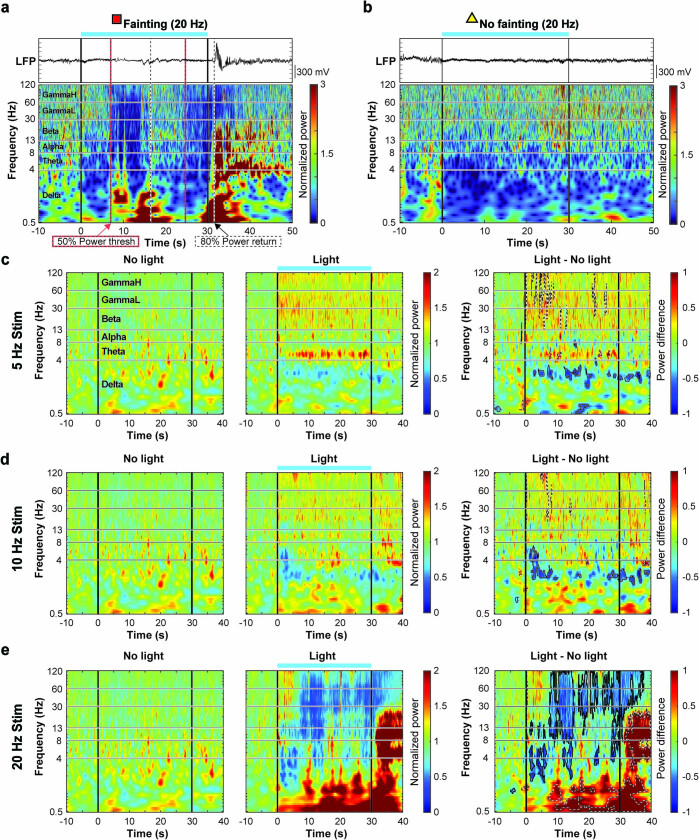
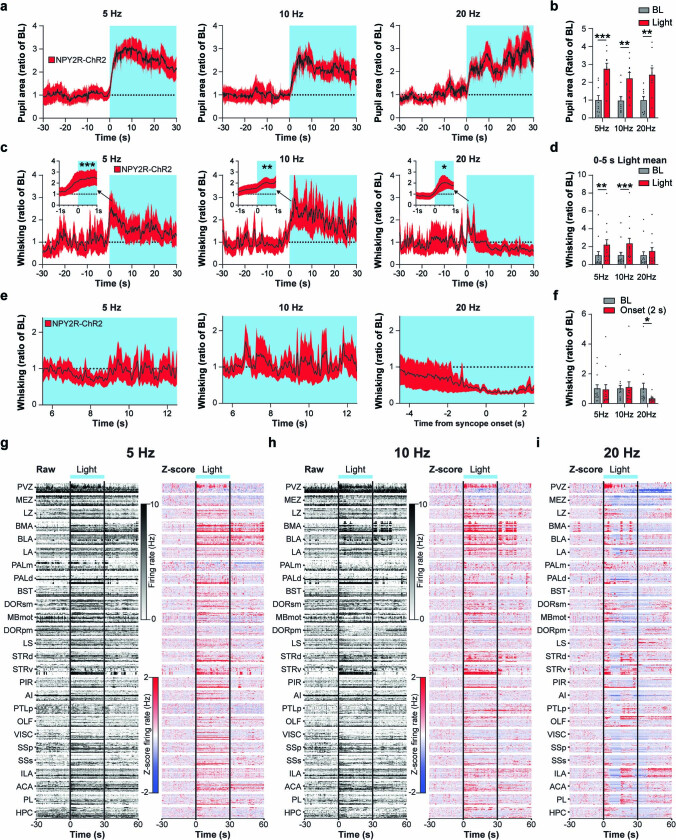
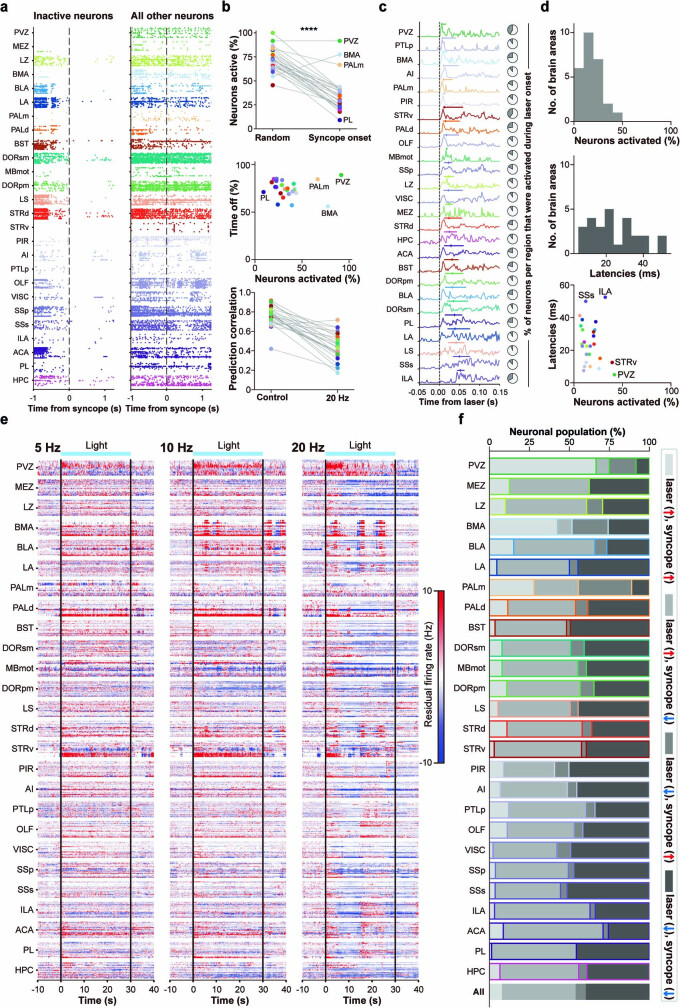
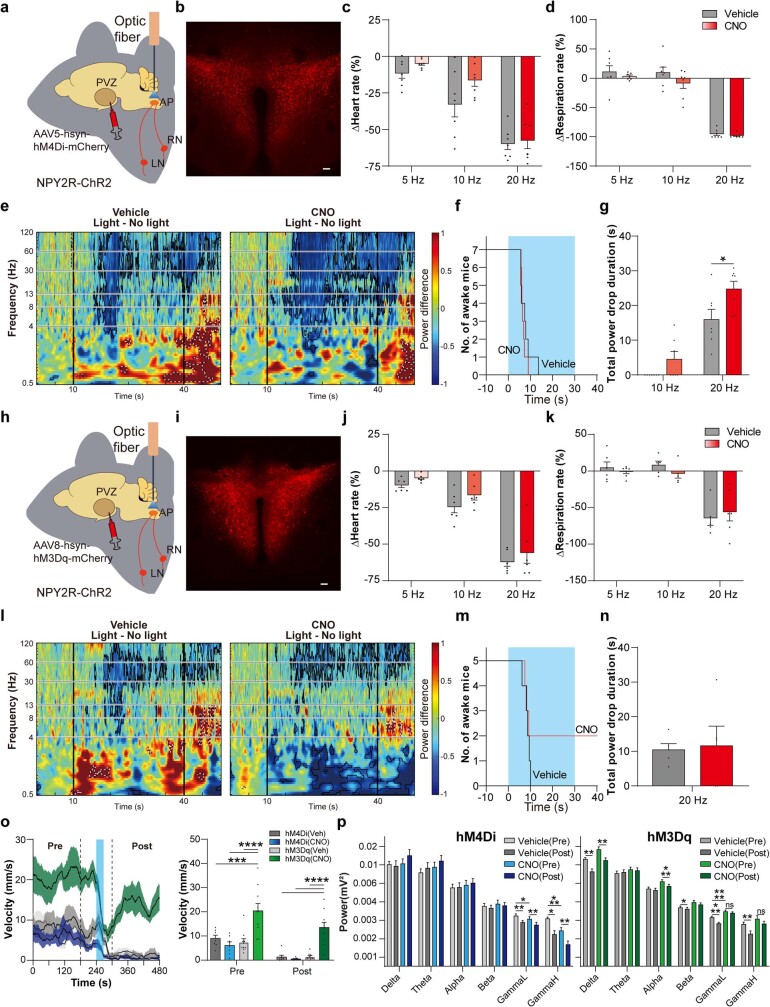
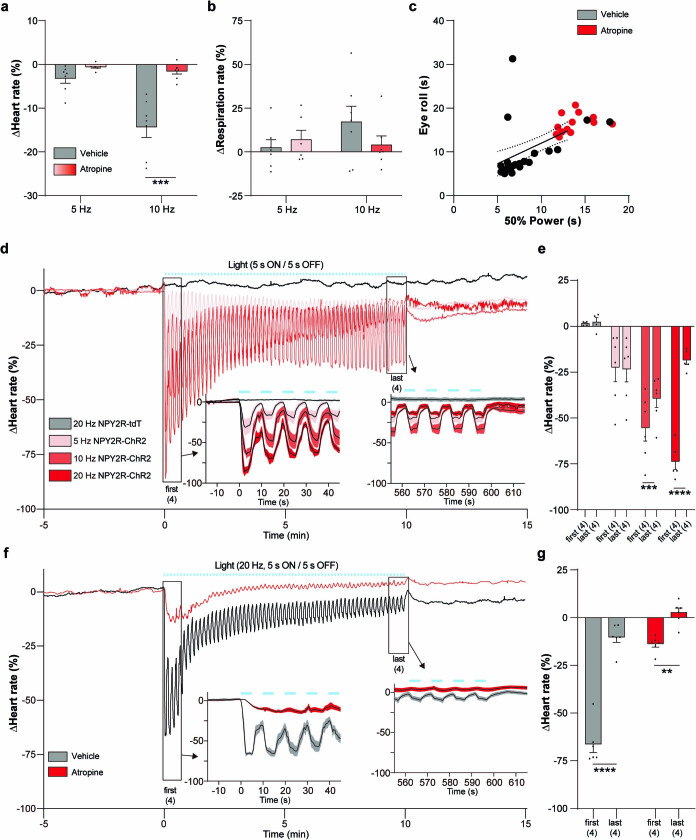
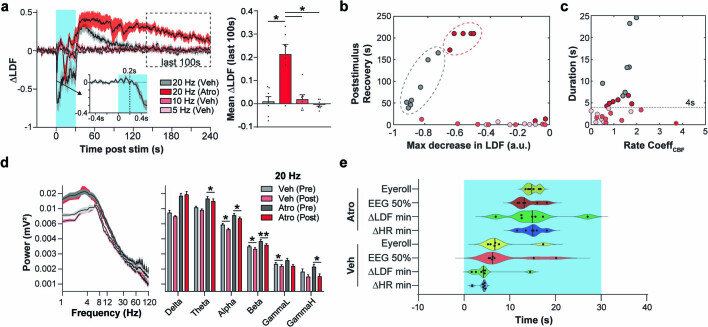
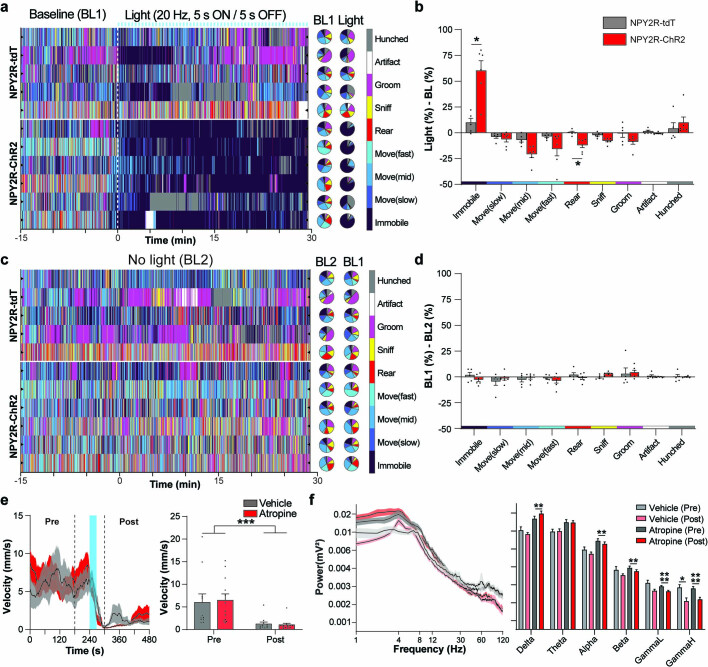
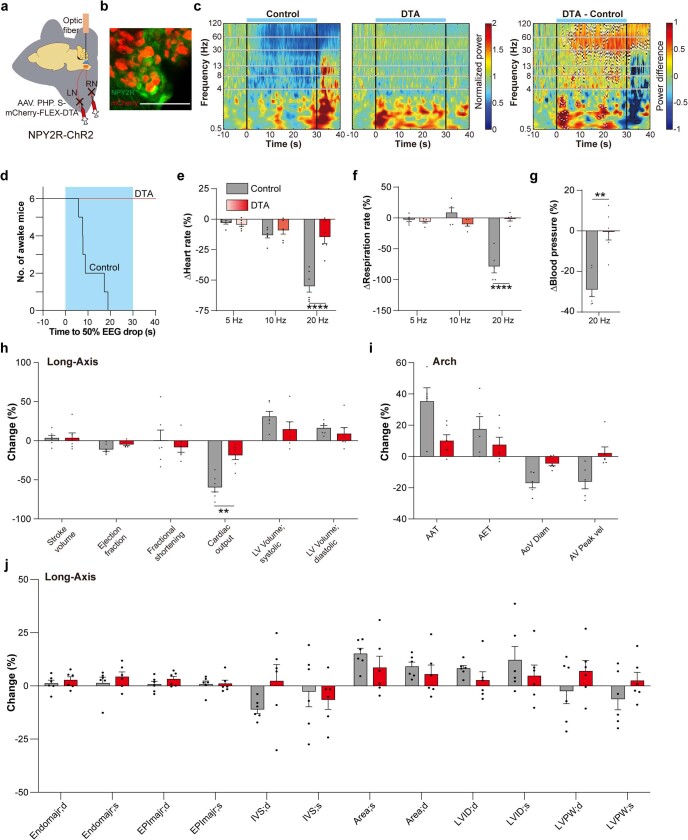
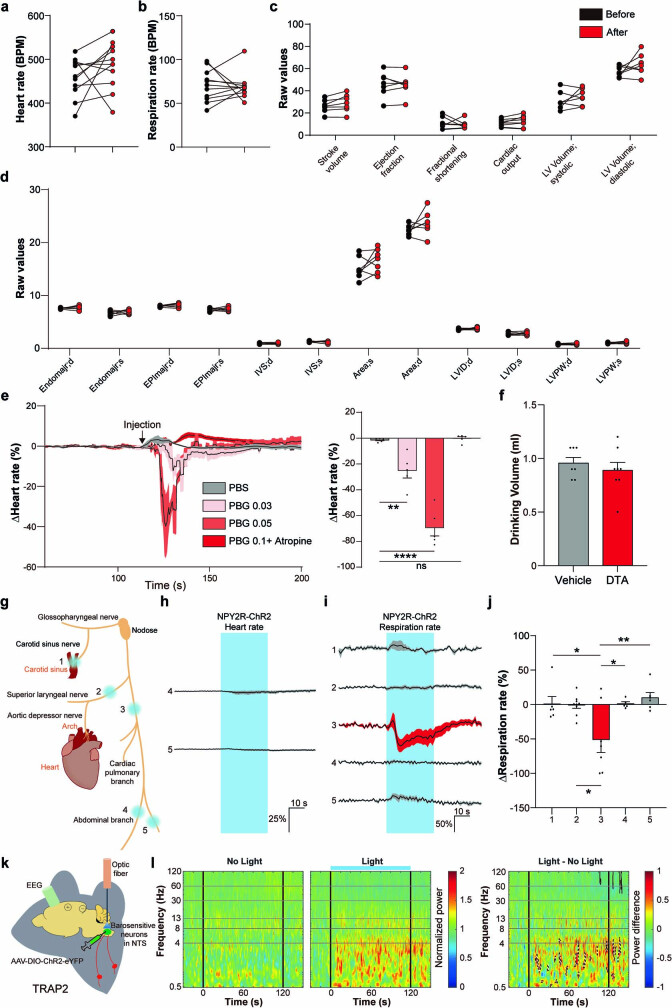
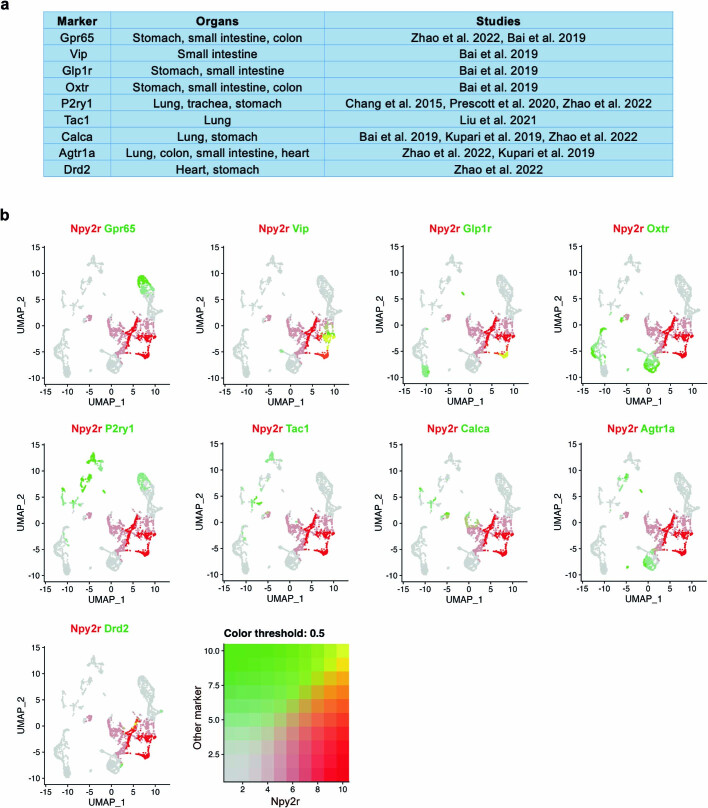
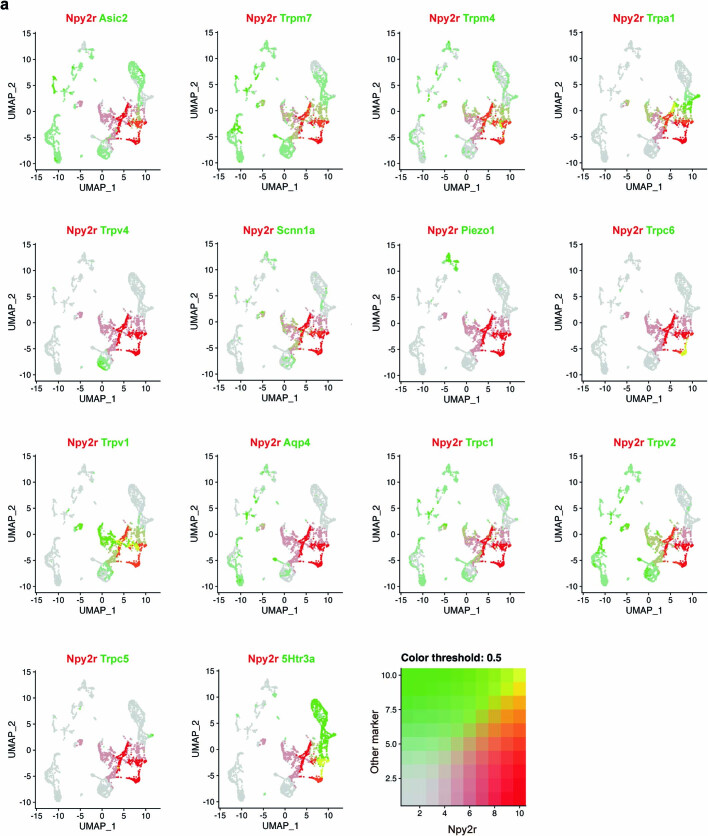
Visceral sensory pathways mediate homeostatic reflexes, the dysfunction of which leads to many neurological disorders1. The Bezold-Jarisch reflex (BJR), first described2,3 in 1867, is a cardioinhibitory reflex that is speculated to be mediated by vagal sensory neurons (VSNs) that also triggers syncope. However, the molecular identity, anatomical organization, physiological characteristics and behavioural influence of cardiac VSNs remain mostly unknown. Here we leveraged single-cell RNA-sequencing data and HYBRiD tissue clearing4 to show that VSNs that express neuropeptide Y receptor Y2 (NPY2R) predominately connect the heart ventricular wall to the area postrema. Optogenetic activation of NPY2R VSNs elicits the classic triad of BJR responses-hypotension, bradycardia and suppressed respiration-and causes an animal to faint. Photostimulation during high-resolution echocardiography and laser Doppler flowmetry with behavioural observation revealed a range of phenotypes reflected in clinical syncope, including reduced cardiac output, cerebral hypoperfusion, pupil dilation and eye-roll. Large-scale Neuropixels brain recordings and machine-learning-based modelling showed that this manipulation causes the suppression of activity across a large distributed neuronal population that is not explained by changes in spontaneous behavioural movements. Additionally, bidirectional manipulation of the periventricular zone had a push-pull effect, with inhibition leading to longer syncope periods and activation inducing arousal. Finally, ablating NPY2R VSNs specifically abolished the BJR. Combined, these results demonstrate a genetically defined cardiac reflex that recapitulates characteristics of human syncope at physiological, behavioural and neural network levels.


Conflict of interest statement

The authors declare no competing interests.

Figures

Fig. 1
Fig. 1. Brainstem stimulation of NPY2R VSNs induces syncope.
a, Schematic of anterograde tracing of NPY2R VSNs. b, gCOMET-labelled neurons in a nodose ganglion of a NPY2R-Cre mouse (n = 4). c, Fibre distribution of NPY2R VSNs (green) in the AP and NTS (n = 4). d, Left, HYBRiD-cleared heart showing NPY2R VSN terminals in the heart ventricles and atria. Right, quantification of fibre distribution (n = 4, P = 0.0108). e, Schematic of retrograde tracing of NPY2R VSNs from heart and lung. f, Retrogradely labelled VSNs from the heart (green) and lung (red, n = 5). g, Quantification of overlap (n = 5, heart/overlap P = 0.0198; lung/overlap P = 0.0254). h,i, Spatial projection pattern of heart-innervating (green) and lung-innervating (red) NPY2R VSNs (h) and quantifications (i, n = 5, P = 0.0079). R, right; L, left. j, NPY2R VSN terminals in retro-labelled heart and lung. Arrowheads indicate lung terminals. (n = 5). k, Schematic of optogenetic stimulation of NPY2R VSN terminals in the AP with EEG preparation. l, Photostimulation (20 Hz) of freely moving mice causes them to fall over and become immobile. m, Power is plotted using wavelets on EEG recordings and normalized to baseline. Mean power during light-off trials was subtracted from light-on trials. Areas of significant drops in power (blue with black border) or increases (red with dashed black/white border) are indicated. Strong decreases (50%) in power were observed (red box, width indicates range of latencies), which indicated syncope (n = 12 sessions from 8 mice). H, high; L, low. n, Top, step plot showing latency to first bout of immobility in NPY2R–ChR2 mice (n = 6) and control NPY2R–tdTomato (tdT) mice (n = 4). Bottom, step plot showing latency to 50% power drop (n = 8). *P < 0.05, **P < 0.01 by two-way repeated measures analysis of variance (ANOVA) with Šidák multiple comparisons or repeated measures ANOVA Geisser–Greenhouse correction with Tukey multiple comparisons. All error bars show mean ± s.e.m. Scale bars, 100 μm (b,c,d (ventricle and atria), f,h,j (bottom four)) or 500 μm (d (whole heart), j (top six)). Source Data
Fig. 2
Fig. 2. vNAS suppresses cardiovascular function.
a, ECG waveforms recorded under 2% isoflurane. Photostimulation substantially lowered the heart rate. b, Average heart-rate traces with different stimulation frequencies (left) and quantification (right) under isoflurane (iso). Increasing photostimulation frequencies reduced heart rates in a scalable manner (n = 9 for ChR2 mice, n = 5 for tdTomato mice; 10 Hz, P = 0.0079; 20 Hz, P < 0.0001). c, Left, illustration of the opto-ultrasound strategy. During recording, the ultrasound probe was placed on the left chest with an implanted optic fibre above the AP. Right, an example of the parasternal long axis view display. d, Photostimulation induced changes in cardiovascular metrics. Both systolic and diastolic left ventricle (LV) volume increased, whereas cardiac output and ejection fraction decreased. Stroke volume and fractional shortening did not change (n = 6 for ChR2 mice, n = 5 for tdTomato mice; ejection fraction, P = 0.0282; cardiac output, P = 0.0005; volume; systolic, P = 0.0282; volume; diastolic, P = 0.0282). Colour key for mice is used for eh. e, Left, blood pressure decreased with photostimulation in a time-locked manner. Right, quantification (n = 7 for ChR2 mice, n = 4 for tdTomato mice; P = 0.0029). f, Left, respiration was significantly suppressed followed by an increase with photostimulation (P < 0.0001). Right, quantification (n = 8 for ChR2 mice, n = 5 for tdTomato mice; P = 0.0001). g, No changes in internal body temperature were observed during photostimulation (n = 7 for ChR2 mice, n = 4 for tdTomato mice). h, Left, diagram depicting photostimulation and ECG recordings under freely moving conditions. Middle, photostimulation also significantly decreased the heart rate under awake conditions and remained suppressed after light delivery ended (P = 0.0001). Right, quantification (n = 7 for ChR2 mice, n = 5 for tdTomato mice, P < 0.0001). *P < 0.05, **P < 0.01, ***P < 0.001, ****P < 0.0001 by two-way ANOVA with Šidák multiple comparisons, two-tailed unpaired t-tests with Holm–Šidák multiple comparisons or two-tailed unpaired t-tests. All error bars and shaded areas show the mean ± s.e.m. Source Data
Fig. 3
Fig. 3. vNAS-triggered syncope is associated with widespread suppression of brain activity.
a, Illustration of head-fixed Neuropixels experiments. Cameras were positioned to record pupil and facial movements. b, Neuropixels probe trajectories were registered using SHARPtrack and plotted. c, Time course of eye dynamics during optogenetically triggered syncope. The pupil rapidly dilates (middle) followed by a characteristic eye-roll during syncope (right, n = 9 sessions from 5 mice). d, Latency to eye-rolling behaviour and 50% LFP power drop are correlated (r = 0.9596, P < 0.0001). e, Firing rates of units from all probes and mice that exhibited syncope during 20 Hz photostimulation. Left, neuronal spiking rates in most regions of the brain substantially decreased during syncope. Right, pie charts show the percentage of neurons that were inactive (grey area). f, Example of a Neuropixels recording session during 20 Hz photostimulation. Top to bottom: (1) recording showing reduction in heart-rate (ECG); (2) pupil area and whisking behaviour (Movement); (3) raw firing rates across two probes (Recording); (4) predicted firing rates based on movement model (Prediction); (5) residuals after subtracting predicted firing rates from recorded firing rates (Residual). Relevant events during recording are noted below with arrows. Windows of analysis are shown with dashed colour-coded boxes. g, Quantification of changes in brain activity that are not predicted by movements (residuals). Averages of residual activity during the pre-laser time window (top, grey). Small deviations from 0 indicates good predictive capability of the facial movement model under baseline conditions. Residual firing rates increase after laser onset (middle, blue). Significant changes were determined by comparison to pre-laser. Syncope onset showed a widespread decrease in firing rate that was not predicted by the facial movement model, except for the PVZ, which still significantly increased during syncope (bottom, red). *P < 0.05, **P < 0.01, ***P < 0.001 by two-tailed paired t-tests. All error bars show the mean ± s.e.m. See Methods for definitions of the abbreviations used for brain regions. Source Data
Fig. 4
Fig. 4. Parasympathetic suppression delays syncope-related phenotypes, including substantial drops in CBF.
a, Left, average heart-rate traces with photostimulation under atropine (Atro) and vehicle (Veh) pretreatment. Right, atropine markedly suppressed heart-rate drops (n = 7, P < 0.0001). Colour key for mice is used for b–m. b, As for a, but for the respiration rate (n = 7, after stimulation, P = 0.0110; during stimulation, P = 0.9695), c, As for a, but for blood pressure. Atropine reduced drops in blood pressure (n = 6, P = 0.0191). d, Head-fixed mice showed EEG power drops when treated with vehicle (left). Treatment with atropine delayed the latency (right, n = 14 sessions from 14 mice). e, Step plot showing the delay in latency to power drop (n = 14 sessions from 14 mice). f, Quantification of e shows that atropine increases latencies (n = 14 sessions from 14 mice, P = 0.0002). g, Illustration of head-fixed experiments that recorded CBF using LDF, with ECG, EEG and pupil recording during vNAS. h,i, Example recordings from the same mouse treated with vehicle (h) and atropine (i). Top to bottom: (1) ECG; (2) average EEG power normalized to baseline (Power); (3) LDF signal normalized to baseline reflecting CBF changes (LDF). Specific event markers are noted with arrows. j, Average traces of LDF across all experimental conditions (n = 7). k, Averaged data aligned to latency to reach 50% power drop (n = 7). l, Scatter plot between the maximum LDF drop during stimulation compared with the duration it remained below 50% of the maximum drop (n = 7). m, Quantification of the latency increases caused by atropine (n = 6; LDF min, P = 0.0010; EEG 50%, P = 0.0041; eye-roll, P = 0.0027). n, Plot illustrating the group-averaged dynamics of heart rate, LDF and power, with arrows denoting the progression over time. All groups started in the same state space at the top. After stimulation, groups rapidly diverged while following the same general pattern, even though their magnitudes were different (n = 7). *P < 0.05, **P < 0.01, ***P < 0.001, ****P < 0.0001 by two-way repeated measures ANOVA with Šidák multiple comparisons or two-tailed paired t-tests. All error bars and shaded areas show the mean ± s.e.m. Source Data
Fig. 5
Fig. 5. NPY2R VSNs are required for the BJR but not the baroreflex.
a, Schematic for ablating VSNs. b, Average heart-rate traces with PE, SNP and PBG injection. c, Quantification of drug efficacy after NPY2R VSN ablation. The baroreflex was still intact, whereas the BJR was abolished (PE, n = 10 for mCherry, n = 11 for diphtheria toxin subunit A (DTA), P = 0.4699; SNP, n = 7 for mCherry, n = 8 for DTA, P = 0.7969; PBG, n = 7 for mCherry, n = 9 for DTA, P < 0.0001). d, Heart-rate traces for vNAS adaptation with chemically induced baroreflex and BJR. PBG and PE were injected before, during and after adaptation. e, Quantification of PBG (second injection, P < 0.0001; third injection, P = 0.0378) and PE responses. vNAS adaptation selectively inhibited the BJR but had no effect on the baroreflex (n = 7). f, Illustration of the region-specific optogenetic strategy. PIEZO2-positive baroreceptive vagal afferents are mainly located in the carotid sinus and aortic arch. The following regions were stimulated: (1) the carotid sinus; (2) the superior laryngeal branch; and (3) the vagus nerve trunk above the cardiac branch. g,h, Average heart-rate traces (g, PIEZO2–ChR2, regions 1 and 2, P = 0.0030; NPY2R–ChR2, region 3, P = 0.0011) and quantification (h, region 1, n = 6, P = 0.0386; region 2, PIEZO2–ChR2, n = 6, NPY2R–ChR2, n = 9, P < 0.0001; region 3, PIEZO2–ChR2, n = 6, NPY2R–ChR2, n = 7, P < 0.0001) with region-specific photostimulation in NPY2R–ChR2 and PIEZO2–ChR2 mice. Stimulation of either region 1 or region 2 did not change the heart rate in NPY2R–ChR2 mice. By contrast, stimulating region 3 caused an immediate heart-rate drop only in NPY2R–ChR2 mice. PIEZO2–ChR2 mice showed heart-rate reductions only in regions 1 and 2, but not region 3, revealing functional separation between NPY2R and PIEZO2 VSNs. *P < 0.05, **P < 0.01, ****P < 0.0001 by two-tailed paired t-tests with Holm–Šidák multiple comparisons, two-way repeated measures ANOVA with Holm–Šidák multiple comparisons or two-way ANOVA with Holm–Šidák multiple comparisons. All error bars and shaded areas show the mean ± s.e.m. Source Data
Extended Data Fig. 1
Extended Data Fig. 1. Projection patterns of NPY2R vagal sensory neurons (VSNs) across multiple organs.
a, Single cell RNA sequencing of nodose ganglia shows separation of NPY2R and Piezo2 expression (reanalysis from previous report). b, Immunohistochemistry of nodose ganglia from PIEZO2-Cre mice infected by AAV2-DIO-mCherry showed minimal overlap between NPY2R and Piezo2 VSNs (left). Quantification of overlap (right, n = 8 nodose from 4 mice, NPY2R/overlap p = 0.0005, PIEZO2/overlap p = 0.0008). c, Immunohistochemistry of nodose ganglia from NPY2R/Ai9 mice showed transgenic tdTomato highly overlapped with endogenous NPY2R expression (n = 3). d, Quantification of overlap (77.45 ± 0.39%, n = 3). e, Light sheet images of a cleared whole heart (HYBRiD) with NPY2R VSNs transduced with AAV-PHP.S-DIO-gCOMET, dorsal and ventral views (left). Distribution of NPY2R VSN terminals across different heart regions (ventricles, atria, aortic arch). No labeling was observed in the interventricular septum (cross section). In the heart, NPY2R VSNs predominantly innervated the ventricular wall (n = 3). f, Light sheet images of cleared lung, stomach, small and large intestines showing NPY2R VSN innervation. p < 0.001***, by one-way repeated measures ANOVA with Geisser-Greenhouse correction and Tukey multiple comparisons. All error bars and shaded areas show mean ± s.e.m. Scale bars, 100 μm (b, c) 500 μm (e, f).
Extended Data Fig. 2
Extended Data Fig. 2. One-to-one map of vagal sensory neurons (VSNs).
a, Schematic of dual retrograde tracing of NPY2R VSNs from heart ventricles and gut (stomach, small and large intestine). b, Retrogradely labeled NPY2R VSNs from the heart ventricles (green), or gut (red, n = 3), in the nodose. c, Quantification of overlap. Nearly all of the heart and gut innervating neurons are non-overlapping, indicating that specific NPY2R VSNs project to the heart and gut separately (n = 3, heart/overlap p = 0.0112, heart/gut p = 0.0115). d, Spatial projection pattern of heart ventricles and gut innervating NPY2R VSNs in the AP and NTS (n = 3). e, Fiber density from heart ventricles or gut innervating NPY2R VSNs in the AP and NTS. The majority of fibers in the AP originate from heart ventricle innervating NPY2R VSNs (n = 3, p = 0.0102). f, NPY2R VSN terminals in retro-labeled heart ventricles and gut. Retro-labeled heart ventricle or gut fibers were only observed within heart ventricle or gut respectively (n = 3). g, NPY2R VSN terminals were not observed in stomach, small intestine, cecum, and large intestine after heart ventricle/lung dual retrograde tracing (n = 5). NPY2R VSN terminals were predominantly observed in the ventricle after atria/ventricle dual retrograde tracing (right, n = 5, p = 0.0145). h, Schematic of retrograde labeling (AAVrg-FLEX-GFP) of Vglut2 VSNs from the heart ventricles. Vglut2 is expressed by all VSNs. i, Retrogradely GFP labeled Vglut2 VSNs from the heart ventricles in the nodose ganglia (n = 4). j, Fiber distribution of retrogradely labeled GFP expressing Vglut2 VSNs from the heart ventricles in the AP and NTS (n = 4). k, Comparison of retrogradely labeled VSNs from the heart ventricles in Vglut2-Cre and NPY2R-Cre animals (top). Quantification of fibers from the heart ventricles innervating Vglut2 or NPY2R VSNs in the AP and NTS (bottom, n = 4 for Vglut2, n = 5 for NPY2R, p = 0.0225). l, Retrogradely labeled Vglut2 VSN terminals from the heart ventricles. Terminals were not observed in the lung, stomach, small and large intestine, or cecum (n = 4). m, Schematic of retrograde tracing of VSNs with wheat germ agglutinin (WGA) from heart ventricles (WGA 647), lung or trachea (WGA 488, n = 4). n, Heart ventricle (red), lung or trachea (green) innervating VSNs in the nodose ganglia after retrograde labeling (n = 4). o, Quantification of overlap after dual retro labeling. Similar to retrograde AAV tracing in NPY2R-Cre mice (Fig. 1e–g), most of the WGA488 and WGA647 labeled VSNs did not overlap (n = 4, heart/lung p = 0.0056, heart/overlap p = 0.0134; heart/trachea p = 0.0110, heart/overlap p = 0.0008, trachea/overlap p = 0.0068). p < 0.05* by one-way repeated measures ANOVA with Geisser-Greenhouse correction and Tukey multiple comparisons, two-way repeated measures ANOVA with Šidák multiple comparisons or two-way ANOVA with Šidák multiple comparisons. All error bars show mean ± s.e.m. Scale bars, 100 μm.
Extended Data Fig. 3
Extended Data Fig. 3. Organ specific spatial mapping of NPY2R vagal sensory neuron (VSN) fiber projections to the brainstem.
a, Brainstem images showing projection patterns of retrogradely labeled heart ventricle (green) or lung (red) innervating NPY2R VSNs with indicated bregma coordinates. Lung fibers were more prominent in caudal sections. Area postrema (AP) is predominantly labeled by heart ventricle projecting VSNs (n = 5) b, Schematic of retrograde tracing from AP in NPY2R-Cre mice. c, Nodose ganglia with retrogradely labeled NPY2R neurons projecting to the AP. d, Quantification of retrogradely labeled NPY2R neurons in nodose and the brain. Almost all NPY2R projections to the AP were from the nodose ganglia (n = 3). e, NPY2R VSN terminals in the heart ventricles and lung after retro-labeling from the AP. f, Quantifications of fiber density of NPY2R VSNs in heart ventricles and lung after retro-labeling from the AP (n = 3). All error bars show mean ± s.e.m., Scale bars, 100 μm.
Extended Data Fig. 4
Extended Data Fig. 4. Syncope is associated with a drop in EEG power.
a, Postmortem optic fiber tip locations targeted above the area postrema (AP) labeled on the corresponding (−7.4 mm AP) Allen Mouse Brain Common Coordinate Framework (CCF). Off-target fiber implants (yellow triangles) did not evoke behavioral phenotypes with photostimulation. Proper fiber placement is indicated by red squares. b, Quantification of behavior from video assessment. Buprenorphine was administered prior to vagal NPY2R to AP photostimulation to rule out a pain response and controlled by saline or no injection. Latency to first immobility (left), duration (middle), and number of bouts (right, n = 5 except for none/ChR2 = 6, none/tdTomato = 4). c, Single trial EEG analysis with on-target vagal NPY2R to AP stimulation (20 Hz) during freely moving recording. Raw EEG trace from temporal cortex is shown on top, average power between 8–100 Hz is shown in the middle with 50% and 80% thresholds, and the Morse wavelet power transformation is shown below as a heatmap. The latency to when baseline normalized average power between 8–100 Hz dropped below 50% is indicated by dashed red/black lines, the latency to when average power returned to 80% is marked by dashed white/black lines. The period between is considered one “bout”. d, Single trial EEG analysis of a mouse with off-target fiber placement (yellow triangle in “a”). Note, the average power trace does not cross the 50% threshold. e, Photostimulation produced a delayed, but stark power drop in the alpha-gamma range. The subtraction plot on the right is the same as Fig. 1m. This drop in the alpha-gamma range can be used as biomarker for syncope (n = 12 sessions across 8 mice). All error bars show mean ± s.e.m.
Extended Data Fig. 5
Extended Data Fig. 5. Physiological characterization of vagal NPY2R to area postrema (AP) photostimulation.
a, Representative ultrasound images of left ventricle (long-axis view) and aortic arch. b, 20 Hz photostimulation induced changes in the arch. After stimulation, the ascending aorta diameter decreased (AoV Diam, p = 0.0197). Aortic blood flow was also measured using a color Doppler function. Peak blood velocity in the ascending aorta (AV Peak vel, p = 0.0499) dropped. Aortic acceleration time (AAT, p = 0.0499) showed an increase induced by stimulation, indicating longer latency to reach peak velocity in the ascending aorta (right, n = 5). c, 20 Hz photostimulation induced changes in the left ventricle. After stimulation left ventricle end-systolic area increased significantly (Area;s, p = 0.0108), but no obvious change was observed in other parameters (left, n = 6 for ChR2, n = 5 for tdTomato). d, 10 Hz photostimulation induced changes in the aortic arch. After 10 Hz stimulation, only AoV Diam decreased (n = 6 for ChR2, n = 5 for tdTomato, p = 0.0346). e-f, 10 Hz photostimulation induced changes in the left ventricle. No obvious change was observed except for decreased cardiac output (n = 6 for ChR2, n = 5 for tdTomato, NPY2R/tdT mice with 20 Hz stimulation from Fig. 2d were reused as control, p = 0.0101). g, Blood-pressure during 5 Hz and 10 Hz photostimulation did not change compared to baseline (n = 6). h, Respiration-rates during 5 Hz and 10 Hz light stimulation showed no changes (n = 8 for ChR2, n = 5 for tdTomato). i, Heart-rate with 10 Hz stimulation during freely moving conditions showed sustained reduction during (left, p = 0.0353) and after laser delivery (n = 9 for ChR2, n = 5 for tdTomato, p < 0.0001). p < 0.05*, p < 0.0001**** by two-tailed unpaired t-tests with Holm-Šidák multiple comparisons or two-way ANOVA with Šidák multiple comparisons. All error bars and shaded areas show mean ± s.e.m.
Extended Data Fig. 6
Extended Data Fig. 6. Syncope is only triggered by 20 Hz vagal NPY2R to area postrema (AP) photostimulation.
a, Single trial LFP analysis with on-target vagal NPY2R to AP stimulation (20 Hz) during head-fixed Neuropixels recording. Average raw LFP trace is shown on top, the Morse wavelet power transformation is shown below as a heatmap. The latency to when baseline normalized average power between 8–100 Hz dropped below 50% is indicated by dashed red/black lines, the latency to when average power returned to 80% is marked by dashed white/black lines. The period between is considered one “bout”. b, Single trial LFP analysis of a mouse with off-target fiber placement. Note, no appreciable drop in 8–100 Hz power during the 20 Hz laser stimulation period. c, Group averaged power spectra in no light (left) and 5 Hz light conditions (middle). Mean power differences between conditions show scattered drops in power in the delta range and an increase in the beta-gamma range (right, n = 14 sessions across 8 mice for no light, n = 14 sessions across 7 mice for light). d, Same as in “c” but 10 Hz light, scattered drops in lower frequencies are observed, with minor effects in the gamma range (n = 14 sessions across 8 mice for no light, n = 14 sessions across 7 mice for light). e, 20 Hz photostimulation produced a delayed, but stark power drop in the alpha-gamma range which coincided with increased power in the lower delta range. This drop in the alpha-gamma range can be used as biomarker for syncope (n = 14 sessions across 8 mice for no light, n = 14 sessions across 7 mice for light).
Extended Data Fig. 7
Extended Data Fig. 7. Facial dynamics and Neuropixels data visualization during vagal NPY2R to area postrema (AP) stimulation.
a, Pupil area was tracked during photostimulation and averaged across sessions. b, Pupil area was significantly increased from baseline during photostimulation (n = 9 sessions from 5 mice, 5 Hz p = 0.0002, 10 Hz p = 0.0067, 20 Hz p = 0.0018). c, Max whisking values were collected in a 0-1 s time window after laser onset (insets) and averaged. These values were compared to normalized baseline whisking. Under all stimulation frequencies, mice quickly began whisking. d, Average whisking behavior increased during a 5 s window after laser onset at 5 and 10 Hz, but not the syncope inducing 20 Hz (n = 13 sessions from 7 mice, 5 Hz p = 0.0024, 10 Hz p = 0.0007). e, Aligning whisking behavior to syncope onset showed decrease of movement at 20 Hz (right) which was not observed at lower frequencies f, Quantification of whisking 2 s after syncope onset (n = 13 sessions from 7 mice, 20 Hz, p = 0.0254), and between 10–12 s after laser onset. g-h, Raw firing rates (left) and baseline z-scored firing rates (right) from all recordings across all animals at 5 Hz and 10 Hz stimulation in 100 ms time bins. i, Baseline z-scored firing rates from all recordings at 20 Hz stimulation in 100 ms time bins. Note the disruption of ongoing activity in most regions shortly after light onset under the 20 Hz condition as compared to 5 or 10 Hz: an average change of −0.17 in z-scored firing rate. p < 0.05*, p < 0.01**, p < 0.001*** by repeated measures two-way ANOVA with Šidák multiple comparisons. All error bars and shaded areas show mean ± s.e.m.
Extended Data Fig. 8
Extended Data Fig. 8. Regionwise neuronal activity after vagal NPY2R to area postrema (AP) stimulation controlling for spontaneous movements.
a, Spike rasters of neurons aligned to syncope onset (as defined by 50% LFP drop) and divided into groups of neurons that became inactive vs all other neurons. b, Quantification of neural activity during syncope. The percentage of active neurons dropped dramatically during syncope compared to a random time period (top, p < 0.0001). Scatter plot for individual brain regions (middle). Correlation between the prediction and raw data across all timepoints per area, in the control segment and the 20 Hz laser segment, in time bins of 1 s (bottom). c, Quantification of laser-activated neurons in each region. Activity traces of neurons at laser onset are normalized to individual maximum firing rate and averaged. Horizontal lines above each trace denote 25–75% quartiles, and the tick along the line is the median value by which regions have been sorted in ascending order (shortest to longest latency). Pie charts indicate the proportion of recorded cells in each region that were activated in response to laser onset (right, gray shaded area). d, Quantification of brain-wide neuronal activation in response to laser onset. All regions are activated within 60 ms of laser onset (bottom). e, Residual firing rates at 5, 10, and 20 Hz photostimulation in 100 ms bins. f, Region-wise residuals from 20 Hz laser stimulation separated into 4 response property categories. “laser” and “syncope” labels indicate the time window of response (laser and syncope onset, respectively), the “(↑)” and “(↓)” indicates the direction of change in the residual i.e. ( ↑ ) means the behavioral model was under-predicting neuronal firing, ( ↓ ) means overprediction. Most brain regions are dominated by neurons that include “syncope (↓)”. This indicated that the behavioral prediction model was mostly unable to predict reductions in neural activity during syncope. p < 0.001*** by two-tailed paired t-test.
Extended Data Fig. 9
Extended Data Fig. 9. Bidirectional manipulation of the hypothalamic periventricular zone (PVZ) modifies syncope expression and states of arousal.
a, Illustration of vNAS with PVZ chemogenetic inhibition experiments. b, Representative image of hM4Di-mCherry expression in PVZ area. c-d, PVZ inhibition induced by CNO injection did not change the heart-rate reduction (c) or respiration-rate reduction (d) caused by photostimulation (n = 7). e, Subtraction plots showing replication of syncope triggered changes in EEG power under vehicle (left, n = 9 for no light, n = 7 for light) and an expanded area of power reduction under PVZ inhibition with CNO (right, n = 7). f, Step plot showing latency to first bout of immobility in CNO (red line, n = 7) and Vehicle (black line, n = 7) group with 20 Hz photostimulation (blue area). g, Total duration of EEG power drop was increased when the PVZ was inhibited during 20 Hz photostimulation (n = 7, p = 0.0449). At 10 Hz under CNO, >50% power drops were observed in 3 out of 7 mice, while that threshold was not reached under Vehicle. h, Illustration of vNAS with PVZ chemogenetic activation experiments. i, Representative image of hM3Dq-mCherry expression in PVZ area. j-k, PVZ excitation induced by CNO injection did not change the heart-rate reduction (j) or respiration-rate reduction (k) caused by photostimulation (n = 6). l, Subtraction plots showing replication of syncope triggered changes in power under vehicle (left) and unchanged power difference in the gamma range, but a decrease in delta (1–4 Hz) under CNO triggered PVZ activation (right, n = 10 sessions across 5 mice). m, Step plot showing latency to first bout of immobility in CNO (red line) and Vehicle (black line) group with 20 Hz photostimulation (blue area, n = 5). Note that 2 of the 5 mice did not faint under the CNO condition, suggesting a suppression of vNAS triggered syncope. n, Total duration of 50% power drop was unchanged between Vehicle and CNO conditions (n = 5). o, Average plots showing locomotor activity 4 min before 20 Hz stimulation (pre) and after (post) with PVZ chemogenetic manipulation under CNO. Mice with hM3Dq expression in the PVZ (green) showed dramatic increases in baseline locomotor activity (pre, hM4Di(Veh) p = 0.0001, hM4Di(CNO) & hM3Dq(Veh) p < 0.0001) under CNO and continued to move around the arena after recovering from 20 Hz induced syncope (post, hM4Di(Veh), hM4Di(CNO) & hM3Dq(Veh) p < 0.0001, n = 10 sessions from 5 mice for hM3dq, n = 7 sessions from 7 mice for hM4Di). p, Average fast-fourier transform (FFT) of EEG recording before and after 20 Hz photostimulation with PVZ chemogenetic manipulation under CNO. In hM4Di mice (left, blue n = 7) pairwise pre/post comparisons reveal significant drops in the gamma range after stimulation (GammaL(Veh) p = 0.0072, GammaH(Veh) p = 0.0101, GammaL(CNO) p = 0.0018, GammaH(CNO) p = 0.0012), indicating potential sustained reduction in arousal state, which is also reflected in their locomotor activity. In addition, CNO compared to Vehicle dropped gamma power even before 20 Hz stimulus was delivered (GammaL(pre) p = 0.0128, GammaH(pre) p = 0.0004). In hM3Dq mice (right, green, n = 10 session across 5 mice) pairwise pre/post comparisons reveal significant drops in delta (Vehicle p = 0.0019, CNO p = 0.0034) and alpha power (CNO p = 0.0006), and interestingly, no observable drops in the gamma range under CNO (GammaL(pre/post) p = 0.2377, GammaH(pre/post) p = 0.1449). Taken together, 20 Hz photostimulation may cause a sustained reduction in arousal state, while ongoing PVZ activation (CNO) causes an increase in baseline (pre) arousal state (GammaL p < 0.0001) which is maintained even after 20 Hz photostimulation. p < 0.05*, p < 0.01**, p < 0.001***, p < 0.0001**** by paired two-tailed t-tests, paired two-tailed t-tests with Holm-Šidák multiple comparisons, two-way repeated measures ANOVA with Šidák multiple comparisons or two-way repeated measures ANOVA with Holm-Šidák multiple comparisons. Scale bars, 100μm. All error bars and shaded areas show mean ± s.e.m.
Extended Data Fig. 10
Extended Data Fig. 10. Atropine selectively attenuates vNAS induced drops in heart-rate, but does not alter sensory adaptation patterns.
a, Effects of atropine on 5 and 10 Hz vNAS induced heart-rate reduction. Heart-rate reduction was significantly attenuated by atropine during 10 Hz (n = 7, p = 0.0006) but not 5 Hz photostimulation. b, Effects of atropine on 5, 10 Hz photostimulation induced respiration-rate reduction. No significant difference was observed between vehicle and atropine group (n = 7). c, Latency to eye-roll and 50% LFP/EEG drops were still correlated under atropine, but displayed longer latencies compared to vehicle (all combined head-fixed experiments, n = 22 for control, n = 13 for atropine, combined Pearson’s r = 0.6099, p = 0.0001). d, Plot of group averaged heart-rate using 5, 10 and 20 Hz 5 s on/off photostimulation. Heart-rate rapidly changed during each 5 s on/off transition. Insets depict heart-rate adaptation across the first and last 4 light bursts over a 10 min period (n = 5 for 20 Hz, n = 6 for 5 & 10 Hz, n = 4 for NPY2R/tdT). e, The average of the first 4 minimum peaks was compared to the average of the last 4 minimum peaks. Robust adaptation was observed at both 20 Hz (p < 0.0001) and 10 Hz (p = 0.0005), with no adaptation at 5 Hz (n = 5 for 20 Hz, n = 6 for 5 & 10 Hz, n = 4 for NPY2R/tdT). f, Plot of group averaged heart-rate using 20 Hz 5 s on/off photostimulation with atropine. Atropine blunted rapid heart rate changes during the 5 s on/off stimulation pattern (n = 6). g, The average of the first 4 minimum peaks was compared to the average of the last 4 minimum peaks in vehicle (p < 0.0001) and atropine (p = 0.0039) condition. While atropine reduced the magnitude of heart-rate reduction, strong adaptation still occurred by the end of the train (n = 6). This indicates that adaptation to the 20 Hz photostimulation does not occur at the motor-output level but more likely at the sensory-input level. p < 0.01**, p < 0.001***, p < 0.0001**** by two-way repeated measures ANOVA with Šidák multiple comparisons, or Pearson’s correlation. All error bars and shaded areas show mean ± s.e.m.
Extended Data Fig. 11
Extended Data Fig. 11. Atropine augments sustained changes in cerebral blood flow (CBF) and delays other metrics in response to vNAS.
a, Extended time window of LDF measured CBF (Fig. 4j) with vNAS (left). Atropine caused a sustained higher CBF for minutes following 20 Hz photostimulation. A ‘late recovery phase’ is marked as dashed box during last 100 s. Inset depicts at least 200 ms delay in changes in CBF following laser onset. Average CBF measurements during the last 100 s remained higher under atropine compared to all other conditions (right, n = 7, 20 Hz(Veh) p = 0.0444, 10 Hz(Veh) p = 0.0283, 5 Hz(Veh) p = 0.0219). b, Scatter plot of the time CBF takes to recover to baseline post vNAS, compared to the CBF minima during 30 s vNAS. Note that CBF under the atropine condition in 4 out of 7 mice, did not return to baseline during the recording window. c, Scatter plot of the duration of time spent below 50% of the baseline CBF compared to the rate coefficient, (i.e., rate of CBF decrease/rate of CBF increase, which captures the shape of CBF change across time, a higher rate coefficient indicates a rapid decrease followed by a slower increase) during vNAS stimulation. The dashed line on the scatter plot marks a line (4 s duration CBF drop) that segregates fainters vs non-fainters. d, Mean fast-fourier transform (FFT) of EEG recording before and after 20 Hz vNAS (left). Atropine caused a general increase in power (three-way ANOVA, main effect of Atropine, p < 0.0002). Pairwise pre/post comparisons reveal drops in the beta-gamma range after stimulation (Beta(Veh) p = 0.0424. Beta(Atro) p = 0.0065, GammaL(Veh) p = 0.0327, GammaH(Atro) p = 0.0209), indicating potential sustained reduction in arousal state under head-fixed conditions (right, n = 7). e, Violin plot depicting the time-course of recorded events during 20 Hz vNAS. Note that atropine causes a delay in observed sequence of events (HR, LDF, EEG, and eye-roll, n = 6 for all except n = 7 for LDF min and EEG 50% vehicle). p < 0.05*, p < 0.01** by two-tailed paired t-tests with Holm-Šidák multiple comparisons or repeated measures ANOVA with Holm-Šidák multiple comparisons. All error bars and shaded areas show mean ± s.e.m.
Extended Data Fig. 12
Extended Data Fig. 12. Behavioral and state changes caused by vNAS.
a, Color-coded ethogram using the MoSeq pipeline (1 mouse per row). Photostimulation promotes immobility. To the right of the ethogram, pie charts show the proportion of time individual mice spent engaged in each behavior during baseline (BL1) and photostimulation (Light) periods. b, Quantification of the % change in behavior during light and baseline conditions. Photostimulation significantly increased immobility (n = 6 for ChR2, n = 5 for tdTomato, p = 0.0155) and decreased rearing (p = 0.0254). c, Moseq data shown is the final day of habituation data one day prior to experimental photostimulation. On the right, pie charts show the proportion of time individual mice spent engaged in each behavior during the full habituation period the day before (BL2) and during the 15 min baseline period on the following photostimulation experimental day (BL1, a). d, Quantification of baseline behavior during habituation day (BL2) and experimental baseline day (BL1). Baseline behavior was the same across mice during both periods (n = 6 for ChR2, n = 5 for tdTomato). e, Average plots showing locomotor activity 4 min before 20 Hz stimulation (pre) and after (post) with either vehicle or atropine. In addition to acute syncope, brief 20 Hz vNAS for 30 s causes sustained reduction in mouse locomotion which is not altered by atropine (n = 12 sessions across 7 mice for atropine, n = 11 sessions across 7 mice for vehicle, two-way repeated measures ANOVA, main effect of pre/post, p = 0.0002). f, Fast-Fourier transform (FFT) of EEG recording before and after 20 Hz photostimulation. Average traces of FFT profile (left) show a general increase in power under atropine (n = 12 sessions across 7 mice, three-way ANOVA, main effect of Atropine, p = 0.0108, replicated in Extended Data Fig. 11d). Pairwise pre/post comparisons (right) reveal significant drops in the beta-gamma range after stimulation (Beta(Atro) p = 0.0015, GammaL(Atro) p < 0.0001, GammaH(Veh) p = 0.0301, GammaH(Atro) p < 0.0001), indicating potential sustained reduction in arousal state, which is also reflected in their locomotor activity. p < 0.05*, p < 0.01**, p < 0.001***, p < 0.0001**** by two-tailed paired or unpaired t-tests with Holm-Šidák multiple comparisons or two-way repeated measures ANOVA. All error bars and shaded areas show mean ± s.e.m.
Extended Data Fig. 13
Extended Data Fig. 13. Ablation of NPY2R VSNs abolishes vNAS induced syncope and physiological changes.
a, Schematic of vNAS with diphtheria toxin subunit A (DTA) mediated ablation of NPY2R VSNs. b, Representative image of nodose ganglia injected with AAV-mCherry-FLEX-DTA virus and stained with NPY2R antibody (n = 13). Scale bar, 100 μm. c, Mice were tested for syncope and EEG power drops before DTA injection (left, n = 11 sessions across 7 mice). After DTA ablation of NPY2R VSNs, the same mice showed no appreciable drops in EEG power (middle, n = 12 sessions across 6 mice). Subtraction plots show significant differences in expected time x frequency ranges that are associated with syncope. d, Step plot showing latency to 50% mean power drop relative to baseline between 8–100 Hz with photostimulation (blue area). Notably, no mice reached the 50% power threshold after DTA ablation (n = 6). e, vNAS induced heart-rate reduction in control and DTA group. DTA mice showed less robust reduction compared to control group with 20 Hz stimulation (n = 6, p < 0.0001). f, vNAS induced respiration-rate changes in control and DTA group. During 20 Hz vNAS, respiration-rate reduction was markedly suppressed in DTA group (n = 5, p < 0.0001). g, Blood-pressure did not decrease with 20 Hz vNAS in DTA group (n = 6, p = 0.0019). h-j, Cardiac metrics of left ventricle (n = 6) and aortic arch (DTA n = 6, control n = 5) measured by ultrasound in DTA mice with 20 Hz vNAS. Reduction in cardiac output (p = 0.0043) was blocked. Changes in other parameters also showed a trend of being blunted compared to control group (control group data was reused from 20 Hz NPY2R/ChR2 mice Fig. 2d, Extended Data Fig. 5b, c). p < 0.01**, p < 0.0001**** by two-tailed paired or unpaired t-tests with Holm-Šidák multiple comparisons or two-way repeated measures ANOVA with Šidák multiple comparisons. All error bars show mean ± s.e.m.
Extended Data Fig. 14
Extended Data Fig. 14. Specificity of the vagal bed in the Bezold-Jarisch reflex.
a-d, DTA ablation of NPY2R VSNs did not affect basic cardiac functions (a-b n = 11, c-d n = 7). e, PBG induced a dose dependent dip in heart-rate which was blocked by atropine (left) and quantification (right, n = 5, PBS compared with PBG 0.03 p = 0.0030, PBG 0.05 p < 0.0001, PBG 0.1+atropine p = 0.8466). f, DTA ablation did not affect water intake after 48-hour water deprivation (DTA n = 8, control n = 7). g, Illustration of region-specific vagal optogenetic strategy. h, Heart-rate did not change after abdominal branch photostimulation (n = 6). i, Average traces of respiration-rate with region-specific stimulation in NPY2R-ChR2 mice. j, Respiration-rate only decreased while stimulating the vagal trunk (region 3) above the abdominal branch (region[1] n = 6, [2] n = 9, [3] n = 7, [4] n = 5, [5] n = 6, region[3] compared to region[1] p = 0.0193, [2] p = 0.0106, [4] p = 0.0269, [5] p = 0.0044). k, Schematic of TRAP mediated optogenetic stimulation of barosenstive neurons in the NTS. l, Average power plots from a representative mouse using 17 trials of no light (left) or photostimulation (middle) of TRAPed barosensitive neurons of the NTS. Subtraction plots show no evidence of syncope-like changes in gamma power observed in vNAS (right) despite large dips in heart-rate. In addition, as published increases in the delta range were observed, consistent with previous observations (data from a published report provided by Dr. Yang Dan). p < 0.05*, p < 0.01**, p < 0.0001**** by one way ANOVA with Holm-Šidák multiple comparisons or Tukey multiple comparisons. All error bars and shaded areas show mean ± s.e.m.
Extended Data Fig. 15
Extended Data Fig. 15. Target defined scRNA seq data analysis of the nodose ganglia.
a, A list of genetic markers and their primary anatomical targets which have been previously reported. Syncope has never been reported with photostimulation of these various genetically defined VSNs. b, Single cell RNA sequencing of nodose ganglia, showing comparison of NPY2R (red) and other markers (green) expression in VSN clusters (reanalyzed from previous reports,,,–).
Extended Data Fig. 16
Extended Data Fig. 16. Putative receptors and channels expressed by NPY2R VSNs.
a, Single cell RNA sequencing of nodose ganglia, showing comparison of NPY2R (red) and some putative receptor and channel (green) expression in VSN clusters.

Comment in

References

    1. Bonaz B, et al. Diseases, disorders, and comorbidities of interoception. Trends Neurosci. 2021;44:39–51. doi: 10.1016/j.tins.2020.09.009. - DOI - PubMed
    1. Mark AL. The Bezold–Jarisch reflex revisited: clinical implications of inhibitory reflexes originating in the heart. J. Am. Coll. Cardiol. 1983;1:90–102. doi: 10.1016/S0735-1097(83)80014-X. - DOI - PubMed
    1. Von Bezold A. Uber die physiologischen Wirkungen des essigsauren Veratrines. Untersch. Physiolog. Lab. Wurzburg. 1867;1:75–156.
    1. Nudell V, et al. HYBRiD: hydrogel-reinforced DISCO for clearing mammalian bodies. Nat. Methods. 2022;19:479–485. doi: 10.1038/s41592-022-01427-0. - DOI - PMC - PubMed
    1. Silvani A, Calandra-Buonaura G, Dampney RAL, Cortelli P. Brain–heart interactions: physiology and clinical implications. Philos. Trans. Royal Soc. A Math. Phys. Eng. Sci. 2016;374:20150181. - PubMed

Publication types

MeSH terms

Substances