. 2023 Nov;623(7986):432-441.
doi: 10.1038/s41586-023-06682-5. Epub 2023 Nov 1.

Epigenetic regulation during cancer transitions across 11 tumour types

Affiliations

Epigenetic regulation during cancer transitions across 11 tumour types

Nadezhda V Terekhanova et al. Nature. 2023 Nov.

Abstract

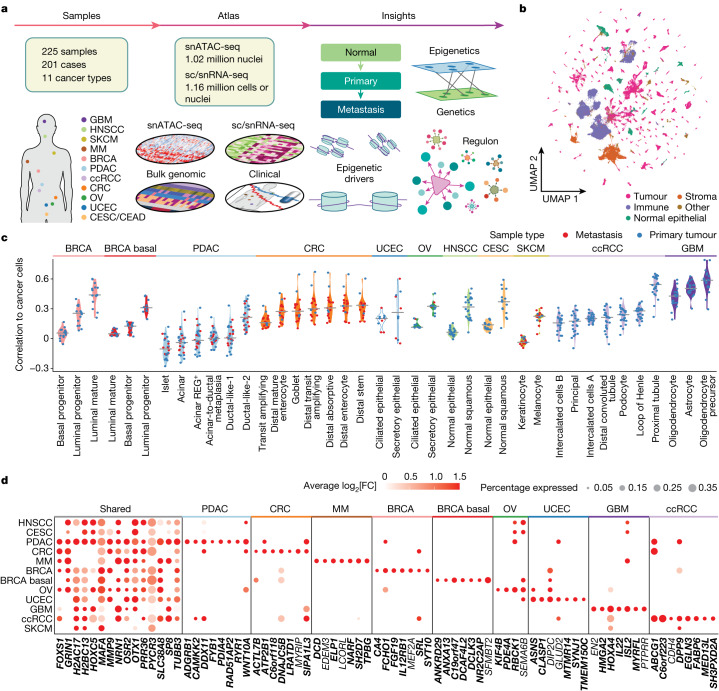
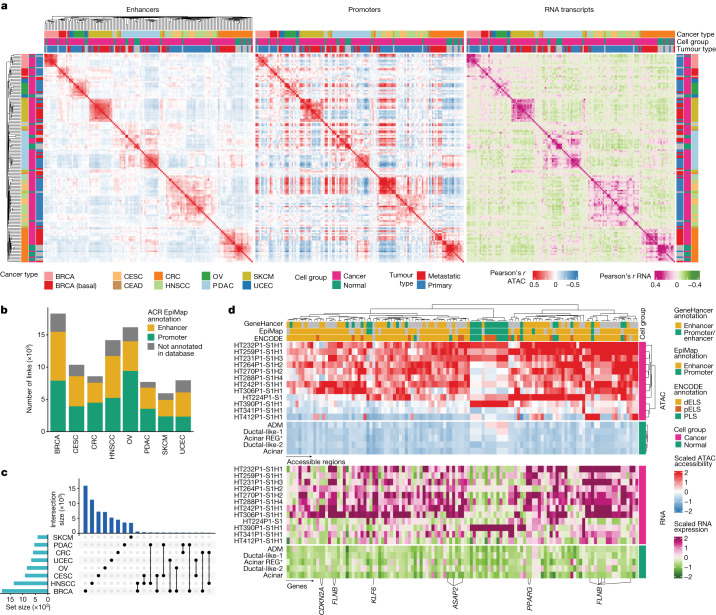
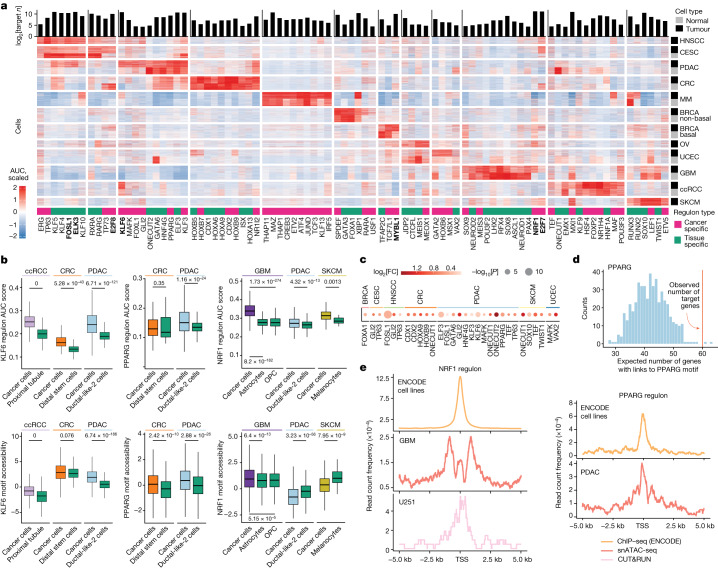
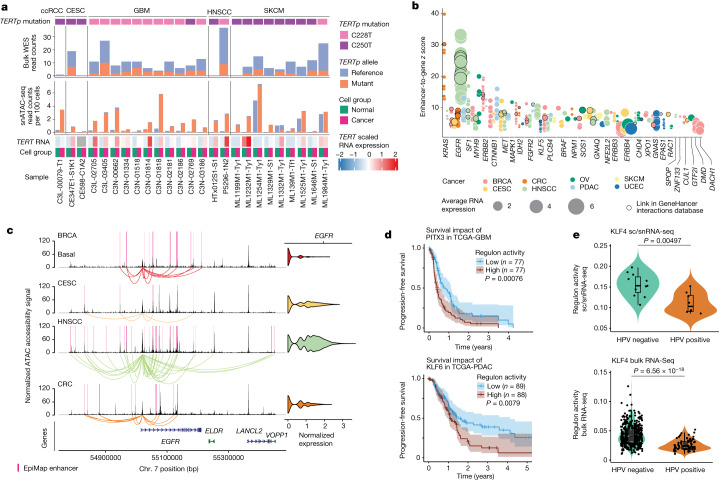
Chromatin accessibility is essential in regulating gene expression and cellular identity, and alterations in accessibility have been implicated in driving cancer initiation, progression and metastasis1-4. Although the genetic contributions to oncogenic transitions have been investigated, epigenetic drivers remain less understood. Here we constructed a pan-cancer epigenetic and transcriptomic atlas using single-nucleus chromatin accessibility data (using single-nucleus assay for transposase-accessible chromatin) from 225 samples and matched single-cell or single-nucleus RNA-sequencing expression data from 206 samples. With over 1 million cells from each platform analysed through the enrichment of accessible chromatin regions, transcription factor motifs and regulons, we identified epigenetic drivers associated with cancer transitions. Some epigenetic drivers appeared in multiple cancers (for example, regulatory regions of ABCC1 and VEGFA; GATA6 and FOX-family motifs), whereas others were cancer specific (for example, regulatory regions of FGF19, ASAP2 and EN1, and the PBX3 motif). Among epigenetically altered pathways, TP53, hypoxia and TNF signalling were linked to cancer initiation, whereas oestrogen response, epithelial-mesenchymal transition and apical junction were tied to metastatic transition. Furthermore, we revealed a marked correlation between enhancer accessibility and gene expression and uncovered cooperation between epigenetic and genetic drivers. This atlas provides a foundation for further investigation of epigenetic dynamics in cancer transitions.


Conflict of interest statement

The authors declare no competing interests.

Figures

Fig. 1
Fig. 1. Chromatin accessibility patterns across 11 cancer types.
a, Schematic of the data generation and study design, showing the cancer types and sample types collected, the building, annotation and integration of the atlas, and the biological entities that were investigated. b, Uniform manifold approximation and projection (UMAP) plot of an integrated pan-cancer snATAC-seq object showing the distribution of 250,222 immune, 69,684 stromal, 69,506 normal epithelial and 588,895 cancer cells across 225 samples. A detailed breakdown of 36 different cell types is shown in Extended Data Figs. 1b and 2a,b. c, The Pearson’s correlation coefficients between cancer cells from each tumour and normal cell types of the tumour’s tissue of origin. Cell types are ordered by increasing median correlation coefficient per cohort; the right-most cell type was considered the CNC and was subsequently used as a reference for identifying cancer-associated epigenetic drivers. d, The top cancer-cell-associated DACRs identified by comparing cancer cells versus the CNCs. The bubble size shows the percentage of cancer cells with accessible DACRs and the colour conveys the log2[FC]. The x axis shows the nearest gene of each DACR. Genes are grouped by those shared between cancers and those specific to cancer types. Cancer-specific DACRs were selected on the basis of specificity and by fold change (FC) in each cancer type (columns), or if they were shared by the maximal number of cancers (shared). Positive log2[FC] is shown if ACR was accessible in >5% of cancer cells. DACRs of genes that overlap promoters and enhancers from the EpiMap database are highlighted in bold.
Fig. 2
Fig. 2. CREs regulating transcriptional programs in cancer.
a, Sample-wise Pearson’s correlations of cancer cells and normal cells from the same tissue (snMultiome-seq samples) computed based on the accessibility of ACRs overlapping EpiMap enhancer regions (left), ACRs overlapping EpiMap promoter regions (centre) and RNA transcripts (right). The left heat map was clustered using a single-linkage clustering method and Euclidean distance, and the centre and the right heat maps follow the same order. b, The counts of ACR-to-gene links by cancer type and coloured by EpiMap annotation of ACRs. c, An UpSet plot showing that most enhancer-to-gene links are cancer-type specific. The connected dots at the bottom right indicate ACR-to-gene links shared between the cancer types denoted. d, The accessibility of ACRs (top) that are linked to gene expression (bottom) in PDAC cancer cells. The heat maps show the average normalized and scaled snATAC-seq and snRNA-seq values aggregated by sample for cancer cells and by cell type for normal pancreas cells. The top heat map was clustered using Ward’s minimum-variance method (Ward.D2 from R) and Euclidean distance. The bottom heat map columns and rows follow the order of the top heat map. Acinar, acinar cells; acinar REG+, acinar cells with high expression of regenerating proteins; ADM, acinar-to-ductal metaplasia; dELS, distal cis-regulatory regions (CREs) with enhancer-like signatures; ductal-like-1, ductal cells with high SPP1 and CRP; ductal-like-2, ductal cells with increased mucus genes and trefoil factor genes; islets, all islets of Langerhans cells; pELS, proximal CREs with enhancer-like signatures; PLS, CREs with promoter-like signatures.
Fig. 3
Fig. 3. Pan-cancer and cancer-specific regulons.
a, Tissue- and cancer-cell-specific regulons (columns) identified using SCENIC on sc/snRNA-seq data, where a regulon is a TF and its n target genes, with the number of genes shown at the top. The heat map shows scaled area under the curve (AUC) scores across 200 tumour and 200 normal randomly selected cells (rows) from each cancer. Cancer-specific regulons show higher activity in cancer cells versus the CNC. The top cancer-cell-specific regulons shared across several cancers are highlighted in bold. b, Regulon activity scores in primary cancer cells and corresponding CNCs (top; n = 2,211 (PDAC), n = 744 (ductal-like-2), n = 5,000 (ccRCC), n = 714 (proximal tubule), n = 446 (CRC), n = 184 (distal stem cells), n = 3,600 (GBM), n = 842 (OPC), n = 389 (astrocytes), n = 800 (SKCM) and n = 20 (melanocytes)) and TF motif accessibility scores (bottom; n = 30,428 (PDAC), n = 1,652 (ductal-like-2), n = 106,250 (ccRCC), n = 11,471 (proximal tubule), n = 6,243 (CRC), n = 860 (distal stem cells), n = 83,507 (GBM), n = 933 (OPC), n = 996 (astrocytes), n = 7,844 (SKCM) and n = 20 (melanocytes)). The boxes are coloured by cancer type, and the green boxes represent normal cells. FDR-adjusted Wilcoxon two-sided P values are shown (Supplementary Table 4c,e). For the box plots, the centre line shows the median, the box limits show the first and third quartiles, the upper and lower whiskers extend from the hinge to the largest or the lowest value no further than 1.5× the interquartile range (IQR) from the hinge. c, TFs of which the target genes are enriched for TF-specific ACR-to-gene links (ACR containing this TF-binding site). Colour indicates the log2[FC] between the observed number of target genes with such links over the expected number (K1, ..., n) of random genes with such links. One-sided P values were calculated for each regulon from a Gaussian z score, z = (M − μ)/σ, where M is the observed number of target genes linked to TF motifs. d, Example of the normal distribution of the number of genes with PPARG-specific PDAC ACR-to-gene links found in randomly sampled genes. The observed number of PPARG target genes with PPARG-specific ACR-to-gene links is indicated by the red line. e, The presence of ChIP–seq peaks (ENCODE), snATAC-seq peaks or CUT&RUN peaks around the TSS of target genes.
Fig. 4
Fig. 4. Epigenetic programs activated in cancer metastasis.
a, TFs with differential motif accessibilities between metastasis and primary samples in four cancer types. The y axis shows FDR-adjusted P values calculated using two-sided Wilcoxon rank-sum tests. The expression score corresponds to the absolute value of the log2[FC] in TF expression between metastasis and primary cancer cells, using per sample average values, and requiring the same fold change direction as that of the motif score difference for the same TF–cancer pair. b, mpIHC analysis of GATA6 (red) expression in mouse models of PDAC. CK19 (green) marks cancer cells and DAPI (blue) marks nuclei. Scale bars, 100 μm (main images) and 50 μm (insets). c, The GATA6+ and GATA6high cancer cell percentage was higher in primary PDAC compared with in matched metastatic (met.) PDAC. n = 6. P values calculated using two-sided paired t-tests are shown. For the box plots, the centre line shows the median, the box limits show the first and third quartiles, the upper and lower whiskers extend from the hinge to the largest or the lowest value no further than 1.5 × IQR from the hinge. d, Significant and suggestive (FDR ≤ 20%) hallmark pathway enrichments from DACRs upregulated in metastatic versus primary tumour. The bubble size and colour convey gene count and log10[FDR], respectively. The total number of DACRs per cancer type used in the analysis was capped at 5,000 by log2[FC] (top). The total number of DACRs annotated in each pathway is shown on the right. e,f, UMAP plots (left) for paired primary and metastasis samples of a CRC case (e) and a UCEC case (f). The small heat maps show Pearson’s correlation coefficients based on TF-motif scores averaged per cluster in each sample. Scatter plots showing cells ordered along the trajectories identified by Slingshot (centre), and scatter plots showing the association between PBX3 (e) or SNAI1 (f) motif accessibility and the progression of pseudotime (right) are shown.
Fig. 5
Fig. 5. The impact of genetic drivers on chromatin accessibility.
a, TERTp mutations (C228T and C250T) detected in five cancer types from snATAC-seq data and WES data. Read counts supporting the reference or mutant allele in bulk WES data (top) and snATAC-seq data (bottom) are shown. snATAC-seq-supported reads were counted separately for cancer cells and normal cells and then normalized to the total number of cells in each group. The heat map at the bottom shows TERT expression in cancer and normal cells per sample. b, Epigenetic regulation of known oncogenes identified using snMultiome-seq data. Each dot shows one enhancer-to-gene link z score. The enhancer-to-gene z score was computed by averaging ACR-to-gene link z scores for all ACRs falling into one enhancer, as annotated in the EpiMap or GeneHancer database. The dot colour corresponds to a cancer type in which an ACR-to-gene link was identified, and the dot size corresponds to normalized RNA expression of the genes shown on the x axis. c, Coverage plot of the EGFR region in BRCA basal, CESC, HNSCC and CRC cancer cells. Only samples with neutral EGFR CNV were included. EGFR RNA expression is shown on the right. d, Kaplan–Meier plots and analysis of progression-free survival in the TCGA-GBM cohort stratified by PITX3 regulon activity (top) and in the TCGA-PDAC cohort stratified by KLF6 regulon activity (bottom). The error bands represent the 95% confidence intervals. Two-sided P values calculated using log-rank (Mantel–Cox) tests are indicated. High- and low-regulon-activity groups are defined on the basis of values above and below the median, respectively. n is specified for each patient subgroup. e, Regulon activity of KLF4 in HPV-positive and HPV-negative HNSCC samples from this study (top) and TCGA-HNSCC (bottom). P values calculated using two-sided Wilcoxon rank-sum tests are shown.
Extended Data Fig. 1
Extended Data Fig. 1. snATAC-seq and sc/snRNA-seq data overview.
a, Overview of the cohort and sample availability, indicating 11 different cancer types, 3 sample types (NAT - normal adjacent tissue, Primary - primary tumour, Metastasis - metastatic tumour), and 3 data types collected for each sample. The bar plot annotation on top of the heatmap provides information about the number of peaks detected in each sample. b, UMAPs of 11 cancer types based on snATAC-seq chromatin accessibility. Each cell is colour-coded by cell type to visualize the differences in chromatin accessibility. c, UMAPs of 11 cancer types based on sc/snRNA-seq data. Each cell is colour-coded by cell type to visualize the differences in gene expression.
Extended Data Fig. 2
Extended Data Fig. 2. Integrated data overview and DACRs between cancer cells.
a-c, UMAPs of pan-cancer objects: (a) 225 snATAC-seq samples, all cell types; (b) 225 snATAC-seq samples, tumour and selected normal cell types; (c) 206 sc/snRNA-seq samples, tumour and selected normal cell types. Cells are coloured by cell type. d-f, UMAPs of pan-cancer objects: (d) 225 snATAC-seq samples, all cell types; (e) 225 snATAC-seq samples, tumour and selected normal cell types; (f) 206 sc/snRNA-seq samples, tumour and selected normal cell types. Cells are coloured by cancer type. g, Tissue- and cancer cell-specific differentially accessible chromatin regions (DACRs) identified across 11 cancer types. Columns correspond to DACRs and rows to tumour samples of every cancer type. For each sample peak accessibility was calculated as average across its cancer cells. Labels on the abscissa indicate DACRs that are in promoters of the top 5 tissue- and cancer cell-specific DEGs by fold change. DACRs that are shared between CESC/HNSCC and UCEC/OV are highlighted.
Extended Data Fig. 3
Extended Data Fig. 3. Similarity patterns between squamous cancers, and OV and UCEC.
a, tSNE-plot based on top tissue- and cancer cell-specific DACRs from Extended Data Fig. 2g showing tumour samples clustering. CESC/HNSCC and UCEC/OV clusters of samples are highlighted with shading. b, Dot plots showing squamous and adenocarcinoma markers snRNA-seq expression in CESC/AD and PDAC samples. Markers were obtained from. c, snATAC-seq based coverage plots showing examples of pan-cancer ACRs: KRT6A (left) is shared between CESC and HNSCC, and PAX8 (right) is shared among UCEC, OV, CEAD, and ccRCC cancer types.
Extended Data Fig. 4
Extended Data Fig. 4. Characterization of cancer cell-specific DACRs.
a, Violin plots showing distributions of Pearson correlation coefficients between cancer cells from each tumour and normal cell types of tissue of origin using snRNA-seq data. For each cohort, cell types are ordered by increasing median correlation coefficient across samples. b, Bubble plot showing top down-regulated cancer cell-associated DACRs, including shared and cancer-specific DACRs, identified by comparing cancer cells vs. CNC. Bubble size shows percentage of cancer cells with accessible DACR and colour conveys log2 fold change (FC). X-axis shows the nearest gene of each DACRs. Genes are grouped by those shared between cancers and those specific to cancer types. Cancer-specific DACRs were selected based on specificity and by FC in each cancer type (columns), or if they were shared by maximal number of cancers (shared). Negative log2(FC) is shown if ACR was accessible in >0.05 of cancer cells. Genes’ DACRs that overlap promoters and enhancers from the EpiMap database are highlighted in bold. c, Bar chart shows counts of primary cancer cells vs. CNCs DACRs broken down by EpiMap annotation. 53% of DACRs are annotated as enhancer regions and 37% as promoter regions, the rest are not annotated in EpiMap. d, Bar plot showing the proportion of primary cancer cells vs. CNCs DACRs (FDR < 0.05) for which the nearest gene definitively changes expression in the same direction (includes significant RNA hits at FDR < 0.05 and suggestive RNA hits at FDR < 0.3, absolute log2FC > 0.05), or gene indicatively changes expression in the same direction (absolute log2FC < 0.05). DACRs and nearby genes that do not match in the direction of accessibility/expression are marked as ‘not matching’. e, Scatter plots showing correlation of log2FC of DACRs and log2FC of DEGs of nearby genes. Spearman’s rho values and two-sided p-values are shown. Dot colour indicates -log10(FDR). The grey band corresponds to the 95% confidence level interval for predictions from the linear model. f, Bubble plot showing significant and suggestive (FDR ≤ 20%) hallmark pathway enrichments from upregulated cancer cell-specific DACRs in panel Fig. 1d. Bubble size and colour convey gene count and log10 of FDR, respectively. The total number of DACRs per cancer type in the analysis is capped at 1,000 by log2 fold change to ensure balanced comparison (top bar plot). Total number of DACRs annotated in each hallmark pathway are shown on the bar plot on the right. g, Coverage plots showing chromatin accessibility in genomic regions containing genes ABCC1 and VEGFA for neoplastic cells and CNC in each cancer type. DACRs are highlighted and gene expression levels show concordance with chromatin accessibility (right).
Extended Data Fig. 5
Extended Data Fig. 5. Cancer cell-specific enhancers.
a, Bar chart showing proportions of ACR-to-gene links found in GeneHancer Interactions database (red and blue indicate found and not found, respectively). ACR-to-gene links were pre-filtered by ACRs overlapping with an element from GeneHancer regulatory elements database. b, Coverage plot of the ASAP2 region in PDAC primary cancer cells and ductal-like-2 normal cells. Genomic regions highlighted in yellow correspond to EpiMap enhancers. Zoom-in views on enhancer and promoter regions on the right side provide finer detail. Violin plot of ASAP2 RNA expression appears at far right (log2(FC) = 0.71, Wilcoxon rank-sum test two-sided p-value = 1.57−87). c, Kaplan-Meier plot of disease-free survival of TCGA PDAC patients stratified by ASAP2 high and low expression (high ASAP2, n = 30; low ASAP2, n = 38, Log Rank Test p-value < 0.001). High ASAP2 group was defined as the top 50% quantile of RNA expression and low ASAP2 as the bottom 50%. p-value was calculated using the log-rank test. d, Coverage plot showing ATAC-seq accessibility of PPARG region and enhancers linked to PPARG expression. Both linked enhancers are DACRs between primary PDAC cancer cells and pancreatic ductal-like 2 cells. Violin plot on the right side indicates PPARG RNA expression in the same cells. e, Scatter plots showing CRISPR PPARG KO effect (Y-axis) in pancreatic cancer cell lines vs PPARG expression (X-axis). Data was obtained from DepMap portal. Pearson’s correlation coefficient and its p-value are shown. f, Coverage plot showing snATAC-seq accessibility of FLNB region and enhancers linked FLNB expression. All linked enhancers are DACRs between primary PDAC cancer cells and pancreatic ductal-like2 cells. Violin plot on the right side indicates FLNB RNA expression in the same cells. g, Heatmap of ACR-to-gene links connecting regions with increased accessibility in BRCA basal cancer cells with genes with increased expression in BRCA basal cancer cells. Heatmap shows average normalized and scaled snATAC-seq and snRNA-seq values aggregated by sample for cancer cells and by cell type for normal breast cells. snATAC-based heatmap is clustered using Ward’s minimum variance method (Ward.D2 from R) and Euclidean distance, snRNA-based heatmap columns and rows follow respective snATAC-based heatmap column and row orders. Label key: dELS - distal cis-regulatory regions (CREs) with enhancer-like signatures, pELS - proximal CREs with enhancer-like signatures, PLS - CREs with promoter-like signatures. h, Coverage plot showing snATAC-seq accessibility of VEGFA region and enhancers linked to VEGFA expression. All linked enhancers are DACRs between primary BRCA basal cancer cells and luminal progenitor cells. Violin plot on the right side indicates VEGFA RNA-seq expression in the same cells. i, Coverage plot showing snATAC-seq accessibility of EN1 region and enhancers linked EN1 expression. All linked enhancers are DACRs between primary BRCA basal cancer cells and luminal progenitor cells. Violin plot on the right side indicates EN1 RNA-seq expression in the same cells.
Extended Data Fig. 6
Extended Data Fig. 6. Tissue- and cancer cell-specific regulons.
a, Schematic showing regulons identified using SCENIC across 11 cancer types (Methods). b, Box plots showing regulon activity scores and TF motif accessibility scores for KLF3, GLI2, and FOXL1 in primary PDAC cancer cells (n = 2,211 for regulon activity; n = 30,428 for TF motif) and normal pancreas ductal-like 2 cells (Ductal-like 2 n = 744 for regulon activity; n = 1,652 for TF motif). c, Box plots showing regulon activity scores and TF motif accessibility scores for FOSL1 in PDAC (n = 2,211) increase compared to those in squamous cancers (CESC n = 2,200; HNSCC n = 3,462) and normal squamous cells (n = 143). d, Box plots showing GATA6 regulon activity scores decreasing in CRC (n = 446), PDAC (n = 2,211), OV (n = 1,400), and UCEC (n = 800) cancer cells compared to respective CNCs (Distal stem cells n = 184; Ductal-like 2 n = 744; Secretory endometrial cells n = 202). In the b-d box plots for cancer cells are coloured by cancer types. Wilcoxon rank-sum test FDR adjusted two-sided p-values are shown (Supplementary Table S4c, e). Box plot center line corresponds to the median, the lower and upper hinges correspond to the first and third quartiles. The upper or lower whiskers extend from the hinge to the largest or the lowest value no further than 1.5*IQR from the hinge (where IQR is the inter-quartile range). e, Bubble plot showing pathway enrichment in target genes of tissue and cancer cell-specific regulons. Target genes were filtered out by tissue/cancer cell-specific DEGs in the respective cancer type (Supplementary Table 2b).
Extended Data Fig. 7
Extended Data Fig. 7. Regulon target genes validation.
a, Bar plot summarizing the proportion of target gene promoters (within upstream and downstream 5 kb of TSS) that overlap with TF-specific ChIP-seq peaks for 53 TFs identified in Fig. 3a. Each bar represents a different TF, with the height of the bar indicating the proportion of target gene promoters that overlap with ChIP-seq peaks. The proportion is expressed as a percentage on the y-axis. b, TSS plots showing the presence of aggregated ChIP-seq peaks (ENCODE) and snATAC-seq peaks of target genes. c, TSS plots showing the presence of ChIP-seq peaks (ENCODE) from the corresponding biosamples, snATAC-seq peaks, and CUT&RUN peaks for CTCF’s target genes in CAKI (left), MCF-7 (middle), and U251 (right) cell lines.
Extended Data Fig. 8
Extended Data Fig. 8. snATAC-seq based differences between primary and metastatic cancer cells.
a, Heatmap showing top 200 up-regulated DACRs associated with the transition from primary to metastasis across four cancer types. Labels on the X-axis show the nearest genes to DACRs which also have significantly up-regulated gene expression in metastatic samples compared to primary tumour samples based on snRNA-seq data. For each sample (rows) peak accessibility was calculated as average across its cancer cells. b, Pie-charts showing contribution of primary cancer cells, metastatic cancer cells, and normal epithelial cells to each cluster of case-level objects (see Methods) from 5 UCEC and 4 CRC cases. c, Pearson correlation coefficient heatmap computed based on TF motif scores averaged per cluster and per sample, showing that cancer cells from the same cluster tend to be similar by their TF score profiles.
Extended Data Fig. 9
Extended Data Fig. 9. Pseudotime trajectories of UCEC and CRC cases, and significant pathways enriched in ACRs associated with pseudotime.
a-g, Plots of trajectories found by Slingshot for 3 CRC (a-c) and 4 UCEC (d-g) cases coloured by cell type. Each case (except for CM1563C and CPT2373DU) is plotted using Between Cluster Analysis (BCA, a novel supervised dimensionality reduction method) and visualized on the first two between cluster components (BCCs). Cases CM1563C and CPT2373DU, which have only two cell types as well as two or less case clusters, were visualized with the second and third LSI components instead. Each trajectory starts from the normal cell type if available; otherwise, it starts from the primary tumour cell type. h, Bubble plot of significant pathways enriched in ACRs significantly associated with pseudotime (from normal to primary cancer cells, and then to metastatic cancer cells). The significant ACRs were found by regressing them against pseudotime using lasso regression.
Extended Data Fig. 10
Extended Data Fig. 10. Summary of somatic drivers, druggable targets, and prognostic significance.
a, Summary heatmap showing the landscape of genetic drivers (i.e., somatic mutations, CNVs) and clinical annotation for the samples with bulk WES available in this cohort (n = 176). b, Dotplot showing DACRs between TP53 missense mutant samples and TP53 WT, or between TP53 truncation mutants and TP53 WT in BRCA, using sample-level snATAC-seq ACRs accessibilities. For this analysis we used only ACRs that were supported by TP53 ChIP-seq obtained from ENCODE and that also contained a TP53 binding motif. Dot size corresponds to two-sided Wilcoxon rank-sum test FDR adjusted p-values. c, The Kaplan-Meier plots and analysis of progression-free survival in TCGA-GBM cohort stratified by BACH2 regulon activity (left) and in TCGA-CRC stratified by E2F8 regulon activity (right). Error bands represent 95% confidence intervals; two-sided p-values by the log-rank (Mantel–Cox) test are indicated; n is specified for each patient subgroup; high and low regulon activity groups are defined based on values above and below the median, respectively. d, A forest plot showing the hazard ratio (X-axis, the center of error bars) and 95% confidence intervals (error bars) associated with regulons and HPV status (Y-axis) identified by multiple Cox proportional-hazards models with overall survival adjusted for age and sex in TCGA-HNSCC cohort. Cox proportional hazards model two-sided p-values are shown; high and low regulon activity groups are defined based on values above and below the median, respectively. e, Bubble plot showing druggable targets as annotated in CIViC database found by DACR analysis between primary cancer cells and corresponding CNCs. Each dot is one DACR. X-axis shows the nearest gene. f, Bubble plot showing druggable targets as annotated in CIViC database found by DEG analysis between primary cancer cells and corresponding CNCs. Each dot is one DEG.

References

    1. Stadhouders R, Filion GJ, Graf T. Transcription factors and 3D genome conformation in cell-fate decisions. Nature. 2019;569:345–354. doi: 10.1038/s41586-019-1182-7. - DOI - PubMed
    1. Esteller M. Epigenetics in cancer. N. Engl. J. Med. 2008;358:1148–1159. doi: 10.1056/NEJMra072067. - DOI - PubMed
    1. Butera A, Melino G, Amelio I. Epigenetic “drivers” of cancer. J. Mol. Biol. 2021;433:167094. doi: 10.1016/j.jmb.2021.167094. - DOI - PubMed
    1. Alonso-Curbelo D, et al. A gene–environment-induced epigenetic program initiates tumorigenesis. Nature. 2021;590:642–648. doi: 10.1038/s41586-020-03147-x. - DOI - PMC - PubMed
    1. Buenrostro JD, Giresi PG, Zaba LC, Chang HY, Greenleaf WJ. Transposition of native chromatin for fast and sensitive epigenomic profiling of open chromatin, DNA-binding proteins and nucleosome position. Nat. Methods. 2013;10:1213–1218. doi: 10.1038/nmeth.2688. - DOI - PMC - PubMed

Publication types

MeSH terms