. 2023 Nov;623(7988):853-862.
doi: 10.1038/s41586-023-06691-4. Epub 2023 Nov 1.

Cryo-EM structure of the human cardiac myosin filament

Affiliations

Cryo-EM structure of the human cardiac myosin filament

Debabrata Dutta et al. Nature. 2023 Nov.

Abstract

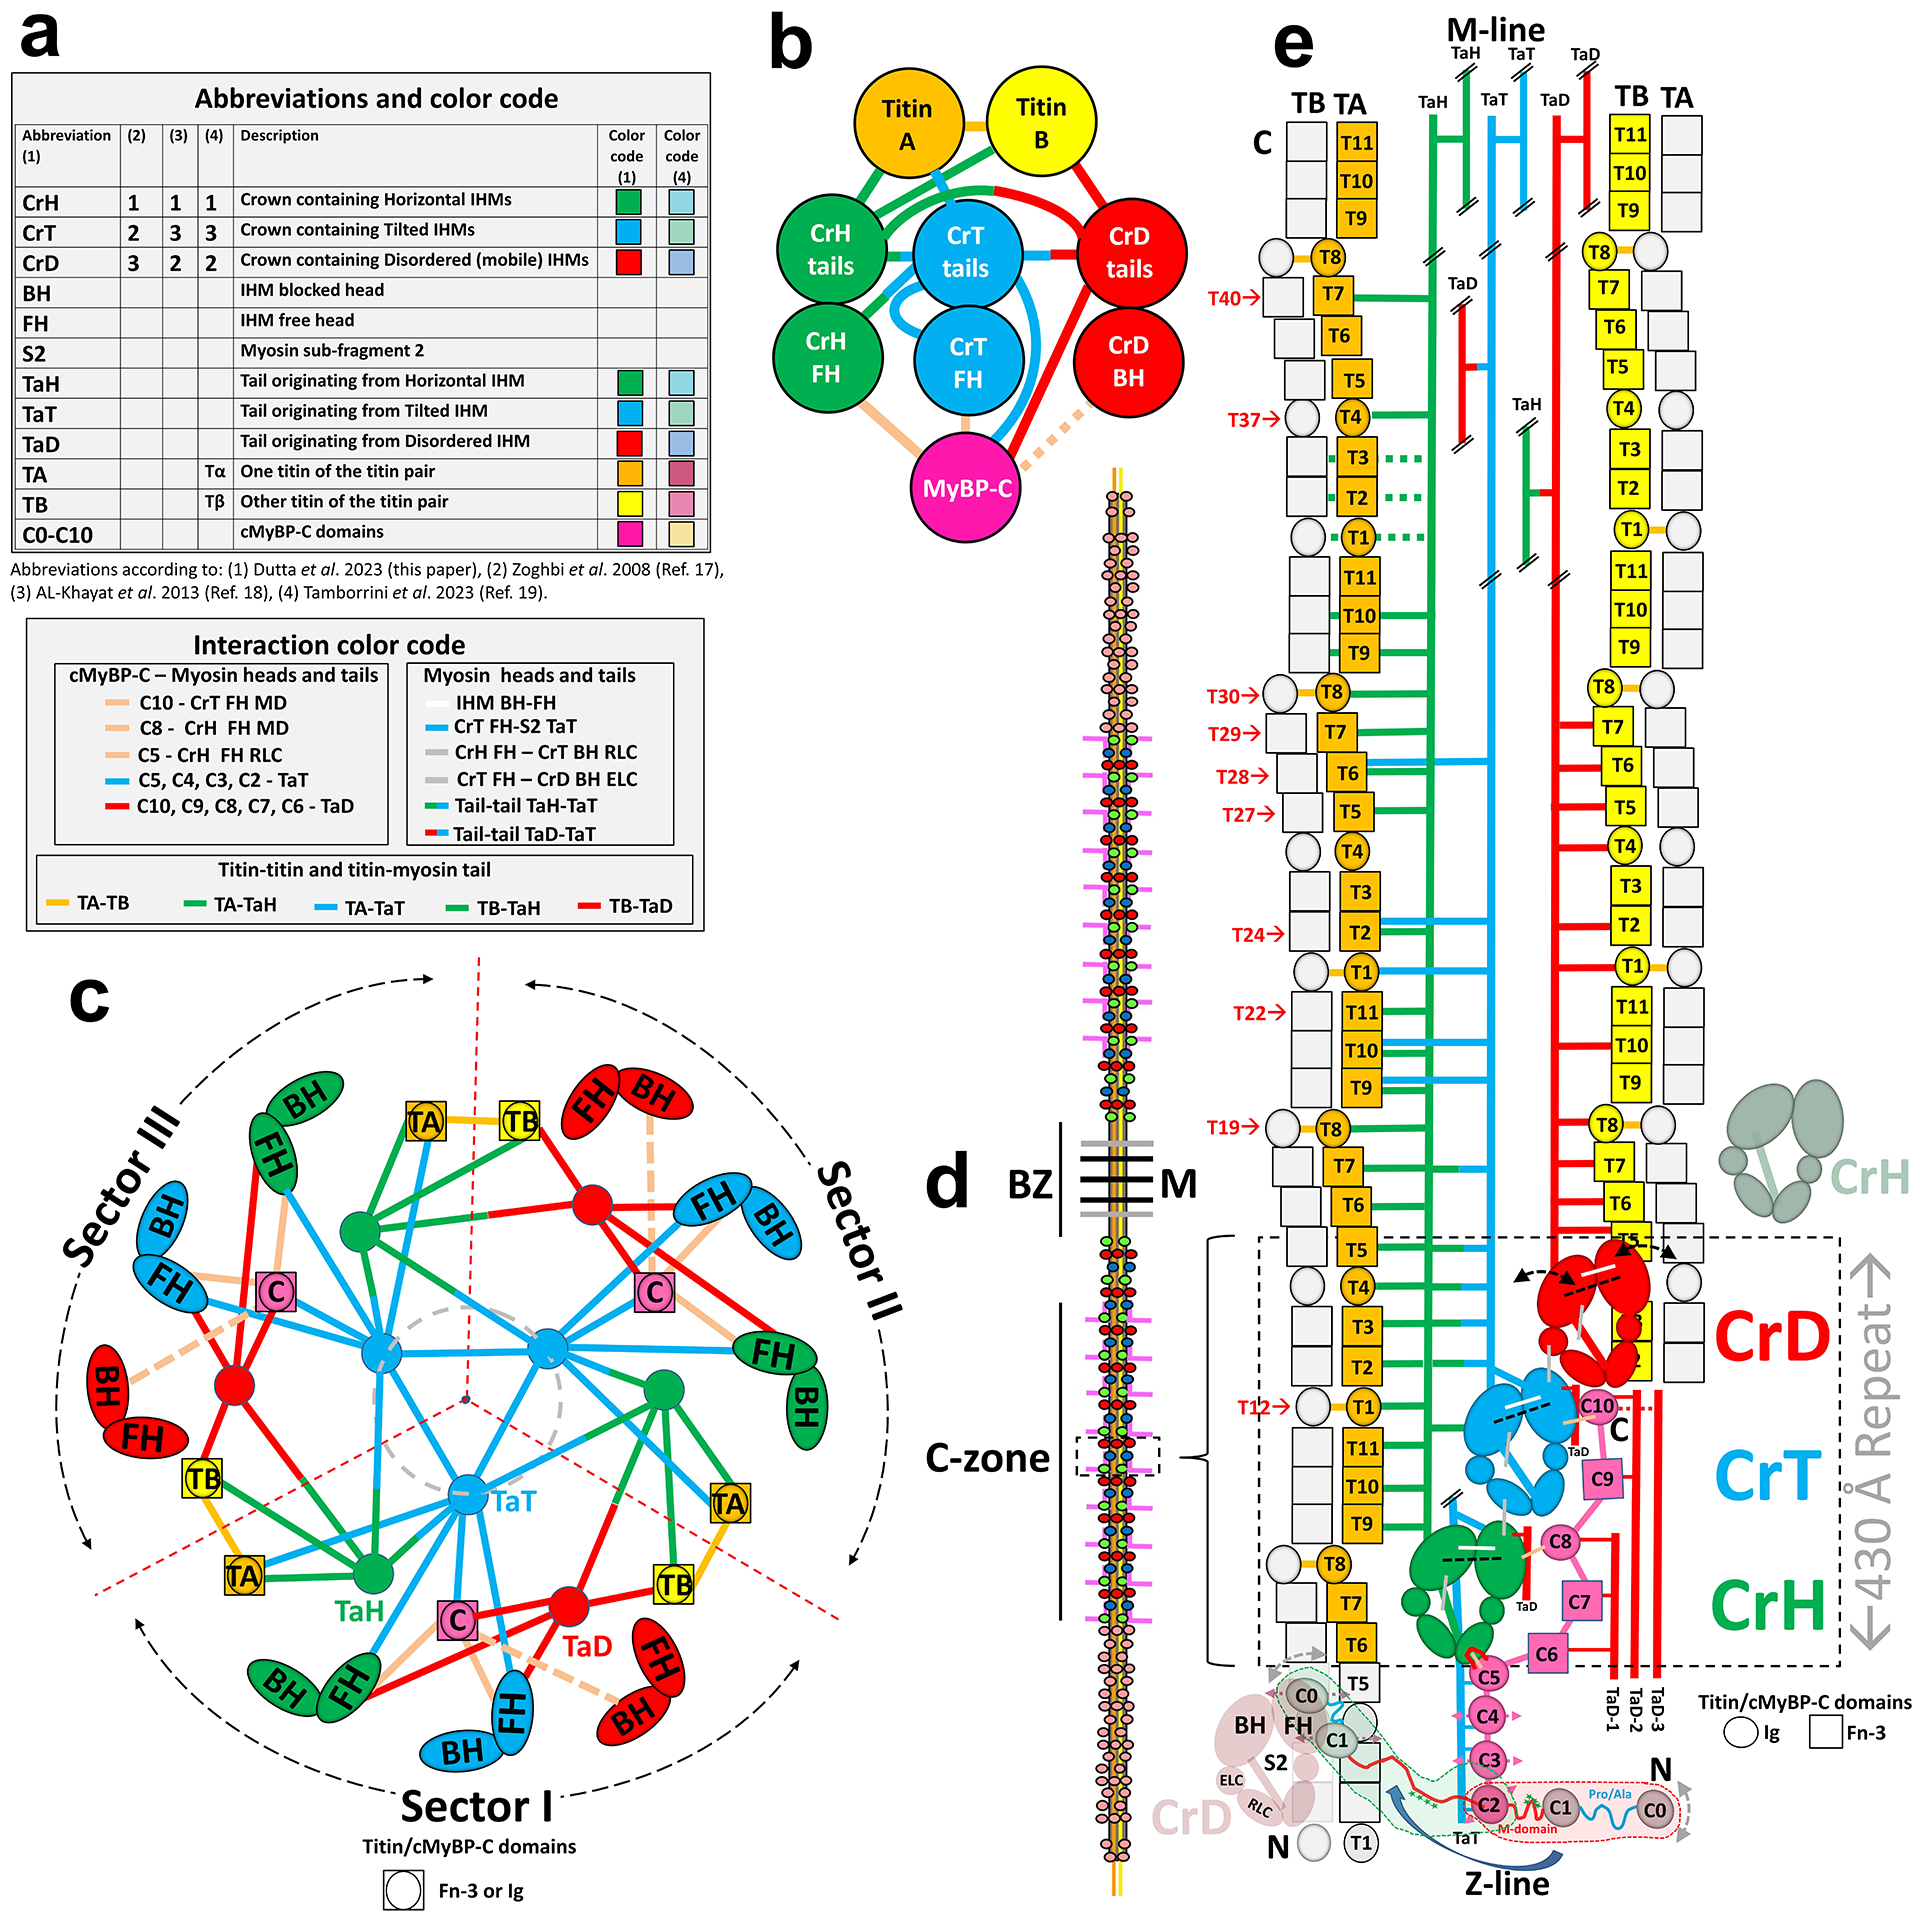
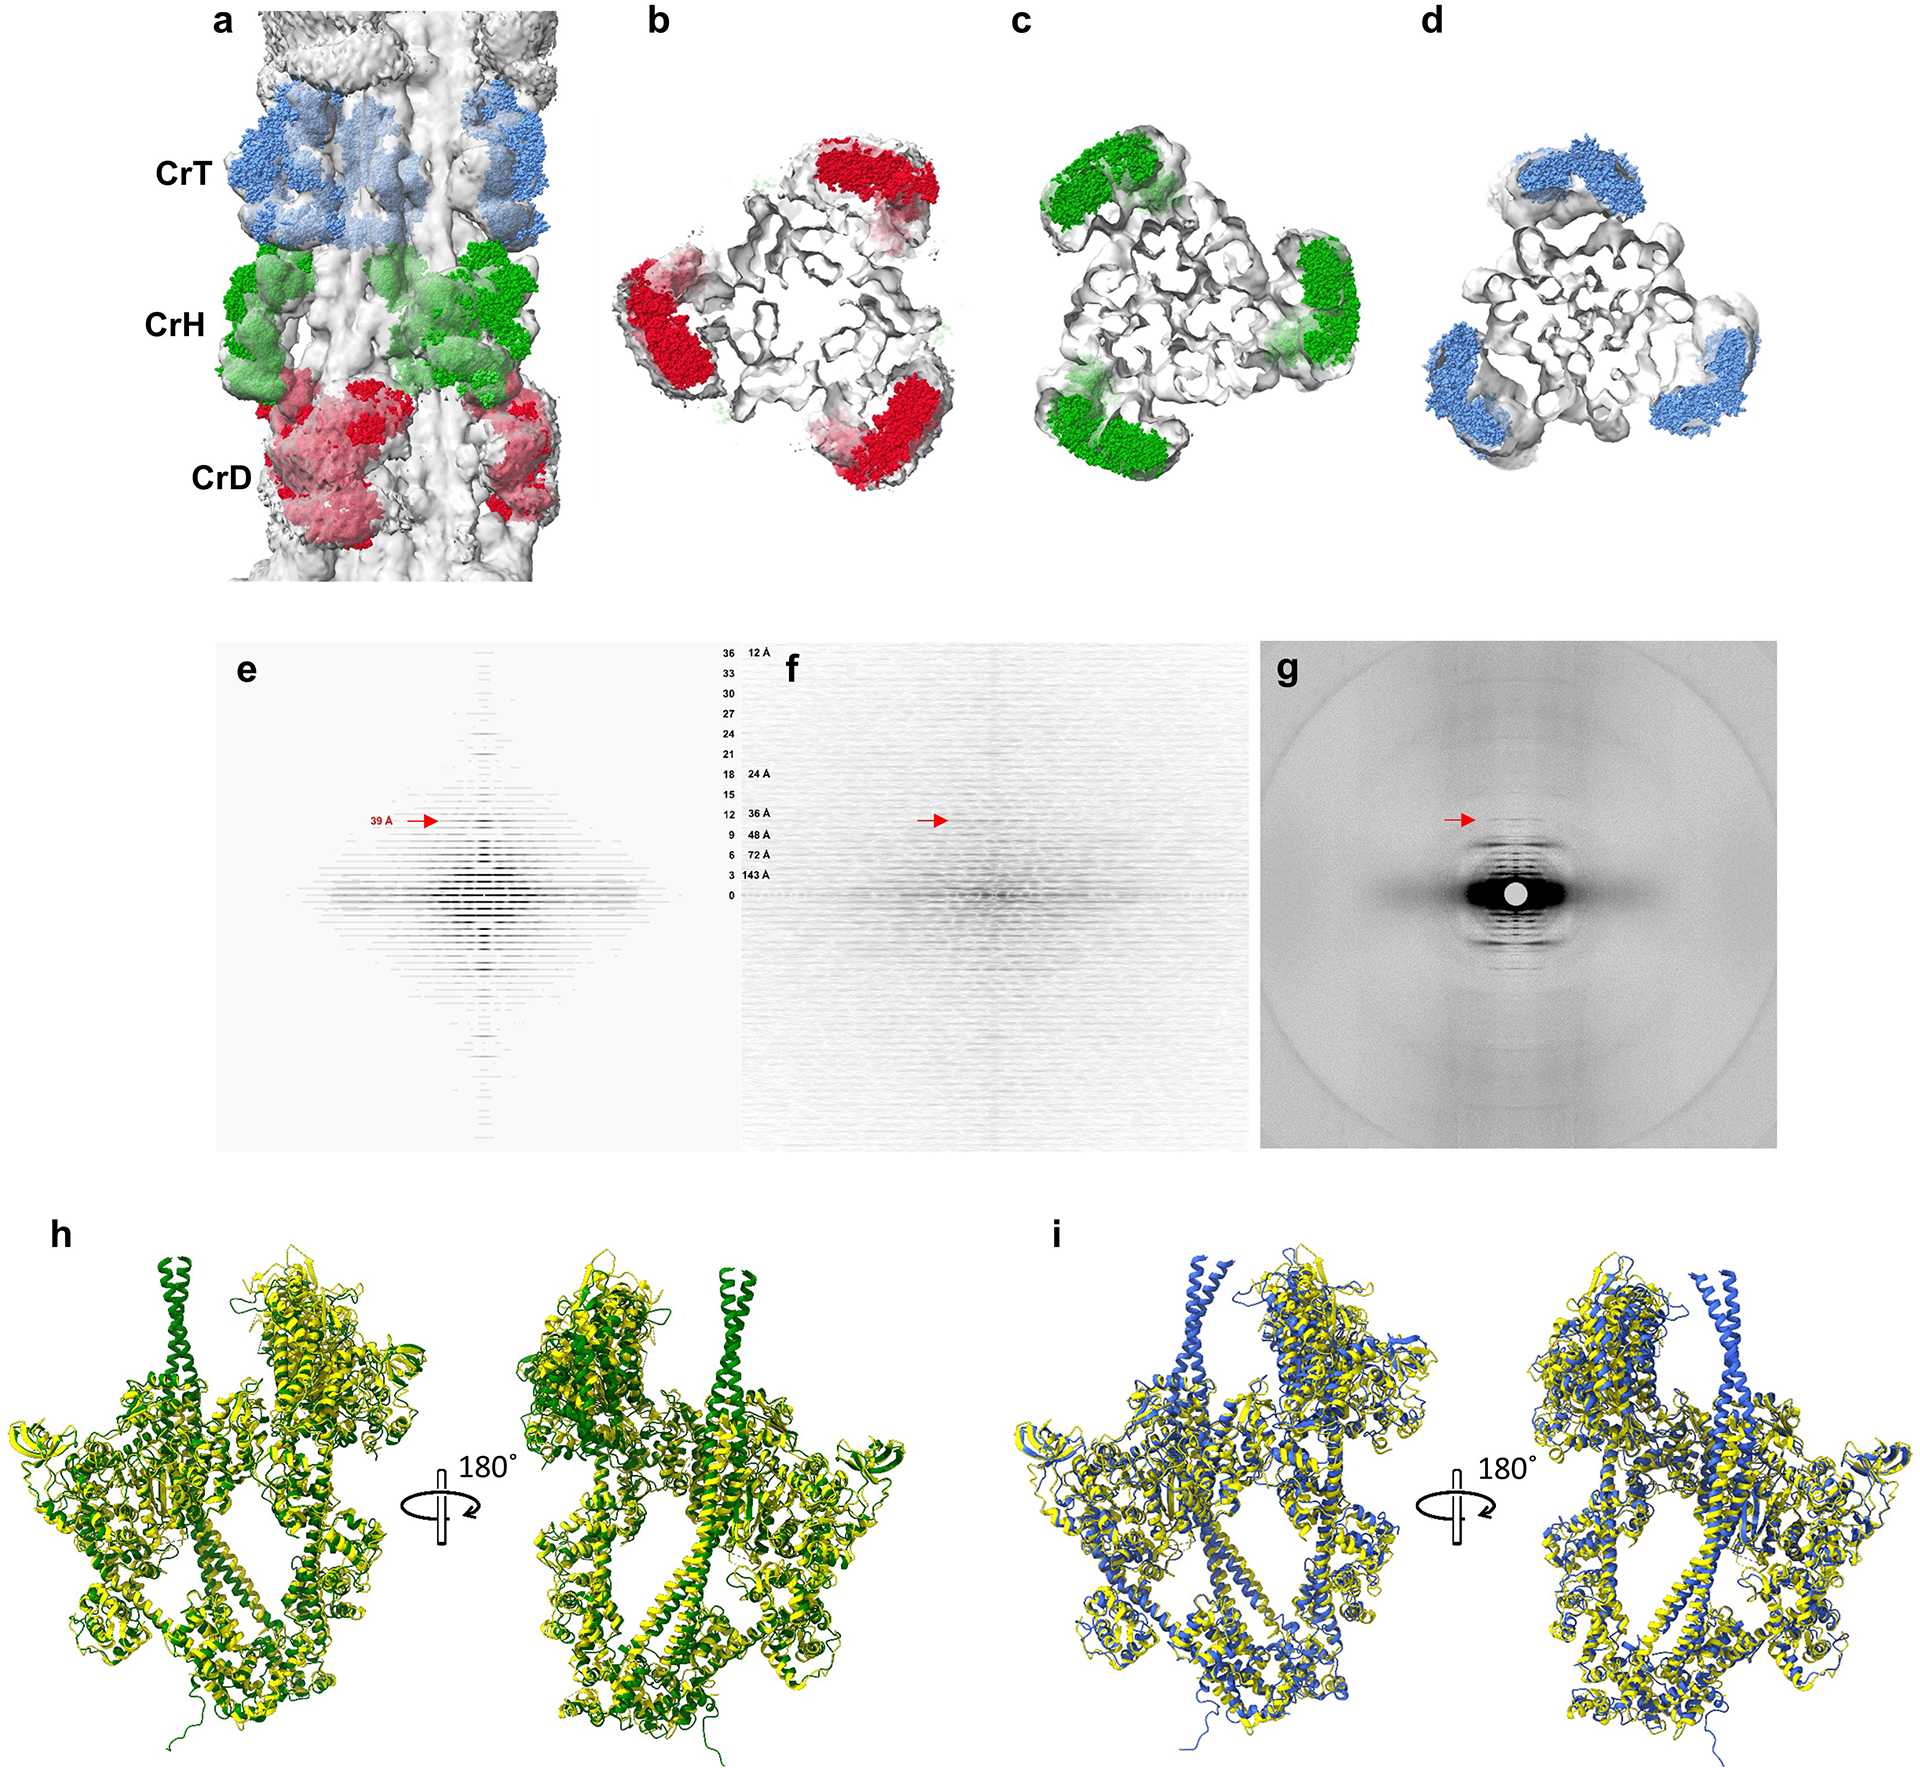
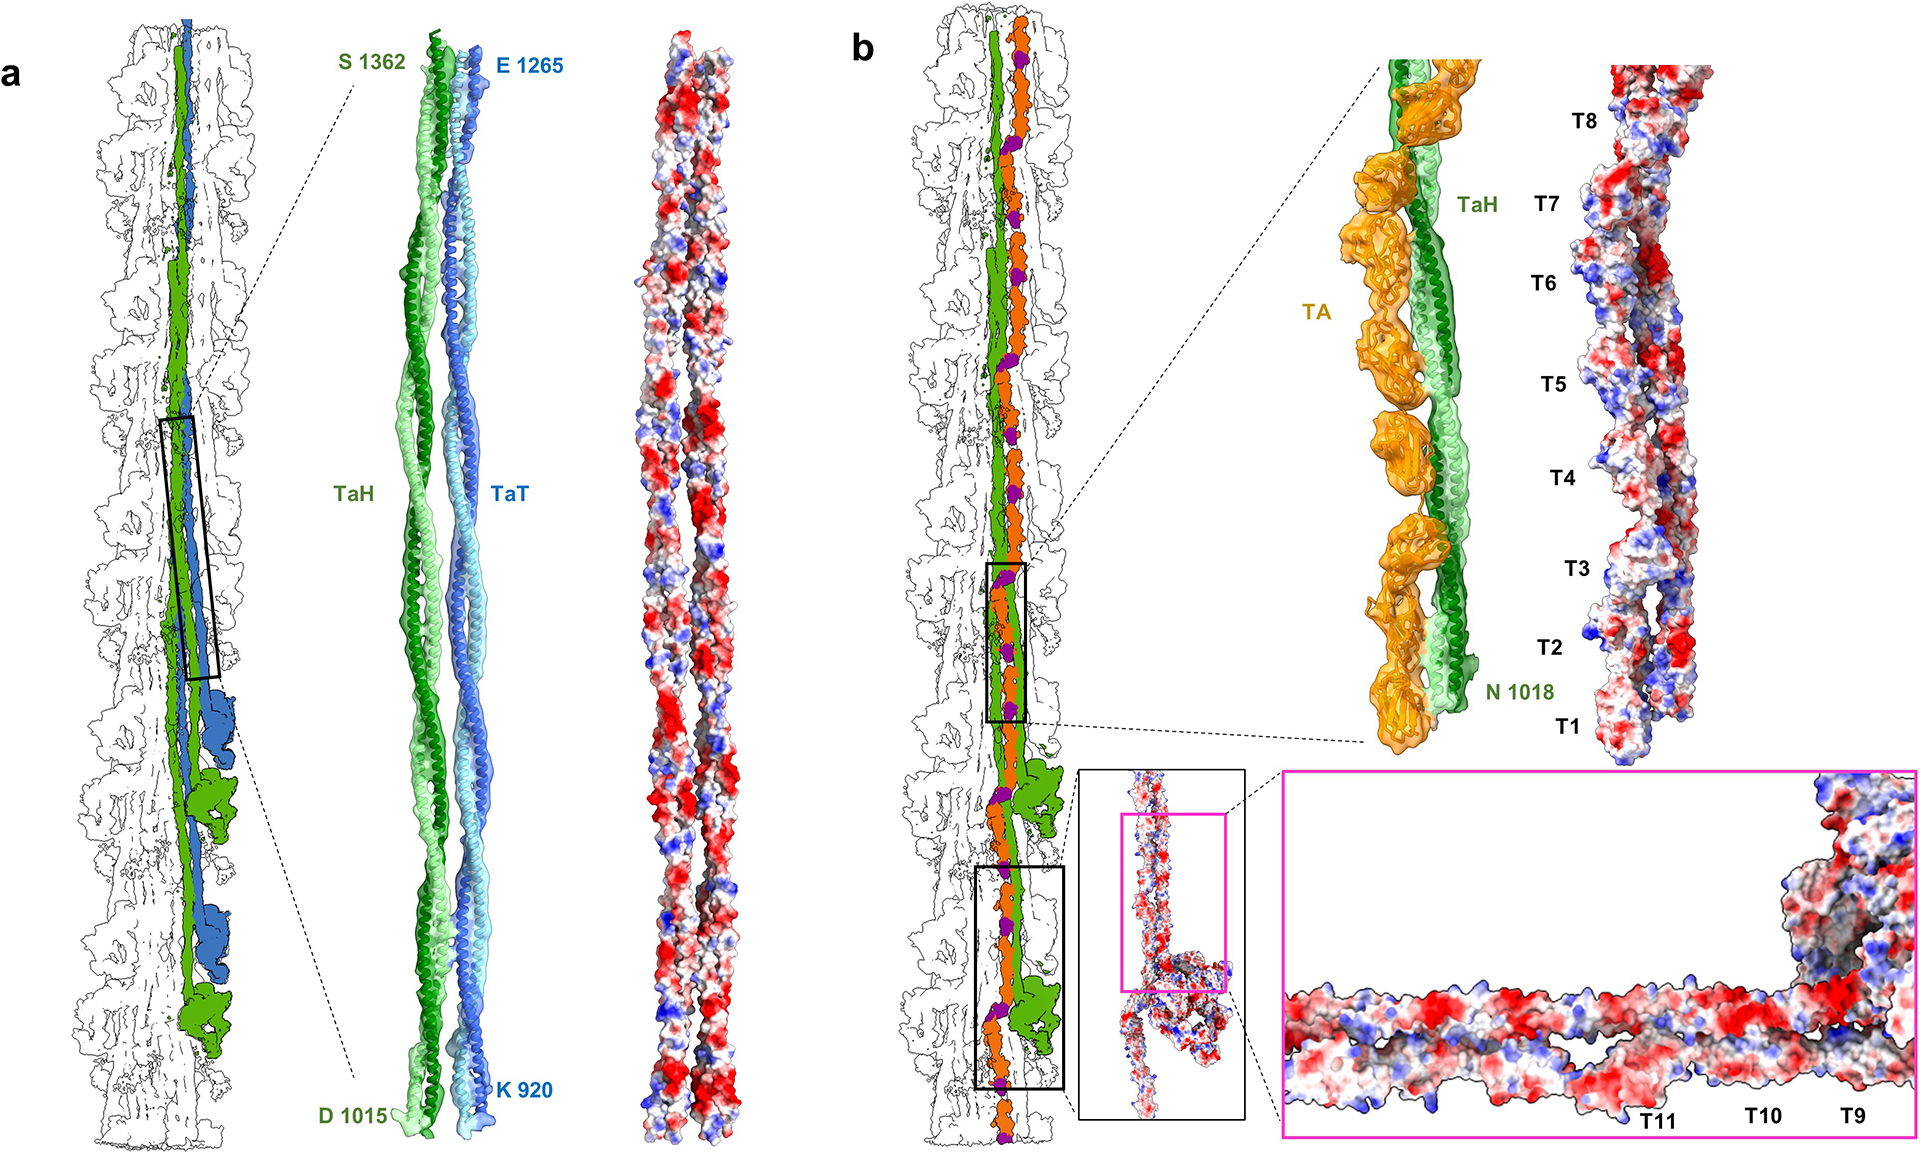
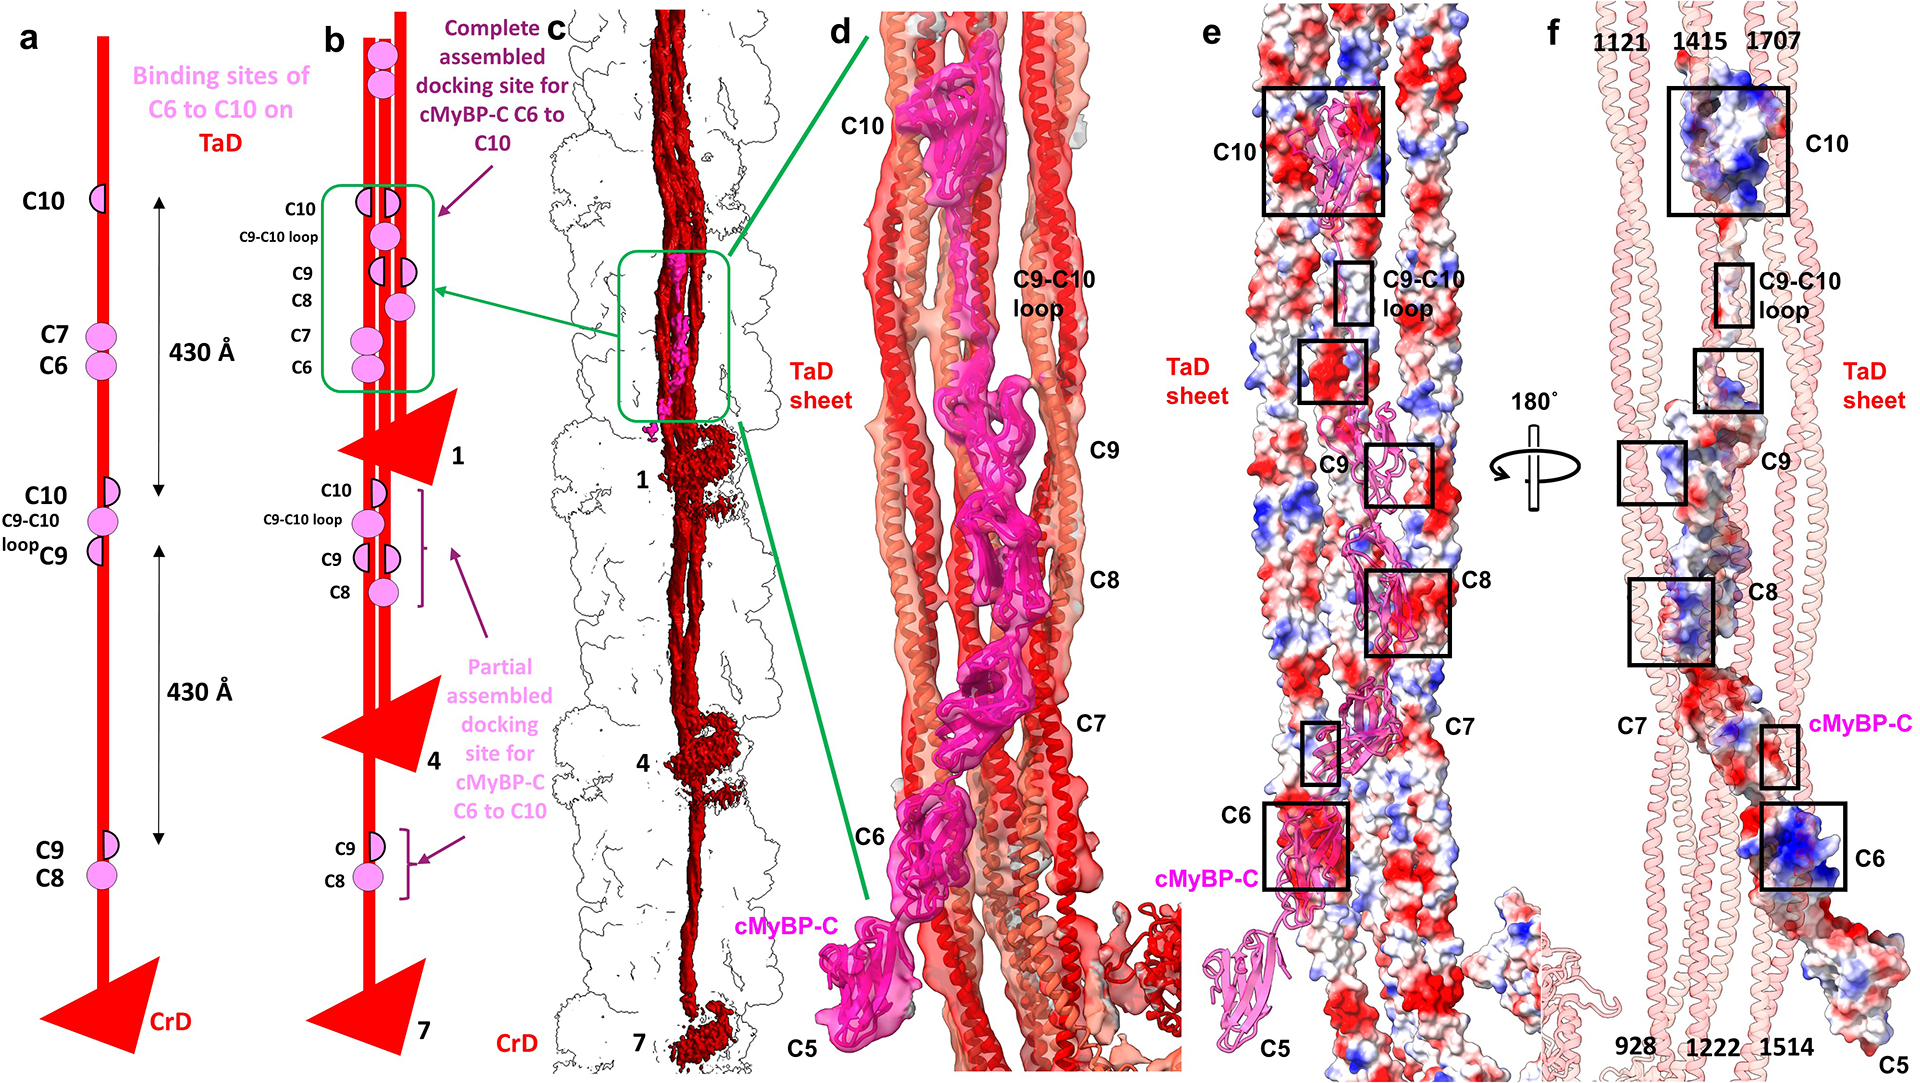
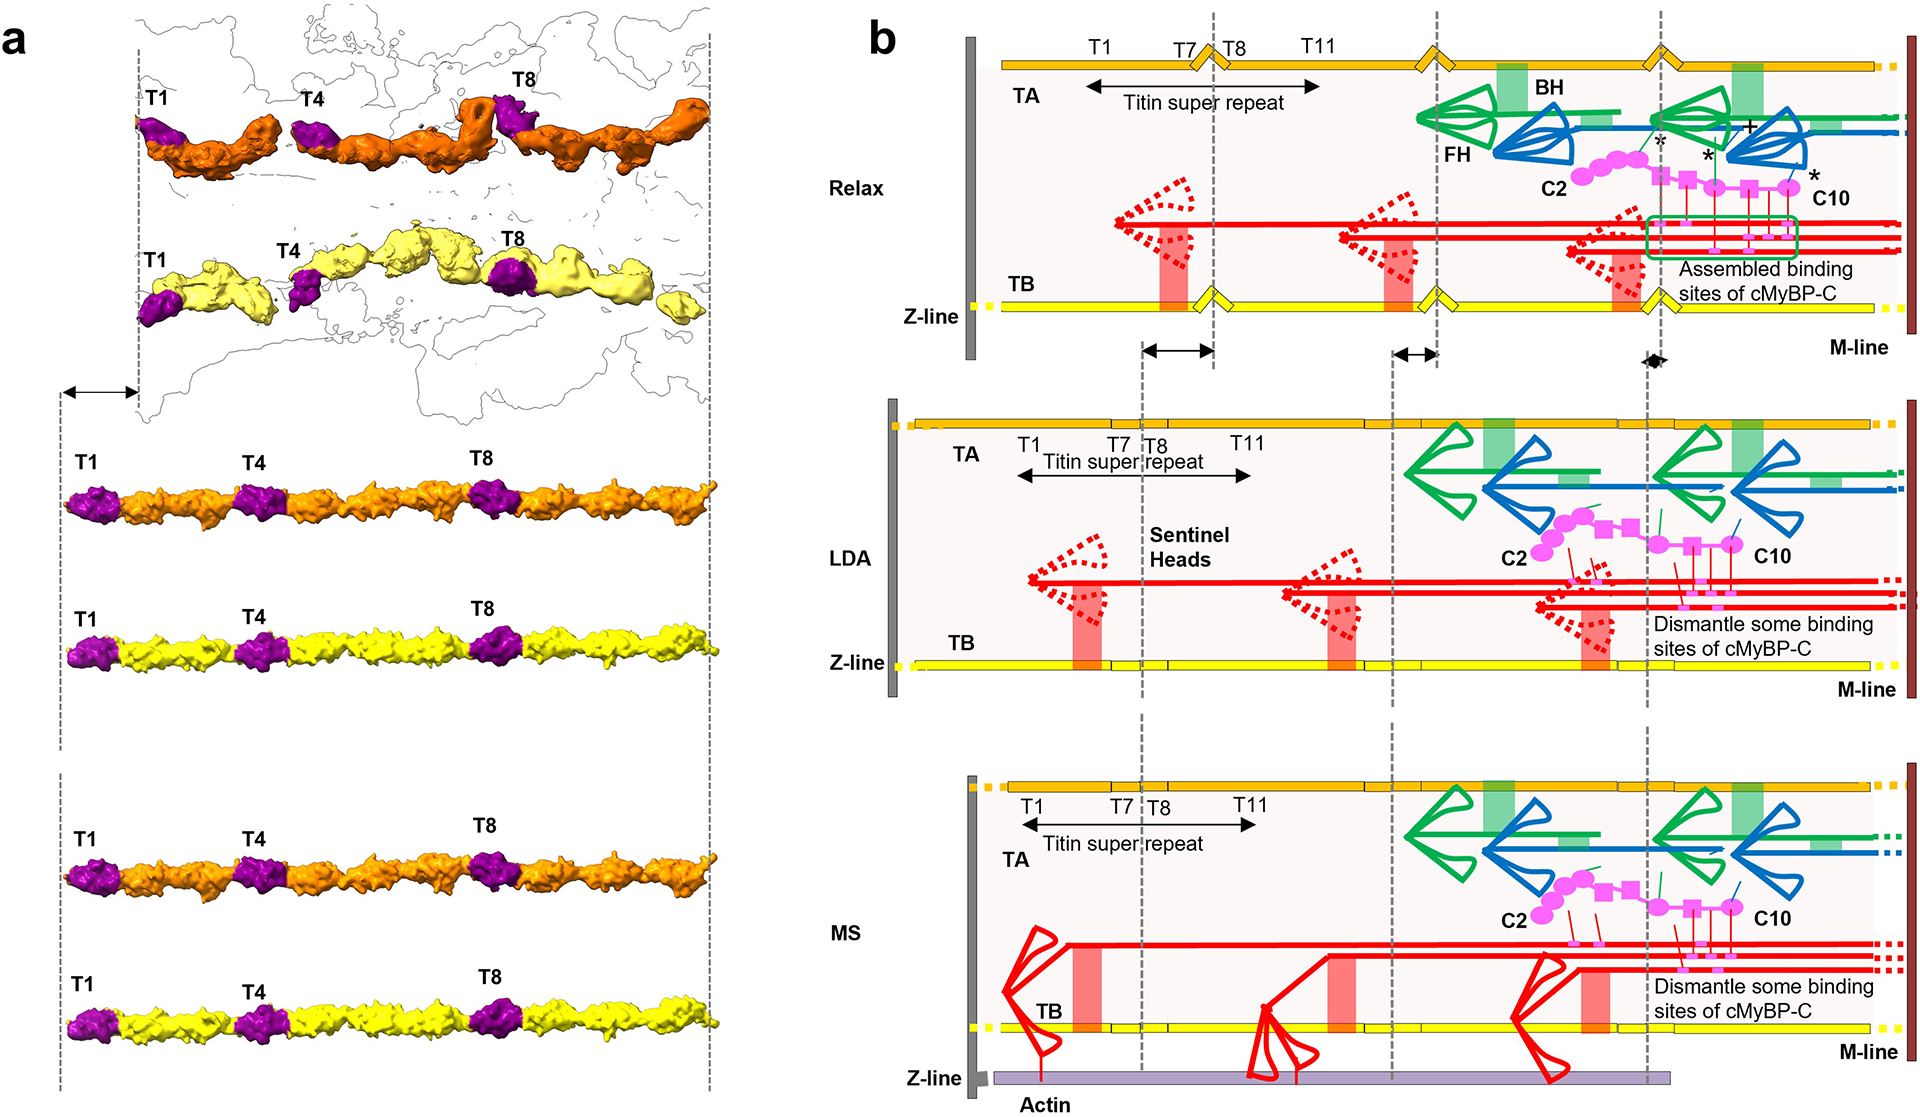
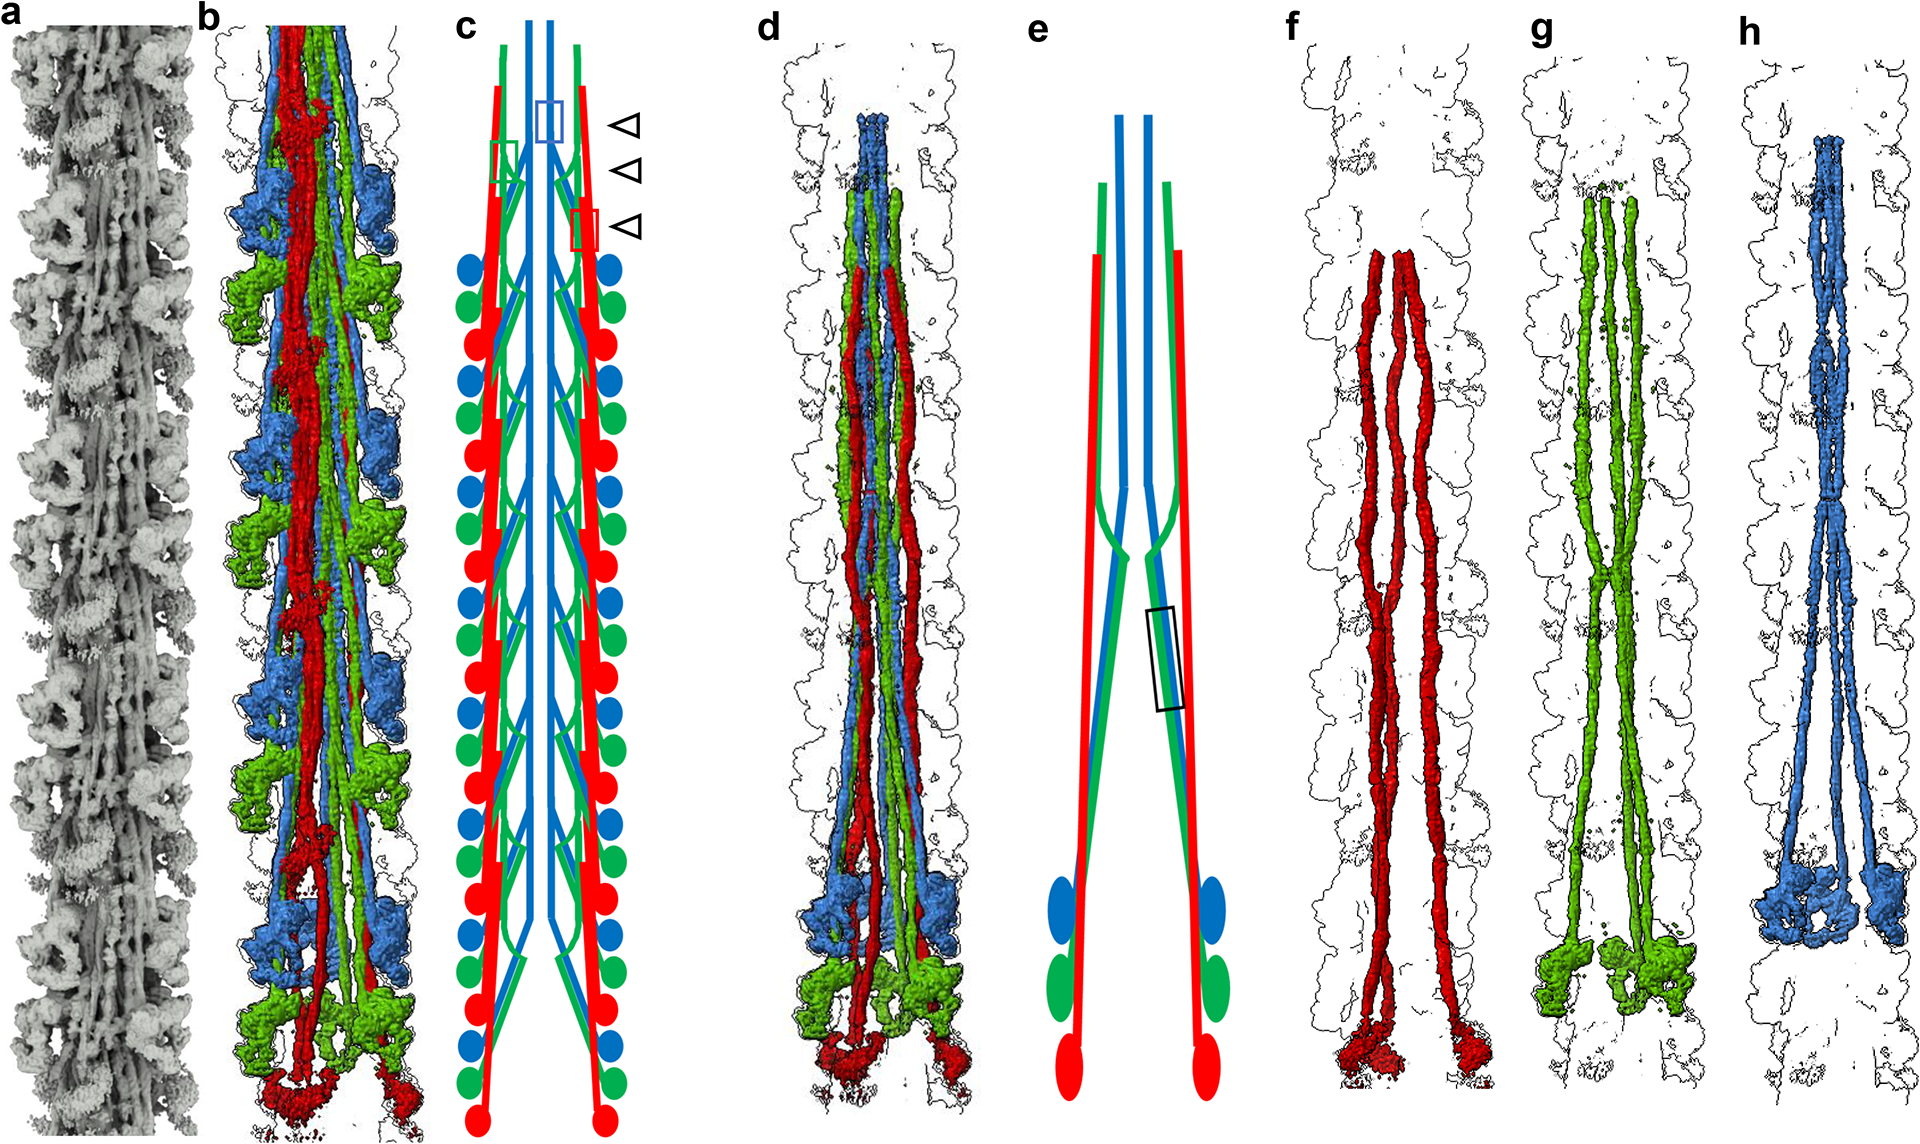
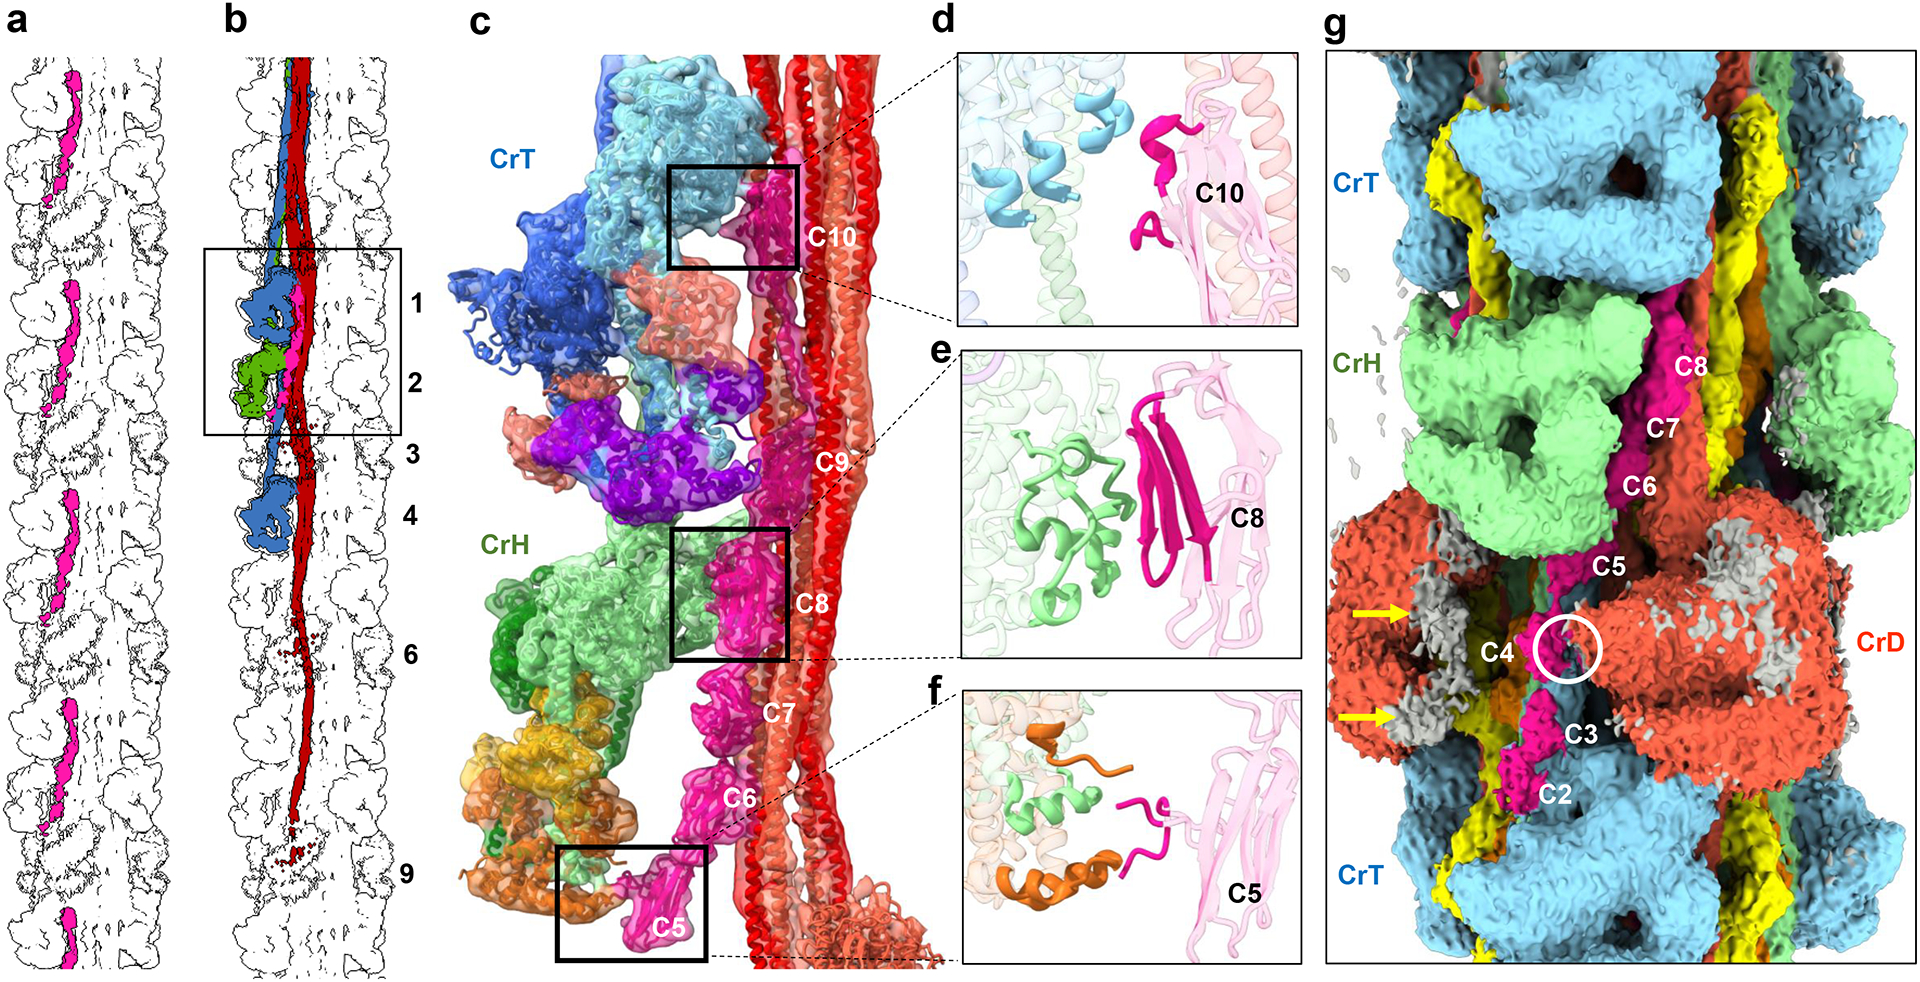
Pumping of the heart is powered by filaments of the motor protein myosin that pull on actin filaments to generate cardiac contraction. In addition to myosin, the filaments contain cardiac myosin-binding protein C (cMyBP-C), which modulates contractility in response to physiological stimuli, and titin, which functions as a scaffold for filament assembly1. Myosin, cMyBP-C and titin are all subject to mutation, which can lead to heart failure. Despite the central importance of cardiac myosin filaments to life, their molecular structure has remained a mystery for 60 years2. Here we solve the structure of the main (cMyBP-C-containing) region of the human cardiac filament using cryo-electron microscopy. The reconstruction reveals the architecture of titin and cMyBP-C and shows how myosin's motor domains (heads) form three different types of motif (providing functional flexibility), which interact with each other and with titin and cMyBP-C to dictate filament architecture and function. The packing of myosin tails in the filament backbone is also resolved. The structure suggests how cMyBP-C helps to generate the cardiac super-relaxed state3; how titin and cMyBP-C may contribute to length-dependent activation4; and how mutations in myosin and cMyBP-C might disturb interactions, causing disease5,6. The reconstruction resolves past uncertainties and integrates previous data on cardiac muscle structure and function. It provides a new paradigm for interpreting structural, physiological and clinical observations, and for the design of potential therapeutic drugs.


Conflict of interest statement

Competing interests

The authors declare no competing interests.

Figures

Extended Data Fig. 1.
Extended Data Fig. 1.. Cryo-EM imaging and data processing.
a, Cryo-EM image of human cardiac thick filament. b, 2D-class averages of 5-crown-long segments of C-zone. c, Enlargement of 2D class average. Two IHMs (CrH and CrT) show strong density while the other (CrD) is fuzzy, indicating mobility. d, 2D class average of M-line region, included in some images (3D reconstruction to be published separately). e, f, The two 5-crown reconstructions of the C-zone produced by cryoSPARC (see Methods), showing local resolution (colored maps, with resolution scale in Å at bottom), global resolution estimate (gold standard Fourier shell correlation (GSFSC) curves, upper), and heat maps of angles of view of particles used in the reconstruction (lower). The local resolution maps show best resolution in the central 3 crowns; disorder in CrD is indicated by its lower resolution (red) compared with CrH and CrT. Analysis of the maps (see text) shows highest resolution (blue) where interactions occur between components, which would stabilize these regions. The heat maps show a good distribution of angles of view. Most particles are close to in-plane (elevation axis), due to extended, relatively rigid nature of the thick filament, while all rotations about the filament axis are included, with a small preferred-orientation every 120° (darker patches along azimuth axis). Reproducibility: 56,489 movies collected from three different human heart samples were used for data processing. Four imaging sessions were carried out, on two different microscopes at different accelerating voltages. The first dataset, from sample 1, on a Talos Arctica, produced a reconstruction at 7.9 Å resolution. The second, third and fourth datasets, from new sets of grids (Sample 1 and two additional samples), were on a Titan Krios, and combined produced a 6 Å resolution reconstruction. The latter reconstruction reproduced the former, but with more detail. Two individual Krios datasets processed separately also produced the same reconstruction. Particle picking for the reconstructions was automated (see Methods). We assume that the particles originate from the C-zone because: 1. The C-zone is the longest head-bearing region of each half-filament and therefore will be the source of most particles. 2. The reconstructions are fully compatible with C-zone reconstructions where particles were user-selected from the C-zone,. 3. The reconstructions show an extended molecule that can only be interpreted as cMyBP-C. 4. The titin strands in the reconstruction exhibit an 11-domain super-repeat, providing strong evidence that the particles contributing to the structure come from the C-zone, while D-zone particles, with their shorter, 7-domain titin repeat, have been excluded.
Extended Data Fig. 2.
Extended Data Fig. 2.. Abbreviations and overview of interactions in 3D reconstruction.
a, Abbreviations and color coding used to describe reconstruction and interactions in the thick filament. Top table shows correspondence between nomenclature and color coding used in this paper and that used in the accompanying manuscript by Tamborrini et al. b, Interaction network between titin, myosin (heads and tails), and cMyBP-C. (1) titins (TA, TB) interact with each other (at 2 points only), with CrH and CrT tails (TA), and with CrH and CrD tails (TB), but not with cMyBP-C. (2) cMyBP-C interacts with CrH and CrT FHs, and possibly with CrD BH, with CrT and CrD tails, but not with titin. (3) all tails interact with each other (TaH-TaT, TaT-TaD, TaH-TaD) and with themselves (TaH-TaH, TaT-TaT, TaD-TaD). Neither titin, cMyBP-C, nor myosin (heads or tails) hold the thick filament together alone; instead, all orchestrate its interacting, asymmetric structure. c. Cartoon showing interactions in the reconstruction viewed transversely towards the Z-line, exhibiting three equivalent radial sectors I-III. Due to 3-fold symmetry, the positions of the dividing dotted red lines between sectors are arbitrary. We have chosen them to produce a division in which most interactions occur within a sector, and few between sectors (ED Fig. 4a). The sectors thus defined may correspond to the 3 subfilaments into which vertebrate thick filaments fray at low ionic strength, as these would break the fewest interactions. Only two interactions, between titins TB and TA, in neighboring sectors, would be broken, at T1 and T8. Note how TB and TA pairs from adjoining sectors are nicely accommodated in the space between CrH and CrD IHMs (see also Fig. 1c, d). The structure suggests that when filaments are synthesized in the cell, three pre-formed sectors could assemble into a filament when TB and TA strands of different sectors zip together establishing the T1 and T8 interactions (Supplementary Discussion). A central core (gray, dashed circle) contains only CrT tails, interacting with themselves. d, Cartoon of full-length thick filament showing P-, C- and D-zones, bare zone (BZ) and M-line. Red, green and blue spheres represent CrD, CrH and CrT IHMs in 430-Å-long triplets (dotted box). Titin strands (yellow, orange) extend along filament. cMyBP-C (pink) extends longitudinally for part of its length, then projects out. e, Cartoon showing interactions in sector I of the reconstruction, as viewed from the bottom of c (i.e. from outside the filament). CrD, CrT and CrH IHMs comprise a single 430-Å-long triplet within the sector (dashed rectangle), with CrD and CrH from triplets of adjacent sectors (pale red and green ghosts) also shown. The dashed black lines in the three colored IHMs denote the tilted angles of the CrD and CrT IHMs compared with the untilted (horizontal) IHM in CrH (tilt axis is a radial line extending from the filament axis through the center of the IHM). CrD heads are dynamically disordered/mobile (curved double-arrows). In the reconstruction, cMyBP-C C5–C10 domains exhibit strong densities, while C2–C4 and C0-M, which are mobile, exhibit weaker (C2–C4, straight pink double arrows) or much weaker (C0-M; gray, curved double-arrows) densities, C0-M possibly docking intermittently on the CrD FH (green dotted fragment). In the sarcomere, the mobile C0-M domains may detach from the thick filament, extending out and binding to the thin filament (red dotted fragment). Double oblique lines in tails indicate that only partial tails are shown. Red numbers of titin domains refer to the numbering in Fig. 4.
Extended Data Fig. 3.
Extended Data Fig. 3.. Validation of reconstruction.
a-d, We compared our reconstruction with X-ray diffraction data, which provide information on filament structure in the lattice of intact muscle. a, Longitudinal, and b-d, transverse views of our cardiac thick filament reconstruction at the 3 crowns in the 430 Å repeat (gray map), fitted with thick filament atomic model (CrH, green; CrT, blue; CrD, red) based on X-ray diffraction data combined with previous negative stain reconstructions,. The excellent fit of the X-ray model to the cryo-EM map, especially the radial positioning of the heads (center-of-mass ~135 Å from the filament axis), suggests that the reconstruction is close to the structure in intact muscle, and strongly supports its validity. The previous negative stain reconstructions had suggested a head center-of-mass at ~95 Å radius (~40 Å less than the cryo-reconstruction), thought to be due to radial collapse of heads during drying of negative stain—not an issue with frozen-hydrated specimens. e-f, We also compared an averaged power spectrum of the reconstruction (rotated at intervals of 10° from 0 to 110°) (e) with an averaged power spectrum of selected filaments used in the reconstruction (f). The similarity of the two power spectra, both extending to the 36th order of the 430 Å repeat (12 Å), supports the validity of the reconstruction. g, Wide-angle X-ray diffraction pattern of intact, relaxed porcine cardiac muscle at same scale (courtesy of Drs. Tom Irving and Weikang Ma, unpublished data) shows similar myosin layer lines at low angles, further suggesting that our structure is similar to that in intact muscle. A key feature of all patterns is the prominent 39 Å reflection (11th order of 430 Å, red arrows). Previous X-ray studies have suggested that this may be due to titin. Our reconstruction reveals titin unambiguously (see text and ED Fig. 5), and we show that the reflection arises from the kinking of its elongated structure, allowing 11 domains to fit into the 430 Å repeat (ED Fig. 6c). h, i. We also compared our native filament IHMs (CrH and CrT) with the cryo-EM structure of a recombinant IHM containing 15 heptads of tail (PDB 8ACT). 8ACT (yellow) was superimposed on CrH (green) and CrT (blue) (h, i, respectively). Superposition was performed by matching BHs (Matchmaker in ChimeraX) to reveal how the FH is positioned with respect to the BH in each case. The 3 different IHMs showed strong similarity. However, the two filament IHMs are non-identical (Fig. 2h), due to different interactions with cMyBP-C and the backbone in the environment of the native filament (Fig. 5c–f, Fig. 6g–m). Although the fit of 8ACT to the filament IHMs was not perfect, its individual blocked and free heads showed excellent correspondence to the respective CrT and CrH heads. CrH BH and 8ACT BH RMSD between 618 pruned atom pairs was 1.179 Å, and across all 867 pairs was 2.148 Å; CrH FH and 8ACT FH RMSD between 592 pruned atom pairs was 1.268 Å, and across all 851 pairs was 3.371 Å; CrT BH and 8ACT BH RMSD between 554 pruned atom pairs was 1.247 Å, and across all 867 pairs was 2.328 Å; CrT FH and 8ACT FH RMSD between 531 pruned atom pairs was 1.287 Å, and across all 851 pairs was 2.526 Å. We conclude that 8ACT is an excellent model for the two filament IHMs, its individual heads matching essentially perfectly with the individual free and blocked heads of CrT and CrH, and the whole IHM being close to the CrT and CrH whole IHMs (overall closer to CrH). The small difference between the isolated IHM and its counterparts in the filament is likely due to the absence in the isolated molecule of interactions of the FH and BH that occur with cMyBP-C and the filament backbone in the native filament. RMSD of Cα was calculated with the ChimeraX Matchmaker command using FH and BH separately.
Extended Data Fig. 4.
Extended Data Fig. 4.. Tracking myosin tails and their interactions (zoom for detail).
a, Transverse slices of reconstruction (looking towards M-line) showing the tail arrangement at crowns H, T, and D, respectively (colored lines in c) for TaH (green), TaT (blue) and TaD (red). Tails are tracked by showing their positions at different crown levels (numerals), using the convention devised by Squire,, as they travel from their N-terminal origins, at the head-tail junction of each IHM (level 1), to their C-terminal tips (level 11). Black lines in colored sectors replace the numerals, revealing the quite different courses of the 3 tail types as they travel along the filament. For example, TaD lie near the surface while TaT are the most central, forming the filament core. Titins A and B are labeled TAn and TBn, where n is the nth titin domain in the 430 Å repeat. MyBP-C is pink and labeled Cn (where n is the MyBP-C domain). The dotted black lines show one sector (colored) at each crown. Rectangles show examples of interactions of tails staggered by 1, 3, 5, and 7 crowns. Note sheets of CrD tails (red) staggered by 3 crowns (430 Å) near surface of backbone, forming a binding platform for cMyBP-C (see text). b, Cross-section at CrH, showing map (left) and corresponding space-filling atomic model (right), revealing clear examples of contact (thus interaction) between myosin tails with various staggers. Similar contacts are seen at other levels. c, longitudinal view of map (M-line at right) showing where slices in a are cut. d-f, Longitudinal views of reconstruction showing interactions of tails staggered by 1, 3, 5 or 7 crowns (~ 143, 430, 715 or 1,001 Å), as predicted by, corresponding to differences in tail numbers of 1, 3, 5, and 7 in a. Main sites of contact are inside the rectangular boxes. The most common sites are the distal LMM regions of each tail, including the ACD at the C-terminus (top boxes), consistent with its requirement for filament assembly (see text). The most prevalent stagger (3-crowns, 430 Å) is confined to homologous tails (TaH-TaH, TaT-TaT, TaD-TaD) (e). Heterologous tail combinations are staggered by 5 crowns (TaT-TaD, TaD-TaH) and one (TaH-TaD) by 7 crowns (f). One heterologous pair (TaH-TaT) exhibits a 141 Å stagger between S2s in the same sector (d, right) and between LMMs (including the ACD) from different sectors (d, left). g, Examples of charge interactions between S2’s staggered by 141 Å and LMMs by 430 Å (red, negative; blue, positive). h, Map and model at the 4 skip residues in CrH tails (Supplementary Fig. 3) and comparison of skip 1 in the filament (green) with corresponding crystal structure of skip 1 (PDB 4xa1, pink). The similarity gives support for the relevance of this X-ray model to the native structure. i, CrH, CrT and CrD tails with skip residues marked. All skips in the 3 tails appear to be associated with a longer coiled-coil pitch (~100–110 Å compared with regular ~75 Å) and with bends in the tail. Interestingly, the bends are not identical for all three tail types. Skip 1 of TaT and TaH shows a slight bend, while the TaD bend is sharper; skip 2 of TaT shows a slight bend, while TaD and TaH bends are sharp; skip 3 of all tails shows a mildly bent structure; and skip 4 bend is stronger in TaT and TaD than TaH. See also Supplementary Videos 2 and 3.
Extended Data Fig. 5.
Extended Data Fig. 5.. Domain identification and model building of titins and cMyBP-C (zoom for detail).
a, e. AlphaFold-predicted models of the two titins (a) and cMyBP-C (e). The sequence for titin super-repeat 4 of the C-zone was used, as each super-repeat is unique. Individual domains of titin and cMyBP-C showed high confidence. pLDDT (predicted local distance difference test) was ~90 (high confidence; dark blue in a). b, f, Predicted aligned error (PAE) was also good (< 5 Å). From PAE plots, portions where the conformation of inter-domain linkers also had high confidence (yellow and pink boxes) were initially rigid-body fitted to the reconstruction (‘fit in map’ in ChimeraX), and other domains then connected using Coot and flexible fitting (MDFF, NAMDINATOR) to build the final atomic models (Methods). c, g, Atomic models (“Final Model”) of TB, TA and cMyBP-C. Simulated maps (“Molmap”: yellow, orange, pink surfaces) were generated from the models, using Molmap in ChimeraX, to compare with the EM density in the reconstruction (gray surface maps segmented from full reconstruction). The simulated maps showed excellent agreement with the actual map for every domain, giving confidence in our atomic models for the two titins and cMyBP-C. An especially striking prediction of AlphaFold was the long linker (e) between cMyBP-C domains C9 and C10 (g), which fitted precisely into our EM map. d, h, Predicted density maps (yellow, orange, pink), based on atomic models (c, g), placed on the full reconstruction (gray), for comparison in the context of the entire map (actual densities outlined by yellow, orange and pink borders). The similarity of the actual and generated maps confirms our confidence in the assignment of cMyBP-C and titin domains and their near-atomic structures. See Supplementary Methods, Supplementary Figs. 1, 2, and Supplementary Video 4 for additional information on fitting of titin domains.
Extended Data Fig. 6.
Extended Data Fig. 6.. Different conformations of titins TB and TA (zoom for detail).
a, The two titin densities (TB, TA) in one 430-Å super-repeat of a sector contain 11 Ig and Fn domains, and their overall conformation is not straight. The titin maps segmented from the reconstruction show that, due to the presence of 3 kinks (arrows), and a slight curve in the T1–T3 and T8–T11 regions, one super-repeat (11 domains) fits precisely into 430 Å, matching exactly the triplet repeat of myosin heads (CrD-CrT-CrH). The kinks, all occurring at an Ig-Fn junction, demarcate three parts of the super-repeat: 1. T1–T3 (Ig-Fn-Fn); 2. T4–T7 (Ig-Fn-Fn-Fn); and 3. T8–T11 (Ig-Fn-Fn-Fn). Parts 1 and 3 of TB and TA have similar conformations, and are approximately parallel to each other. However, the conformation of Part 2 differs between TB and TA. In TB, T4–T7 is rotated ~90° with respect to TA, positioning it at a higher radius above the surface of the backbone, where it becomes available for interaction with CrD S2 as shown in b (see also Supplementary Video 1). b, Because of this conformational difference, the middle portions of TB and TA interact differently with different tails. The bent and raised conformation of T5–T6–T7 in TB binds to proximal S2 of CrD with mostly electrostatic attraction (inset), while the straight conformation of T5–T6 in TA binds to distal S2 of CrH (ED Fig. 7), generating an axial shift of 148 Å between CrH and CrD (see d). c, Previous studies speculated that the 39 Å reflection in the X-ray diffraction pattern of relaxed muscle (ED Fig. 3g) may be due to titin. Here we demonstrate this directly. Fast Fourier transformation (FFT) of the titin strand, segmented from the reconstruction in its native (kinked) conformation (right), produces a meridional reflection at a spacing of 39 Å, the 11th order of the 430 Å repeat (seen as layer lines at lower angles). If titin is computationally straightened (left), the reflection moves towards the origin (~44 Å spacing), producing a reflection that is not observed in the relaxed X-ray pattern. Agreement of the reconstruction with X-ray data from relaxed intact muscle (ED Fig. 3g vs. e, f) implies that titin is kinked in the native state, allowing the 11 domains of its super-repeat to fit into 430 Å. The FFTs were computed from 8 titin super-repeats of the kind shown in c, laid end-to-end, to create a strand similar to that in one C-zone of the thick filament. See also ED Fig. 10. d, Past studies suggested that the uneven spacing of titin’s 3 Ig domains in the super-repeat might be responsible for the uneven spacing of the 3 myosin crowns in the 430 Å repeat. Our reconstruction enables us to test this idea. We find an approximate correlation between the positions of the 3 Ig domains (purple) and the motor domains of the 3 IHMs. Ig1 (T1) correlates with CrT, Ig2 (T4) with CrD, and Ig3 (T8) with CrH. But we see no precise correlation that would suggest that the 3 Ig domains directly position the crowns (see crown and Ig spacings on figure). This is not surprising, given the absence of any direct titin-head interaction in the structure. Instead, titin positions the crowns through interaction of TB and TA with CrH and CrD tails, while CrT is positioned by interaction of TaT with TaH (see text). See also Supplementary Video 5.
Extended Data Fig. 7.
Extended Data Fig. 7.. Titin-tail and tail-tail electrostatic interactions create the unique 3-crown repeat of myosin molecules in the C-zone (zoom for detail).
Myosin tails form extensive, mostly electrostatic, interactions with each other and with titin, which combined determine the axial and azimuthal positions of CrH, CrT, and CrD. a, b show representative examples. a, TaH and TaT (atomic models fitted into density map) run together in the S2 region (black rectangle) (Fig. 3), forming charge-charge interactions (right: red, negative; blue, positive), which shift CrT ~141 Å axially with respect to CrH (cf.; see also ED Fig. 4). b, CrH tails also form electrostatic interactions with TA, involving all 11 domains of the 430 Å titin super-repeat (Fig. 4c). Interactions involve both proximal and distal S2 (bottom and top right, respectively), whose ~42 Å charge repeat matches the ~42 Å spacing of the charged-surface titin domains. This is the most extensive titin-tail interaction in the reconstruction and is responsible for placing CrH crowns 430 Å apart, by matching them to the 430 Å length of the TA 11-domain super-repeat in its kinked conformation on the filament surface (ED Fig. 6c). In summary, TaH-TA and TaH-TaT interactions (shown here), and TaD-TB interaction (ED Fig. 6b), are the driving force for organizing the three crowns (CrH-CrT-CrD) in a quasi-helical arrangement in the human cardiac thick filament in the relaxed state.
Extended Data Fig. 8.
Extended Data Fig. 8.. cMyBP-C position is determined by binding to a specific coalescence of CrD tails (zoom for detail).
The reconstruction shows that C-terminal domains C6 to C10 of cMyBP-C dock onto the filament backbone through interaction with only one type of tail (CrD tails, TaD). There is no interaction with titin, although titin is indirectly involved by positioning the tails. The complete cMyBP-C binding site is formed when three CrD tails, from three consecutive 430 Å repeats, lie side-by-side, creating a sheet-like docking platform that can make complementary charge interactions with the cMyBP-C domains. a, Distribution of C6–C10 binding sites at different points along a CrD tail. Complete/partial binding sites are shown by pink circles/semicircles. b, When CrD tails from 3 levels assemble to form the docking platform, a complete binding site is created (green box). C6 and C7 interact with level 7 TaD LMM; C8 with level 1 S2; C9 with level 1 S2 and level 4 LMM; C9–C10 linker with level 4 LMM; and C10 with level 4 and level 7 LMMs. The docking of C6 to C10 on the backbone thus requires a particular arrangement of CrD tails, from levels 1, 4 and 7, 430 Å apart. Based on titin’s specific 11-domain super-repeat in the C-zone (determining myosin tail locations), and quite different 7-domain super-repeat in the D-zone, this specific arrangement of CrD tails occurs only in the C-zone. This may explain cMyBP-C’s confinement only to this region of the thick filament. In addition to tail binding, C8 and C10 (both Ig domains) interact with the FH motor domain of CrH and CrT (Fig. 4). c, d, Atomic model fitted to map shows details of interactions in the complete cMyBP-C binding site on the 3 CrD tails. e, f, Surface charge depiction of tails (e) and cMyBP-C, rotated 180° (f), suggests that binding occurs mainly through electrostatic attraction (boxes show complementary charges). See also Supplementary Video 6.
Extended Data Fig. 9.
Extended Data Fig. 9.. Examples of mutations clustering at intermolecular interaction sites, whose location suggests novel mechanisms of HCM pathogenicity (zoom for detail).
The map reveals that many HCM pathogenic mutations in cMyBP-C, and in myosin tails and heads of specific crowns (CrH, CrT and CrD), are in intermolecular interfaces in the native filament. These mutations could not be mapped previously due to use of the tarantula filament IHM, lacking cMyBP-C and titin,. a, Mutations affecting the tail-titin interface. Mutations in ring 1 (D906G) and 2 (E924K, E930K) of CrD S248 occur at the site of interaction with TB domains T5 and T6. Surface charge depiction showing positively charged patches on TB (blue on right inset) suggests that these mutations, involving loss or reversal of negative charge, would weaken binding of CrD S2 to TB. This could interfere with transmission of tension by titin to the cMyBP-C–TaD binding site, and thus disrupt possible mechanical signaling mechanisms (see text and ED Fig. 10). b, Mutations affecting tail-tail interfaces. Mutation E924K in (a) is also involved in a tail-tail interaction, in this case not CrD, but the S2s of CrH and CrT. E924K charge reversal on CrT S2 (right inset) would be expected to weaken interaction with positive charge (blue) on CrH S2, thus impairing stability of the tail network. Disruption of function in these 2 different ways (tail-TB and tail-tail) could make the E924K mutation especially pathogenic. c, Mutations in cMyBP-C and the myosin motor domain affecting the cMyBP-C–myosin head interface. Pathogenic mutations in the myosin head (P307H) and the cMyBP-C C8 domain (R1002Q, E1017K) both occur in the interaction interface of C8 with the FH motor domain of CrH. Surface charge depiction suggests that charge loss or reversal on C8 (left inset) and on CrH FH (right inset) would weaken this interface, impairing cMyBP-C’s stabilization of the CrH FH. This could disturb its SRX state and interfere with proposed mechanical signaling mechanisms (ED Fig. 10). d, Mutations in the myosin motor domain affecting multiple interfaces with tails. The classic mutation R403Q, in the CM loop of the motor domain, has been widely studied but not fully explained. The reconstruction suggests that it could have multiple effects, by impairing head-tail interactions differently in CrH and CrT FHs. In the upper inset, the CrT CM loop interacts with its own S2, while in the lower, the CrH CM loop interacts with S2 from a more distal CrT. Loss of positive charge in the former may strengthen binding to the positive charge K939, stabilizing the IHM, while in the latter it would weaken interaction with the CrT tail (E1119/E1120), again affecting mechanical signaling mechanisms (ED Fig. 10). In summary, due to the various environments of myosins in a single 430-Å repeat, a single mutation can affect multiple interactions, with different pathogenic consequences.
Extended Data Fig. 10.
Extended Data Fig. 10.. Proposed mechanism of length-dependent activation (LDA) and mechanosensing (MS) in cardiac thick filament involving titin, cMyBP-C and myosin tails (zoom for detail).
Our reconstruction reveals connections of titin to myosin and myosin to cMyBP-C, that may underlie LDA and MS. a, b. Upper (relaxed): In relaxed state (right), TB and TA are kinked as in our reconstruction (left). Myosin heads form IHMs; cMyBP-C binds to docking site on CrD tails (green box; ED Fig. 8) and to CrH and CrT heads (asterisks) (Fig. 5c–f); and TB and TA interact with myosin tails (red, green connections). In addition, CrH FH CM loop binds to TaT tail (“+” in b (upper); Fig. 6g, h). Middle (LDA): Elongation of the sarcomere at end-diastole (right) stretches TB and TA, reducing the kinks (left), supported by an increase in the spacing of the 39 Å X-ray reflection upon stretch; see ED Figs. 3g, 6c). Tension-induced translation of titin domains pulls on connected myosin tails, partially dismantling cMyBP-C binding sites on CrD tails and on CrH and CrT heads. Loss of the stabilizing influence of cMyBP-C on CrH and CrT, augmented by weakening of the CrH FH CM loop-TaT interaction (“+” in b, upper) under tension, releases heads for actin interaction, accounting for progressive enhanced force of systole that follows corresponding sarcomere length increase (= LDA). Lower (MS): In mechanosensing (right), CrD heads that performed a “sentinel” role for detecting thin filament activation, in relaxed and LDA states, are now active and produce tension by interacting with actin (right). This stretches titin in a similar way to LDA (left), with similar consequences, enhancing contractility. In addition to the above cMyBP-C interactions, there are also CrD tail interactions with CrH FH and CrT FH, which could stabilize these IHMs (Fig. 6j, k, m). These interactions would also be broken upon sliding of CrD tails, contributing to LDA and MS.
Figure 1.
Figure 1.. Single-particle 3D reconstruction of C-zone reveals organization of titin, cMyBP-C, and myosin heads and tails (zoom for detail).
a, Cartoon of half thick filament, defining proximal, cMyBP-C-containing, and distal zones (P-, C- and D-zones, respectively), bare zone (BZ, lacking myosin heads), with central M-line, quasi-helical arrangement of myosin head pairs (colored spheres), with 430 Å repeat, and locations of cMyBP-C (pink) and titin (yellow, orange). b, 3D reconstruction of 5 crowns of heads, longitudinal surface view, showing IHMs forming 3 types of crown (Disordered/mobile, CrD, red; Tilted, CrT, blue; Horizontal, CrH, green—corresponding to crowns 2, 3, 1 of Tamborrini et al., shown in parentheses). One IHM is circled, with its two motor domains shown in different colors (light/dark green). Oriented with M-line at top. c, The 5-crown map in b after post-processing with DeepEMhancer, colored to identify myosin heavy chains (CrD, light/dark red; CrT, light/dark blue; CrH, light/dark green), coiled-coil myosin tails, and longitudinally arranged cMyBP-C molecules (pink) and 2 titin strands (yellow and orange); other colors in heads are light chains. d, Two-crown map (CrT and CrH) yields higher resolution, now revealing α-helices in the heads, better defining them in the tails, and revealing more detail in titin and cMyBP-C. e, Two-crown map viewed transversely at the level of CrH (36.6 Å slice), showing azimuthal and radial positions of components, and resolution of myosin tails into individual α-helices (dark and light color within each tail). f, Five-crown reconstruction (black silhouette) fitted with atomic models of myosin, cMyBP-C, and titin (ribbon depiction). g, Atomic model of portions of two sectors of reconstruction (defined as in ED Fig. 2), oriented to optimize visibility of all components. C (cMyBP-C), TA (titin A) and TB (titin B), with domains numbered; BH, FH, blocked and free heads; RLC, regulatory light chain; ELC, essential light chain. See also Supplementary Video 1.
Figure 2.
Figure 2.. Model building and fitting explains all observed densities in the cryo-EM map (zoom for detail).
a, Refined atomic model (see Methods) fitted into translucent map of the two stable crowns (CrH, CrT, Fig. 1d); the model also shows titins, TB (yellow) and TA (orange), and cMyBP-C (C5–C10, pink). b, Same as a, rotated 90° (viewed towards Z-line). CrT tails (blue) form filament core, CrH tails (green) are distributed between surface and core, and CrD tails (red) are at filament surface, forming docking station for cMyBP-C (pink) (see Fig. 5, ED Fig. 8). c-g, Map densities of individual components (“split-maps”) segmented from full map, with corresponding models, to show detailed fitting. c, d, TB, TA, with domains numbered, and indicating the 3 Ig domains (others are Fn). TB and TA conformations differ mostly in middle domains T4–T7 (Ig-Fn-Fn-Fn). T1–T3 (Ig-Fn-Fn) and T8–T11 (Ig-Fn-Fn-Fn) are parallel to each other in corresponding regions of TB and TA (ED Fig. 6). e, cMyBP-C domains C5–C10. Note extended C9–C10 linker predicted by AlphaFold (ED Fig. 5) is seen directly in map. f, CrT and CrH IHMs. g, CrH and CrT tails, TaH and TaT. h, CrT and CrH IHMs appear very similar when superimposed, except for a 7.5 Å shift between the two FHs, and 20° difference in angle between S2’s after they leave the BH. See also Supplementary Video 1.
Figure 3.
Figure 3.. Myosin tails form an interconnected network in the filament backbone.
a, Density map extended to 14 crowns to include full length myosin tails, revealing the network of interactions in the filament C-zone. b, Density map of multiple 430-Å repeats, colored to separate CrH (green), CrT (blue) and CrD (red) tails, highlighting their organization in the tail network. c, Schematic representation of tails from two of the three sectors of the filament, based on (b). The most common interactions involve tails of myosins staggered by 3 crowns (430 Å; ED Fig. 4a, e). 430-Å-staggered CrT tails (blue) interact with each other in the distal half of LMM (representative interaction shown by blue box and black open arrow), forming the cylindrical filament core (Fig. 2b, ED Fig. 4a, b). Groups of 430-Å-staggered CrD tails (red) form a flat sheet (red box and black open arrow), on which cMyBP-C docks (Fig. 5, ED Figs. 4a, b, 8). CrH tails (green) also mostly interact with a 430-Å stagger (green box and black open arrow). d-e, Density map of myosin molecules of a single 430-Å repeat (d), with schematic diagram (e), showing mainly the single crown (141 Å) staggered S2–S2 interaction between CrH and CrT tails (black box). Other staggers between tails (5 and 7 crowns) are shown in ED Fig. 4f. f-h. Density map showing how myosin tails originating from the three different crowns in a 430-Å repeat follow three different trajectories: f, CrD; g, CrH; and h, CrT. This unique pattern differs fundamentally from invertebrate filaments, where all myosin tails are equivalent. See also Supplementary Video 2.
Figure 4.
Figure 4.. Titin functions as a template for myosin organization (zoom for detail).
a, Density map showing one pair of titin strands (TA, orange Fn domains, purple Ig domains; TB, yellow Fn, purple Ig). The two titins run nearly parallel except in the middle region (Ig-Fn-Fn-Fn) of each super-repeat (Fig. 2c, d, ED Fig. 6). b, Same as a, but including myosin molecules CrD (red), CrH (green) and CrT (blue), to show organization of tails with respect to titins. c, Titins form extensive interactions with myosin tails in a sector (ED Fig. 2e), creating and strengthening the tail network. Interactions of TB and TA with individual tails from CrD, CrH and CrT (TaD, TaH and TaT, respectively) are shown. Numbers indicate the individual titin domains involved. TaH interacts with both TB and TA: the first half (S2) extensively with TA, the second half (LMM) with TB. TaT interacts only (and minimally) with TA, mainly in its S2 region, and then travels towards the filament core (Fig. 3), with no further interaction with either titin. TaD (mainly S2) interacts with TB, mostly in the mid-region (Ig-Fn-Fn-Fn) of two super-repeats (T5–T8 and T15–T18), but not with TA. d, TB and TA from adjacent sectors interact with each other to create a complete, 3-sector, filament. The main interaction, at T7/T8, is electrostatic (left, atomic model fitted into EM map; right, surface charge interaction). e, Representative example of titin-tail interface, showing TA (T9–T11) interaction with two TaH’s from different crowns and a TaT. Fitting of tail and titin atomic models into the map suggests β-β hairpin loops in Ig and Fn domains mostly form the titin-tail interface (left, black boxes). A single titin domain can interact with as many as 3 myosin tails originating from different crowns (right, inset). See also ED Fig. 6 and Supplementary Video 5.
Figure 5.
Figure 5.. cMyBP-C interacts with myosin tails and heads.
a, b, Overview of 13-crown map showing (a) positions of cMyBP-C (pink) at 430-Å intervals in one sector of the 3-fold symmetric filament, and (b) interaction of cMyBP-C with five myosin molecules (box), including CrH and CrT heads and a sheet of tails from three 430-Å levels (3, 6, and 9) of CrD. c, Zoom of map with fitted atomic model shows interaction of domains C6–C10 with CrD tails (see ED Fig. 8 for details), C10 with CrT-FH-MD (d), C8 with CrH-FH-MD (e), and 28-amino-acid insert in C5 with CrH-FH-RLC (f). g, Low contour cutoff surface view reveals significant density for domains C2–C4, not observed at higher contour cutoff (Fig. 1c); C2 appears to bind to CrT BH at bottom and C4 to CrD BH (white circle). Gray on CrD FH map (orange) lies outside CrD atomic model, possibly representing weakly (transiently) bound C0-M domains of cMyBP-C (yellow arrows). Analysis of our preparations using Pro-Q Diamond/SYPRO Ruby-stained gels suggests a basal level of cMyBP-C phosphorylation, which may contribute to the weakness of C0-M visibility. See Supplementary Video 6 for 3D detail.
Figure 6.
Figure 6.. IHM interactions may stabilize the relaxed state.
a. Density map showing one CrD-CrT-CrH triplet, and CrT and CrD IHMs from two other triplets. b. Atomic models of IHMs in three crowns, showing possible inter-crown contacts. c. N-terminal ELC of CrD-BH is close to SH3 domain of CrT FH motor domain. Although the N-terminal 38 amino acids of the ELC are missing/disordered from the model (due to absence from PDB 5n69, used to create it), weak map density connecting SH3 and ELC is seen at low contour. This could represent mobile ELC residues contacting the CrT SH3 domain. d. AlphaFold-based model of positively charged N-terminal region of CrT-BH RLC shows possible contacts with negatively charged cavity of motor domain of CrH-FH (mostly Asp and Glu residues). This could help immobilize both CrT and CrH IHMs (enhancing SRX), and phosphorylation on Ser15 may weaken this contact. e. Electrostatic surface representation of d (blue, positive; red, negative). f, The positively charged N-terminal extension (NTE) of the FH RLC (yellow outline) docks onto a negatively charged region of the BH RLC, establishing an RLC-RLC interaction. On activation of cMLCK, Ser15 is phosphorylated, which is thought to elongate the NTE, in turn disrupting the RLC-RLC interaction and aiding release of the CrH FH. g-m, IHMs also contact different tails. g, h, i. The CrH FH CM-loop interacts with TaT (S2) from the more distal CrT (h), while the CrT CM-loop contacts its own S2 (i). j-m, CrT and CrH FH interact with the same TaD from a distal CrD through α-helices in their motor domains (k, m). l, The CrT-BH converter has possible contact with CrH S2.

Update of

Comment in

References

    1. Wang L, Geist J, Grogan A, Hu LR & Kontrogianni-Konstantopoulos A Thick Filament Protein Network, Functions, and Disease Association. Compr Physiol 8, 631–709, doi:10.1002/cphy.c170023 (2018). - DOI - PMC - PubMed
    1. Huxley HE Electron microscope studies on the structure of natural and synthetic protein filaments from striated muscle. J. Mol. Biol 7, 281–308 (1963). - PubMed
    1. Hooijman P, Stewart MA & Cooke R A new state of cardiac myosin with very slow ATP turnover: a potential cardioprotective mechanism in the heart. Biophys. J 100, 1969–1976, doi:S0006–3495(11)00326–2 [pii];10.1016/j.bpj.2011.02.061 [doi] (2011). - DOI - PMC - PubMed
    1. de Tombe PP et al. Myofilament length dependent activation. J Mol Cell Cardiol 48, 851–858, doi:10.1016/j.yjmcc.2009.12.017 (2010). - DOI - PMC - PubMed
    1. Alamo L et al. Effects of myosin variants on interacting-heads motif explain distinct hypertrophic and dilated cardiomyopathy phenotypes. Elife 6, doi:10.7554/eLife.24634 (2017). - DOI - PMC - PubMed