

Effect of Small and Large Energy Surpluses on Strength, Muscle, and Skinfold Thickness in Resistance-Trained Individuals: A Parallel Groups Design
- PMID: 37914977
- PMCID: PMC10620361
- DOI: 10.1186/s40798-023-00651-y
Effect of Small and Large Energy Surpluses on Strength, Muscle, and Skinfold Thickness in Resistance-Trained Individuals: A Parallel Groups Design
Abstract
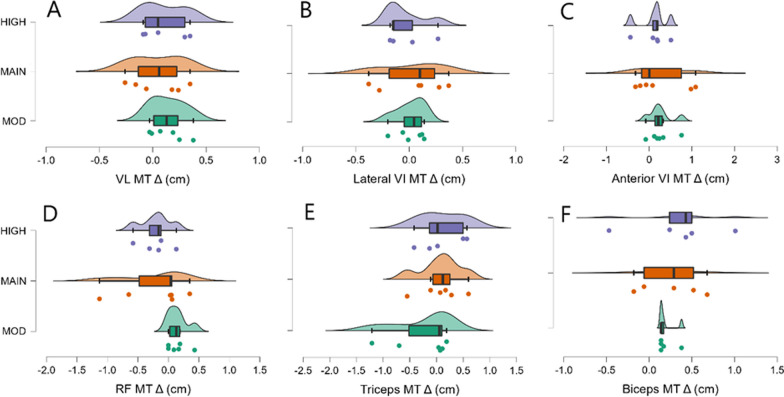
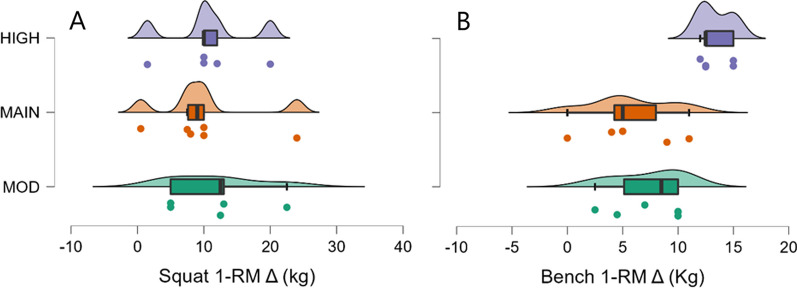
Background: Many perform resistance training (RT) to increase muscle mass and strength. Energy surpluses are advised to support such gains; however, if too large, could cause unnecessary fat gain. We randomized 21 trained lifters performing RT 3 d/wk for eight weeks into maintenance energy (MAIN), moderate (5% [MOD]), and high (15% [HIGH]) energy surplus groups to determine if skinfold thicknesses (ST), squat and bench one-repetition maximum (1-RM), or biceps brachii, triceps brachii, or quadriceps muscle thicknesses (MT) differed by group. COVID-19 reduced our sample, leaving 17 completers. Thus, in addition to Bayesian ANCOVA comparisons, we analyzed changes in body mass (BM) with ST, 1-RM, and MT changes via regression. We reported Bayes factors (BF10) indicating odds ratios of the relative likelihood of hypotheses (e.g., BF10 = 2 indicates the hypothesis is twice as likely as another) and coefficients of determination (R2) for regressions.
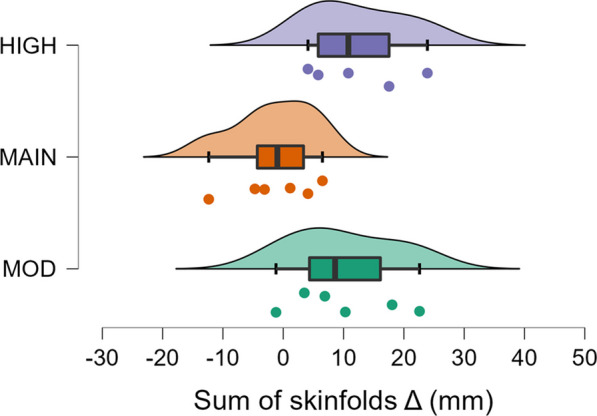
Results: ANCOVAs provided no evidence supporting the group model for MT or squat 1-RM. However, moderate (BF10 = 9.9) and strong evidence (BF10 = 14.5) indicated HIGH increased bench 1-RM more than MOD and MAIN, respectively. Further, there was moderate evidence (BF10 = 4.2) HIGH increased ST more than MAIN and weak evidence (BF10 = 2.4) MOD increased ST more than MAIN. Regression provided strong evidence that BM change predicts ST change (BF10 = 14.3, R2 = 0.49) and weak evidence predicting biceps brachii MT change (BF10 = 1.4, R2 = 0.24).
Conclusions: While some group-based differences were found, our larger N regression provides the most generalizable evidence. Therefore, we conclude faster rates of BM gain (and by proxy larger surpluses) primarily increase rates of fat gain rather than augmenting 1-RM or MT. However, biceps brachii, the muscle which received the greatest stimulus in this study, may have been positively impacted by greater BM gain, albeit slightly. Our findings are limited to the confines of this study, where a group of lifters with mixed training experience performed moderate volumes 3 d/wk for 8 weeks. Thus, future work is needed to evaluate the relationship between BM gains, increases in ST and RT adaptations in other contexts.
Keywords: Body composition; Energy surplus; Hypertrophy; Resistance training.
© 2023. The Author(s).
Conflict of interest statement
The authors declare that they have no competing interests.
Figures
References
Grants and funding
LinkOut - more resources
Full Text Sources
Miscellaneous
