. 2024 Jun 1;181(6):493-511.
doi: 10.1176/appi.ajp.20220723. Epub 2023 Nov 2.

Recapitulation of Perturbed Striatal Gene Expression Dynamics of Donors' Brains With Ventral Forebrain Organoids Derived From the Same Individuals With Schizophrenia

Affiliations

Recapitulation of Perturbed Striatal Gene Expression Dynamics of Donors' Brains With Ventral Forebrain Organoids Derived From the Same Individuals With Schizophrenia

Tomoyo Sawada et al. Am J Psychiatry. .

Abstract

Objective: Schizophrenia is a brain disorder that originates during neurodevelopment and has complex genetic and environmental etiologies. Despite decades of clinical evidence of altered striatal function in affected patients, studies examining its cellular and molecular mechanisms in humans are limited. To explore neurodevelopmental alterations in the striatum associated with schizophrenia, the authors established a method for the differentiation of induced pluripotent stem cells (iPSCs) into ventral forebrain organoids (VFOs).

Methods: VFOs were generated from postmortem dural fibroblast-derived iPSCs of four individuals with schizophrenia and four neurotypical control individuals for whom postmortem caudate genotypes and transcriptomic data were profiled in the BrainSeq neurogenomics consortium. Individuals were selected such that the two groups had nonoverlapping schizophrenia polygenic risk scores (PRSs).

Results: Single-cell RNA sequencing analyses of VFOs revealed differences in developmental trajectory between schizophrenia and control individuals in which inhibitory neuronal cells from the patients exhibited accelerated maturation. Furthermore, upregulated genes in inhibitory neurons in schizophrenia VFOs showed a significant overlap with upregulated genes in postmortem caudate tissue of individuals with schizophrenia compared with control individuals, including the donors of the iPSC cohort.

Conclusions: The findings suggest that striatal neurons derived from high-PRS individuals with schizophrenia carry abnormalities that originated during early brain development and that the VFO model can recapitulate disease-relevant cell type-specific neurodevelopmental phenotypes in a dish.

Keywords: Genetics/Genomics; Schizophrenia Spectrum and Other Psychotic Disorders.


Conflict of interest statement

Conflict of Interest

DRW serves on the advisory boards of Sage Therapeutics and Pasithea Therapeutics. The other authors declare no conflict of interest.

Figures

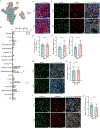
Figure 1 |
Figure 1 |. Generation and characterization of iPSC-derived ventral forebrain organoids (VFOs).
a, Plots of polygenic risk scores for schizophrenia based on a recent genome-wide association study (GWAS) [3] in the dural fibroblast cohort including four control individuals (CTRL) and four individuals with schizophrenia (SCZ) analyzed in this study. ††p=0.0083, Mann-Whitney U test (54 CTRL vs. 24 SCZ); **p=0.0021, unpaired t-test (four CTRL vs. four SCZ). b, A schematic of the human developing brain. NCx, neocortex; STR, striatum. CGE, caudal ganglionic eminence; LGE, lateral ganglionic eminence; MGE, medial ganglionic eminence. c, A schematic protocol for generation of ventral forebrain organoids (VFOs). SB, SB431542; LDN, LDN-193189; dbcAMP, dibutyryl cyclic-AMP; BDNF, brain-derived neurotrophic factor; GDNF, glial cell-derived neurotrophic factor; IGF1, insulin growth factor-1; DKK1, dickkopf related protein 1; PM, purmorphamine. d, e, Representative immunostaining of VFOs derived from control individuals (d, LIBD7c6; e, LIBD2c1) on day 37 (d) and day 30 (e). Nuclei are stained by Hoechst 33342 (blue) (d). Scale bars, 50 μm (d); 100 μm (e). f, A UMAP (uniform manifold approximation and projection) showing 15,424 cells from VFOs of four CTRL and three SCZ on day 70 and 150, colored by 18 major cell types. CR cell, Cajal-Retziuscell; ChP, choroid plexus; RG, radial glia; IPC, intermediate progenitor cell; OPC, oligodendrocyte progenitor cell; mDA neuron, midbrain dopaminergic neuron; oRG, outer RG. g, Composition of all 18 major cell types (left) and 6 major cell types among IPC/neuron population in VFOs from seven individuals (four CTRL and three SCZ). h, A UMAP of progenitors including Ventral RG, RG and oRG, and inhibitory neuronal population in VFOs (6,747 cells) from four CTRL and three SCZ, colored by major cell type. i, j, Heatmaps showing gene expression similarity of progenitors in VFOs to the BrainSpan dataset (PCW 8–9) (i) and similarity of inhibitory IPC/neurons in VFOs to the BrainSpan dataset (PCW 12–13-16) (j). AMY, amygdala; DTH, dorsal thalamus; GE, ganglionic eminence; HIP, hippocampus; NCx, neocortex; URL, upper (rostral) rhombic lip; CB, cerebellum; STR, striatum; PCW, post conception weeks. k, A matrix plot showing expression of genes upregulated in human LGE at PCW 7, 9 and 11 compared to MGE and neocortex [60] in inhibitory neuronal cells in VFOs from four CTRL and three SCZ. l, A heatmap showing overlap of differentially expressed genes (DEGs) in each inhibitory neuronal cell type compared to all other cell types in VFOs with cell type-specific genes in scRNA-seq of human LGE (PCW 7–11) [60]. The color indicates the overlap coefficient. m-o, Time series of mean firing rate (m), synchrony index (n), and network burst frequency (o) of VFOs derived from a control individual (33114.c) between day 150 and day 199 (n = 3–9; VFOs for each time point). Dashed circles indicate outliers. p, Representative raster plots of untreated and control VFOs (33114.c) treated with bicuculline, muscimol or AP5+CNQX at days 220–241. q-s, Effect of treatments with bicuculline (q), muscimol (r), and AP5+CNQX (s) on mean firing rate and synchrony index of control VFOs (33114.c) at day 220 (q), day 241 (r) and day 227 (s). *p<0.05; **p<0.01; ***p<0.001; n.s., not significant; one-way ANOVA with post hoc Tukey’s multiple comparisons test. Outliers were removed on Prism with ROUT (Q=1%). Data represent mean ± s.d. (n = 7–9; VFOs for recording).
Figure 2 |
Figure 2 |. No structural differences between control- and schizophrenia-derived VFOs.
a, A UMAP showing 15,424 cells from VFOs of four CTRL and three SCZ on day 70 and 150, colored by diagnosis. b, Proportion of 18 major cell types in VFOs from four CTRL and three SCZ (day 70 + day 150). Data represent mean ± s.e.m. *p=0.0304 (Mesenchymal cell); **p=0.0029 (RG); two-way ANOVA with post hoc Bonferroni’s multiple comparisons test. c, Representative immunostaining images of VFOs derived from CTRL (LIBD9c1) and SCZ (LIBD8c4) at day 70 showing SOX2+ ventricular zone (VZ). Nuclei are stained by Hoechst 33342 (blue). Scale bars, 50 μm. d, Quantification of thickness of SOX2+ VZ in VFOs at day 70 (n=4 CTRL lines; n=3 SCZ lines; 2–3 organoids per line). n.s., not significant; Mann-Whitney U test. Averages of 7–93 structures per organoid were analyzed. e, Representative immunostaining images of VFOs derived from CTRL (LIBD2c1) and SCZ (LIBD5c7) at day 70 showing pre-MSN/MSN expressing MEIS2 and/or FOXP1. Nuclei are stained by Hoechst 33342 (blue). Scale bars, 20 μm. f, Quantification of mean intensity of MEIS2 and FOXP1 in VFOs at day 70 (n=4 CTRL lines; n=3 SCZ lines; 2–3 organoids per line). n.s., not significant; unpaired t-test. g, Representative immunostaining images of VFOs derived from CTRL (LIBD2c1) and SCZ (LIBD8c4) at day 160 showing GABAergic neurons. Nuclei are stained by Hoechst 33342 (blue). Scale bars, 20 μm. h, Quantification of mean intensity of GABA in VFOs at day 160 (n=4 CTRL lines; n=3 SCZ lines; 2–3 organoids per line). n.s., not significant; unpaired t-test. i, Representative immunostaining images of VFOs derived from CTRL (LIBD2c1) and SCZ (LIBD5c7) at day 160 showing Calretinin+-striatal interneurons and DARPP32+-MSNs. Nuclei are stained by Hoechst 33342 (blue). Scale bars, 20 μm. j, Quantification of mean intensity of DARPP32 in VFOs at day 160 (n=4 CTRL lines; n=3 SCZ lines; 2–3 organoids per line). n.s., not significant; unpaired t-test. Error bars, mean ± s.d. (d, f, h, j).
Figure 3 |
Figure 3 |. Transcriptional differences in striatal inhibitory neuronal cells of VFOs between control and schizophrenia.
a, A UMAP of inhibitory neuronal cells (progenitor, inhibitory IPC and inhibitory neuron) from VFOs of four CTRL and three SCZ on day 70 and 150. Progenitors are highlighted in light green. b, UMAP of progenitors from VFOs of four CTRL and three SCZ on day 70 and 150. Cells belonging to CTRL and SCZ are visualized individually. c, A UMAP of inhibitory neuronal cells from VFOs of four CTRL and three SCZ on day 70 and 150. Inhibitory neurons are highlighted in light blue. d, UMAP of inhibitory neurons from VFOs of four CTRL and three SCZ on day 70 and 150. Cells belonging to CTRL and SCZ are visualized individually. e, Comparison of proportion of progenitor and inhibitory neuron between four CTRL and three SCZ (day 70+150). n.s., not significant; unpaired t-test. f, Volcano plot showing differentially expressed genes (DEGs) in progenitors between CTRL and SCZ. Padj, adjusted p value. SCZ GWAS significant genes (CLU, GPM6A, EGR1, NMB, MAPT, SOX2-OT, PSMA4) [3], a ribosomal gene (RPL26), and cell cycle-associated genes (CCND1 and CCNG1) were labeled. g, Representative genes upregulated (CLU) and downregulated (CCND1) in SCZ progenitors compared to CTRL progenitors. FC, fold change. h, Volcano plot showing differentially expressed genes (DEGs) in inhibitory neurons between CTRL and SCZ. Synaptic genes (NRXN1, GRIA2, YWHAG, GRID2 and SYT4), ribosomal genes (RPL12 and RPL32), and SCZ-associated genes (NOVA1, CRABP1 and POU3F2) were labeled. i, Representative genes upregulated (NRXN1) and downregulated (NOVA1) in SCZ inhibitory neurons compared to CTRL inhibitory neurons. j, A dot plot showing representative gene ontology (GO) terms enriched for upregulated and downregulated genes in SCZ progenitors compared to CTRL progenitors. The size of circles indicates a ratio of genes annotated in each GO term to all up- or down-regulated genes in progenitors. k, A dot plot showing representative GO terms enriched for upregulated and downregulated genes in SCZ inhibitory neurons compared to CTRL inhibitory neurons. The size of circles indicates a ratio of genes annotated in each GO term to all up- or down-regulated genes in inhibitory neurons. Expression levels are shown in log2(CPM) (g, i). Dashed line indicates FDR=0.05 (j, k).
Figure 4 |
Figure 4 |. Accelerated differentiation of striatal inhibitory neuronal cells in schizophrenia VFOs.
a, Velocity estimates projected onto a UMAP of inhibitory neuronal cells (progenitor, inhibitory IPC and inhibitory neuron) in VFOs from four CTRL and three SCZ. b, Latent time projected onto a UMAP of inhibitory neuronal cells (progenitor, inhibitory IPC and inhibitory neuron) in VFOs from four CTRL and three SCZ. c, Density of inhibitory neuronal cells applied along latent time estimated in b. d, Difference in the density of progenitors and inhibitory neurons between four CTRL and three SCZ along latent time (Kolmogorov-Smirnov test). e, A dot plot showing the overlap between DEGs and 100 putative drivers in progenitors and inhibitory neurons. ****p=3.96E-06 for progenitor; ****p=1.53E-07 for inhibitory neuron; Fisher’s exact test. OR, odds ratio. The size of circles indicates the percentage of DEGs overlapped with putative driver genes. f, Matrix plots comparing expression of genes upregulated in human LGE at PCW 7, 9 and 11 compared to MGE and neocortex [60] in progenitors and inhibitory neurons in VFOs between four CTRL and three SCZ. g, A representative expression pattern of cluster of genes (based on fuzzy c-means clustering) showing upregulation in basal progenitor 1 (BP1) in scRNA-seq of human LGE (PCW 7–11) [60] during brain development. h, A matrix plot comparing expression of genes exhibited continuous upregulation in BP1 and BP2 in scRNA-seq of human LGE (PCW 7–11) [60] during brain development in VFO progenitors between CTRL and SCZ. i, Representative expression of putative driver genes for progenitor upregulated in SCZ progenitors compared to CTRL progenitors that exhibited continuous upregulation in BP1 and/or BP2 in scRNA-seq of human LGE (PCW 7–11) [60] during brain development. j, A representative expression pattern of cluster of genes (based on fuzzy c-means clustering) showing upregulation in pre-MSNs in scRNA-seq of human LGE (PCW 7–11) [60] during brain development. k, A matrix plot comparing expression of genes exhibited continuous upregulation in pre-MSNs, D1-MSNs imm. and D2-MSNs in scRNA-seq of human LGE (PCW 7–11) [60] during brain development in VFO inhibitory neurons between CTRL and SCZ. l, Representative expression of putative driver genes of inhibitory neurons upregulated in SCZ inhibitory neurons compared to CTRL inhibitory neurons, which exhibited continuous upregulation in pre-MSNs, D1-MSNs imm. and/or D2-MSNs in scRNA-seq of human LGE (PCW 7–11) [60] during brain development. m, Mean firing rate of VFOs from four CTRL and four SCZ measured on MEA at days 75–82 for untreated condition and at days 96–103 for clozapine treatment (n=1–5 VFOs per line per recording, n=30 for CTRL; n=23 for untreated SCZ; n=20 for SCZ with clozapine treatment). SCZ VFOs were treated with 1μM clozapine for 2 weeks. *p=0.0358; n.s., not significant; Kruskal-Wallis test with post hoc Dunn’s multiple comparisons test.
Figure 5 |
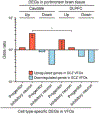
Figure 5 |. Inhibitory neurons in VFOs from individuals with schizophrenia recapitulate transcriptional perturbations in the schizophrenia postmortem caudate.
A plot showing enrichment and depletion of DEGs in progenitors and inhibitory neurons in SCZ VFOs compared to CTRL VFOs with DEGs in postmortem caudate tissue [38] and DLPFC tissue [56] in SCZ patients compared to neurotypical control individuals. **p=0.00243; ****p=1.65E-05; Fisher’s exact test. p=0.01183, hypergeometric test.

References

    1. Jablensky A, Kirkbride JB & Jones PB. (2011). Schizophrenia: The epidemiological horizon. In: Weinberger DR & Harrison PJ (eds). Schizophrenia. Wiley-Blackwell: New Jersey, pp 185–225.
    1. Kahn RS, Sommer IE, Murray RM, et al. Schizophrenia. Nat Rev Dis Primers. 2015; 1: 15067. - PubMed
    1. Trubetskoy V, Pardiñas AF, Qi T et al. Mapping genomic loci implicates genes and synaptic biology in schizophrenia. Nature. 2022; 604: 502–508. - PMC - PubMed
    1. Birnbaum R & Weinberger DR. Genetic insights into the neurodevelopmental origins of schizophrenia. Nat. Rev. Neurosci 2017; 18, 727–740. - PubMed
    1. Millan MJ, Andrieux A, Bartzokis G, et al. Altering the course of schizophrenia: progress and perspectives. Nat Rev Drug Discov. 2016; 15: 485–515. - PubMed

LinkOut - more resources