

MICa/b-dependent activation of natural killer cells by CD64+ inflammatory type 2 dendritic cells contributes to autoimmunity
- PMID: 37916875
- PMCID: PMC10690448
- DOI: 10.15252/embj.2023113714
MICa/b-dependent activation of natural killer cells by CD64+ inflammatory type 2 dendritic cells contributes to autoimmunity
Abstract
Primary Sjögren's syndrome (pSS) is an inflammatory autoimmune disorder largely mediated by type I and II interferon (IFN). The potential contribution of innate immune cells, such as natural killer (NK) cells and dendritic cells (DC), to the pSS pathology remains understudied. Here, we identified an enriched CD16+ CD56hi NK cell subset associated with higher cytotoxic function, as well as elevated proportions of inflammatory CD64+ conventional dendritic cell (cDC2) subtype that expresses increased levels of MICa/b, the ligand for the activating receptor NKG2D, in pSS individuals. Circulating cDC2 from pSS patients efficiently induced activation of cytotoxic NK cells ex vivo and were found in proximity to CD56+ NK cells in salivary glands (SG) from pSS patients. Interestingly, transcriptional activation of IFN signatures associated with the RIG-I/DDX60 pathway, IFN I receptor, and its target genes regulate the expression of NKG2D ligands on cDC2 from pSS patients. Finally, increased proportions of CD64hi RAE-1+ cDC2 and NKG2D+ CD11b+ CD27+ NK cells were present in vivo in the SG after poly I:C injection. Our study provides novel insight into the contribution and interplay of NK and cDC2 in pSS pathology and identifies new potential therapy targets.
Keywords: RIG-I; Sjögren's syndrome; dendritic cells; interferon; natural killer cells.
© 2023 The Authors. Published under the terms of the CC BY 4.0 license.
Conflict of interest statement
IGA reports the following competing interests: grants from Instituto de Salud Carlos III, during the course of the study; personal fees from Lilly and Sanofi; personal fees and non‐financial support from BMS; personal fees and non‐financial support from Abbvie; research support, personal fees, and non‐financial support from Roche Laboratories; non‐financial support from MSD, Pfizer, and Novartis, not related to the submitted work. The rest of authors declare that they have no conflict of interest.
Figures
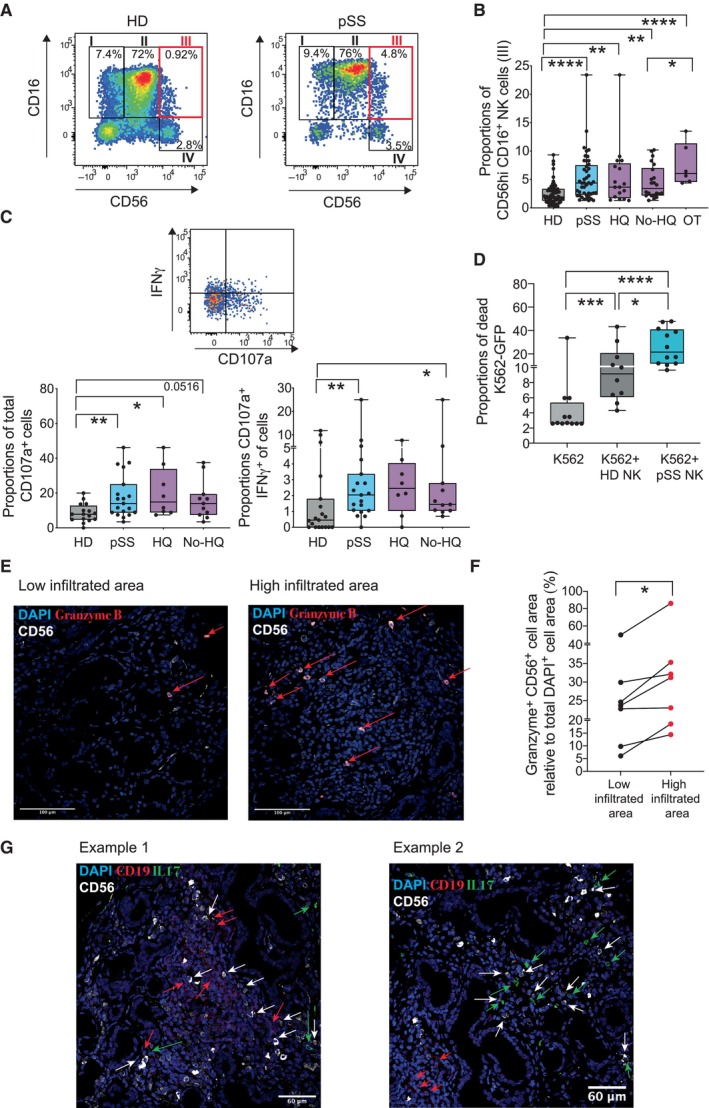
- A
Flow cytometry dot plots showing analysis of NK cell subsets present in Lineage (CD3, CD19, CD14) negative, HLADR negative lymphocytes, and defined by CD16 vs. CD56 expression in the PB of a representative HD (left) and pSS (right) individuals. Gating defining CD56hi CD16+ NK cells (III) is highlighted in red.
- B
Summarized proportions of CD56hi CD16+ circulating NK cells in 56 healthy donors (HD; gray) and total 48 primary Sjögren's syndrome (pSS; blue) patients or stratified according to the absence (No HQ, n = 25 biological replicates) or the presence of hydroxychloroquine (HQ; n = 17 biological replicates) or other (OT; n = 6 biological replicates) treatments (purple).
- C
Analysis of expression of IFNγ and CD107a on NK cells. Representative flow cytometry dot plot is included in the top. Proportions of total CD107a+ (bottom, left) and IFNγ+ CD107a+ (bottom, right) cells within the CD56hi CD16+ NK cell subset from n = 16 HD (gray) and n = 19 total or n = 8 HQ and n = 11 No‐HQ pSS patients (blue).
- D
Functional characteristics of NK cells from pSS patients. Summary of proportions of dead target K562‐GFP cells cultured for 16 h in the absence (light gray) or the presence of isolated circulating NK cells from HD (n = 10; biological replicates) or pSS (n = 12 biological replicates) patients.
- E–G
Histological immunofluorescence analysis of merged expression of CD56 (white) and Granzyme B (red) on low (left) and highly (right) infiltrated glandular areas (E) or with CD19 (red) and IL‐17 (green) (G) from the section of SG tissue from a representative pSS patient. Cell nuclei were stained with DAPI (blue). Cells co‐expressing CD56 and Granzyme B (E) or expressing CD19 (G) are highlighted with red arrows. In panel (G), IL17+ and CD56+ are also highlighted in green and white arrows, respectively. Original magnification 40×. (F): Image J quantification of proportions of area of CD56+ NK cells co‐expressing Granzyme B within the total the mentioned total high and low infiltrated areas from n = 7 tested pSS patients. Data are normalized to the number of total DAPI+ cells detected on each area considered as 100%.
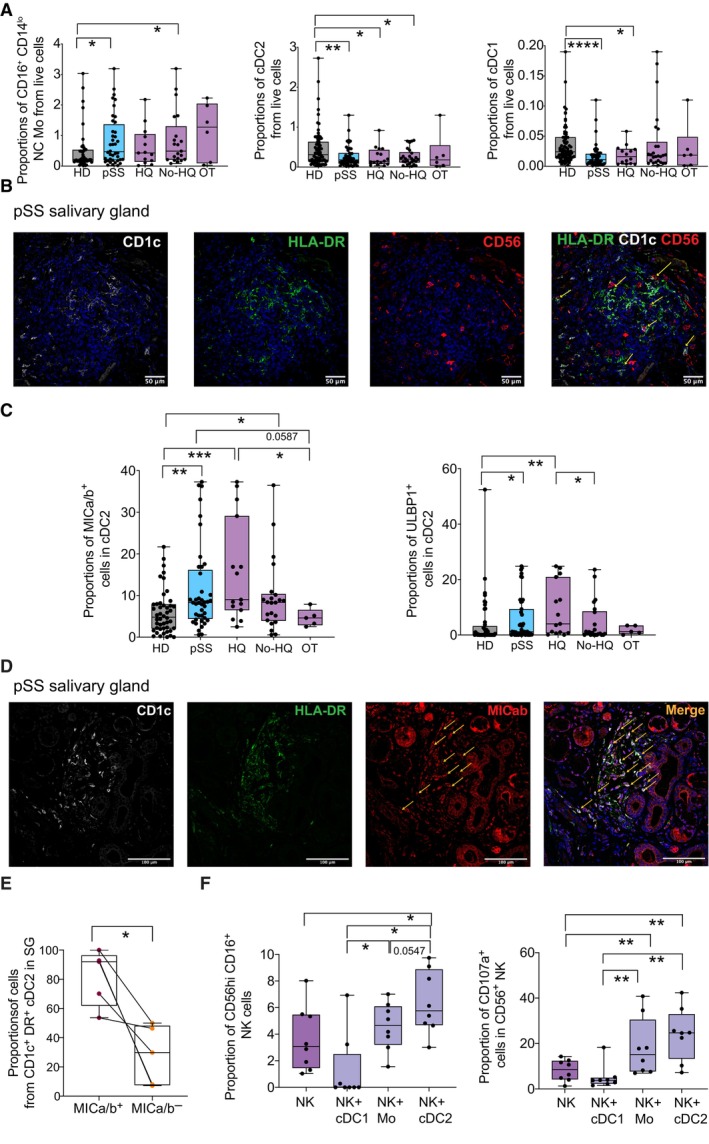
- A
Box and whiskers plots showing proportions from live lymphocytes of non‐classical (NC; right) CD16+ CD14lo Mo (left), cDC2 (middle), and cDC1 (right) in the PB from HD (gray; n = 56 biological replicates) and total pSS patients (blue; n = 48: biological replicates) or stratified according to the absence (No HQ, n = 25) or the presence of hydroxychloroquine (HQ; n = 17) or other (OT; n = 6) treatments (purple).
- B
Representative confocal microscopy (40× magnification) showing immunofluorescence analysis of CD1c (white), HLADR (green), and CD56 (red) expression on an SG tissue section from a representative pSS patient. Cell nuclei were stained with DAPI (blue). Cells co‐expressing CD1c and HLADR markers with close proximity to CD56 cells are highlighted with a yellow arrow.
- C
Proportions of MICa/b+ and ULBP1+ cells from circulating cDC2 (left plots), cDC1 (middle plots), and CD14+ Mo (right plots) in 46 HD (gray) and total n = 42, n = 15 HQ, n = 22 No HQ, and n = 5 OT pSS patients (blue and purple).
- D
Representative confocal microscopy (40× magnification) showing immunofluorescence analysis of CD1c (white), HLADR (green), and MICab (red) expression on a representative SG tissue section from a pSS patient from a total of n = 4 individuals tested. Cell nuclei were stained with DAPI (blue). Cells co‐expressing CD1c, HLADR, and MICAB are highlighted with an orange arrow.
- E
Quantification of proportions of CD1c+ HLA‐DR+ cDC2 detected in SMSG from n = 4 pSS patients that either co‐express or not MICa/b.
- F
Proportions of the CD56hi CD16+ NK cell subset proportions (left) after 16 h culture of sorted autologous CD56+ NK cell in media alone or in the presence of sorted autologous circulating Mo, cDC2, and cDC1 from n = 8 pSS patients at ratio 1:2 (myeloid cell:NK) and expression of CD107a (right) on CD56+ NK cells in these functional assays is shown.
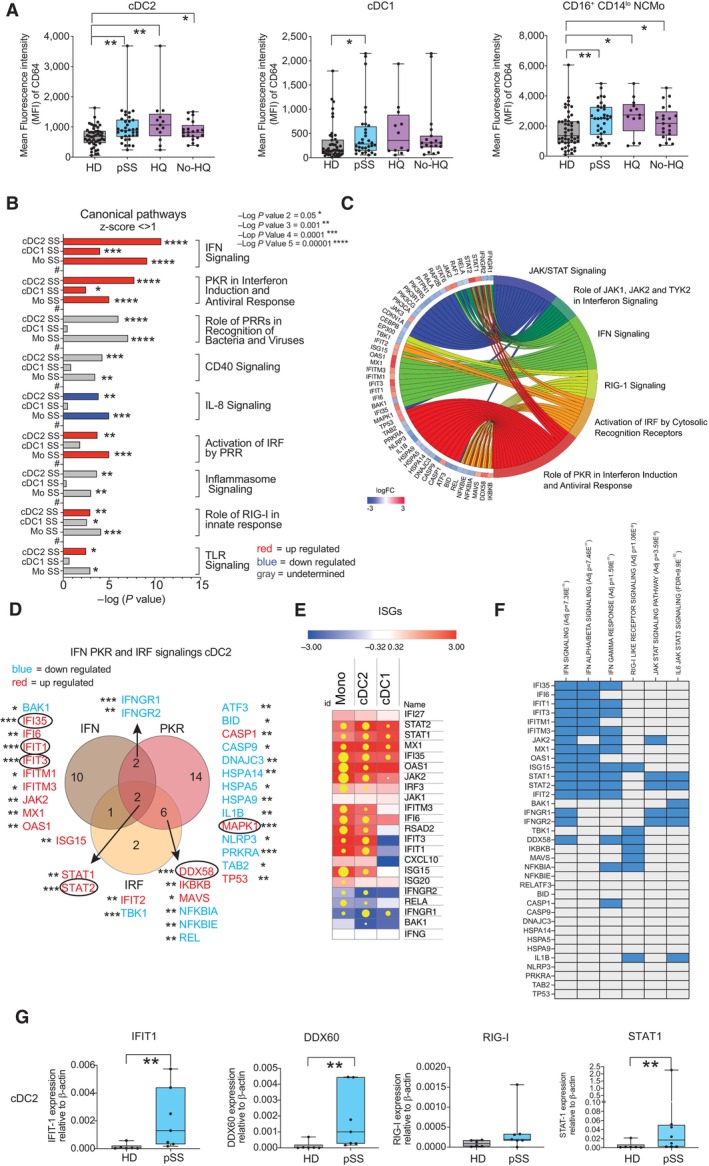
Mean of fluorescence intensity of CD64 on cDC2 (left), cDC1, non‐classical (NC) CD16+ CD14lo Mo, and Transitional (T) CD16hi CD14++ in the PB from HD (gray; n = 48) and pSS patients (blue; n = 34 total patients, n = 13 HQ, and n = 21 No‐HQ as biological replicates). Statistical significance was calculated using a two‐tailed Mann Whitney test. *P < 0.05; **P < 0.01.
Significance of selected upregulated (positive z‐score > 1; red), downregulated (negative z‐score < −1; blue) canonical pathways predicted by Ingenuity Pathway Analysis (IPA) (full analysis shown in Appendix Table S2) from significant differentially expressed genes (DEG P < 0.05 after FDR correction, log2FC > 1.5 and < −1.5) in Mo, cDC2, and cDC1 from n = 4 pSS vs. n = 4 HD. Pathways that did not have a Z‐score or did not reach these mentioned value cut offs were labeled in gray.
Chordplot representing overlap of selected IPA‐predicted canonical pathways associated with the indicated innate immune pathways (right area, in different colors) and the DEG included within each of them in cDC2 from pSS patients. Changes and levels in transcriptional expression of each DEG are highlighted in red (upregulation) and blue (downregulation).
Venn's diagram of overlapping significant DEG included in selected IFN, PKR, and IRF canonical pathways in PB cDC2 from pSS patients. FDR‐corrected P values of differential transcriptional expression of indicated DEG are highlighted; P < 0.05; **P < 0.01; ***P < 0.001.
Heatmaps representing log2‐FC in transcription of selected Interferon Stimulated genes (ISG) or transcripts associated with the IFN pathway on each cell subset from the PB from pSS vs. HD (red, upregulated; blue, downregulated). Yellow dots size is proportional to statistical significance of DEG expression (P < 0.05 FDR corrected values).
Heatmap representing enrichment of selected DEG associated with IFN, RIG‐I, and IFN receptor pathways using Gene Set enrichment Analysis (GSEA). Overlap of each DEG with the indicated sets is highlighted in blue. FDR‐corrected p values for enrichment of each gene set are also included.
qPCR validation of the indicated transcript from sorted circulating cDC2 from n = 7 pSS patients (blue) vs. n = 6 HD (gray). Statistical significance was calculated using a two‐tailed U Mann Whitney test. **P < 0.01.
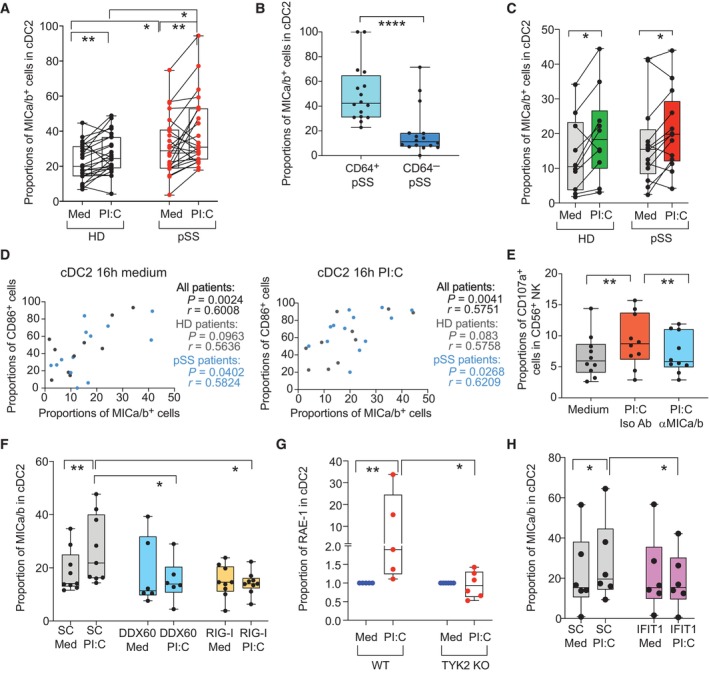
- A–C
Proportions of MICa/b+ cells in cDC2 from HD and pSS in PBMC (A) or preisolated cells (C) after 16 h poly I:C (PI:C) stimulation in cDC2 isolated from the blood of HD (biological replicates n = 24, A and n = 10, C) and pSS patients (biological replicates n = 24 A; n = 11 C). (B): Proportions of MICa/b+ cells on gated CD64+ and CD64− subpopulations included in CD11c+ CD14− cDC from PBMC of n = 16 pSS patients.
- D
Spearman correlations between proportions of CD86+ and MICa/b+ cells on cDC2 from HD and pSS after 16 h culture in media alone (left) or in the presence of poly I:C (right). P and R values of all combined cohorts or each individual study group are shown.
- E
Proportions of CD107a+ NK cells after culture in media alone or with autologous poly I:C stimulated cDC2 in the presence of either anti‐MICa/b or an isotypic control Abs (n = 10 biological replicates from pSS patients).
- F–H
Surface expression of MICa/b on isolated primary cDC2 from HD biological nucleofected with either DDX60 (n = 6 biological replicates) or RIG‐I (n = 9 biological replicates) (F) or IFIT1 (H) specific siRNAs or control scramble (SC; biological replicates n = 9 for F and n = 6 for H) siRNAs after 16 h in the presence of media or poly I:C (PI:C). (G): Fold change in RAE‐I expression in cDC2 from the spleen of wild type (WT) vs. Tyk2 knock out (KO) mice exposed to poly I:C compared to cells cultured in media.
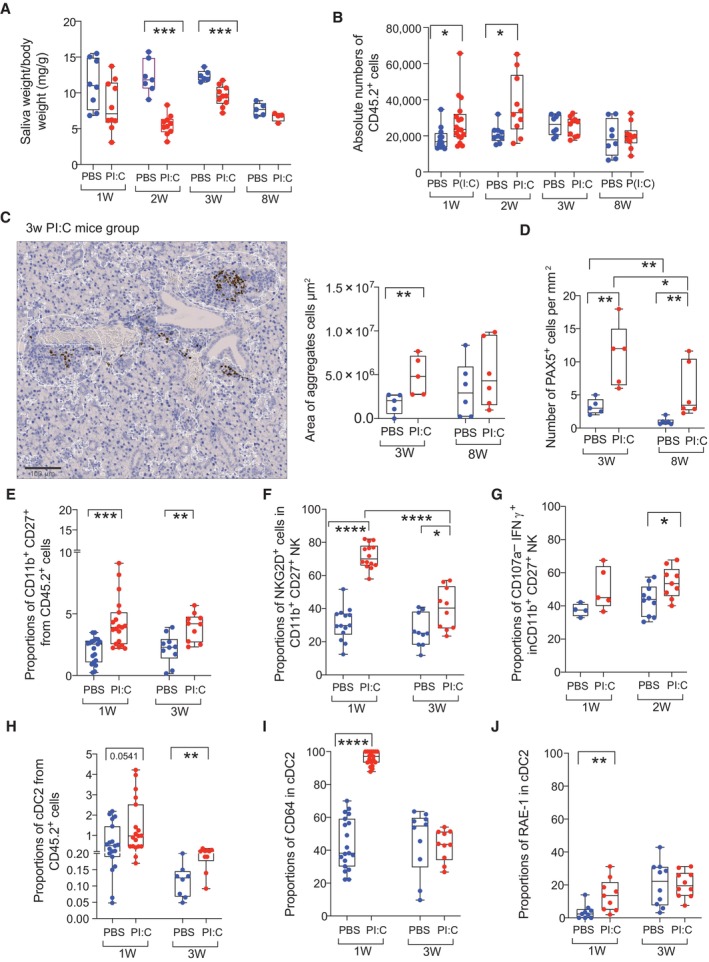
- A
Analysis of salivary gland function measured as saliva weight/body weight after Pilocarpine injection in mice treated with PBS (blue; biological replicates n = 8; n = 7; n = 6; n = 5) or poly I:C (red; biological replicates n = 10; n = 10; n = 10; n = 4) at 1, 2, 3, 8 weeks post injection, respectively.
- B
Absolute numbers of hematopoietic CD45.2 cells detected on homogenized submandibular salivary gland (SMSG) from mice injected with PBS (blue; biological replicates n = 19; n = 9; n = 8) and poly I:C (red; biological replicates n = 22, n = 10, n = 10; n = 10).
- C, D
Image of histological analysis of immune cell infiltrates and Pax5+ cells identifying B cells in SG from a representative mouse injected with poly I:C (C, left). Scale bar: 100 μm. Quantification of area of total immune infiltrates (C, right) and number of Pax5+ cells (D) detected in the SMSG from mice‐treated PBS (blue; biological replicates n = 5 and n = 6 for 3 and 8 weeks, respectively) or poly I:C (red; biological replicates, n = 5 and n = 6 for 3 and 8 weeks, respectively) is shown.
- E–G
Frequencies of CD11b+CD27+ NK1.1+ CD3− NK cells (E) and proportions of NKG2D+ (F) and CD107a− IFNγ+ (G) cells in this population in the SMSG of mice after 1 and 3 weeks after injection with PBS (blue; biological replicates n = 19 in E, F and n = 4 in G for week 1; n = 10 in E, F for week 3 and for week 2 in G) or poly I:C (red; biological replicates n = 19 in E, F and n = 5 in G for week 1; n = 10 in E–G for week 3).
- H–J
Proportions of CD11b+ CD11chi cDC2 (H), expression of CD64 (I) and RAE‐I (J) in this population infiltrated in the SMSG from mice after 1 and 3 weeks after injection with PBS (blue; biological replicates n = 19 in H, I and n = 9 in J for week 1; n = 8 in I and n = 10 in I, J for 3 weeks) and poly I:C (red; biological replicates n = 19 in H, I and n = 9 in J for week 1; n = 10 in H–J for week 3). Data from three independent experiments are included with biological replicates.
References
-
- Båve U, Nordmark G, Lövgren T, Rönnelid J, Cajander S, Eloranta ML, Alm GV, Rönnblom L (2005) Activation of the type I interferon system in primary Sjögren's syndrome: a possible etiopathogenic mechanism. Arthritis Rheum 52: 1185–1195 - PubMed
-
- Blokland SLM, van den Hoogen LL, Leijten EFA, Hartgring SAY, Fritsch R, Kruize AA, van Roon JAG, Radstake T (2019) Increased expression of Fas on group 2 and 3 innate lymphoid cells is associated with an interferon signature in systemic lupus erythematosus and Sjögren's syndrome. Rheumatology (Oxford) 58: 1740–1745 - PubMed
-
- Bodewes ILA, Huijser E, van Helden‐Meeuwsen CG, Tas L, Huizinga R, Dalm V, van Hagen PM, Groot N, Kamphuis S, van Daele PLA et al (2018) TBK1: a key regulator and potential treatment target for interferon positive Sjögren's syndrome, systemic lupus erythematosus and systemic sclerosis. J Autoimmun 91: 97–102 - PubMed
-
- Bodewes ILA, Björk A, Versnel MA, Wahren‐Herlenius M (2019) Innate immunity and interferons in the pathogenesis of Sjögren's syndrome. Rheumatology (Oxford) 60: 2561–2573 - PubMed
Publication types
MeSH terms
Substances
Associated data
- Actions
- Actions
Grants and funding
- 2017-T1/BMD-5396/Comunidad de Madrid (Community of Madrid)
- PEJD-2019-PRE/BMD-16851/Comunidad de Madrid (Community of Madrid)
- S2022/BMD-7209-INTEGRAMUNE/Comunidad de Madrid (Community of Madrid)
- EC | European Regional Development Fund (ERDF)
- Fundació la Marató de TV3 (Fundació la Marató)
- HR20-00218/'la Caixa' Foundation ('la Caixa')
- HR17-00016/'la Caixa' Foundation ('la Caixa')
- LCF/BQ/DR19/11740010/'la Caixa' Foundation ('la Caixa')
- RYC2018-024374-I/MEC | Agencia Estatal de Investigación (AEI)
- RD16/0011/0012/MEC | Instituto de Salud Carlos III (ISCIII)
- PI18/0371/MEC | Instituto de Salud Carlos III (ISCIII)
- CM21/00157/MEC | Instituto de Salud Carlos III (ISCIII)
- CM19/00149/MEC | Instituto de Salud Carlos III (ISCIII)
- PI21/01474/MEC | Instituto de Salud Carlos III (ISCIII)
- PI22/00428/MEC | Instituto de Salud Carlos III (ISCIII)
- RTI2018-097485-A-I00/Ministerio de Asuntos Económicos y Transformación Digital, Gobierno de España (MINECO)
- PID2021-127899OB-I00/Ministerio de Asuntos Económicos y Transformación Digital, Gobierno de España (MINECO)
LinkOut - more resources
Full Text Sources
Molecular Biology Databases
Research Materials
Miscellaneous
