. 2023 Dec 22;8(24):e172862.
doi: 10.1172/jci.insight.172862.

MAFB shapes human monocyte-derived macrophage response to SARS-CoV-2 and controls severe COVID-19 biomarker expression

Affiliations

MAFB shapes human monocyte-derived macrophage response to SARS-CoV-2 and controls severe COVID-19 biomarker expression

Miriam Simón-Fuentes et al. JCI Insight. .

Abstract

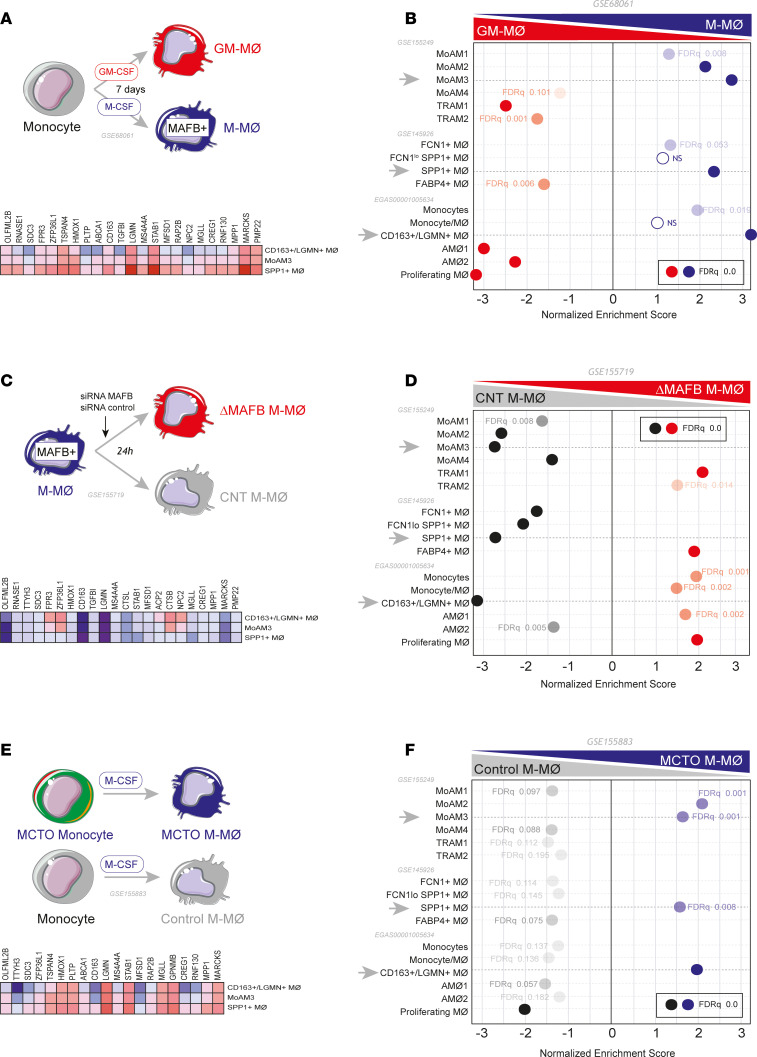
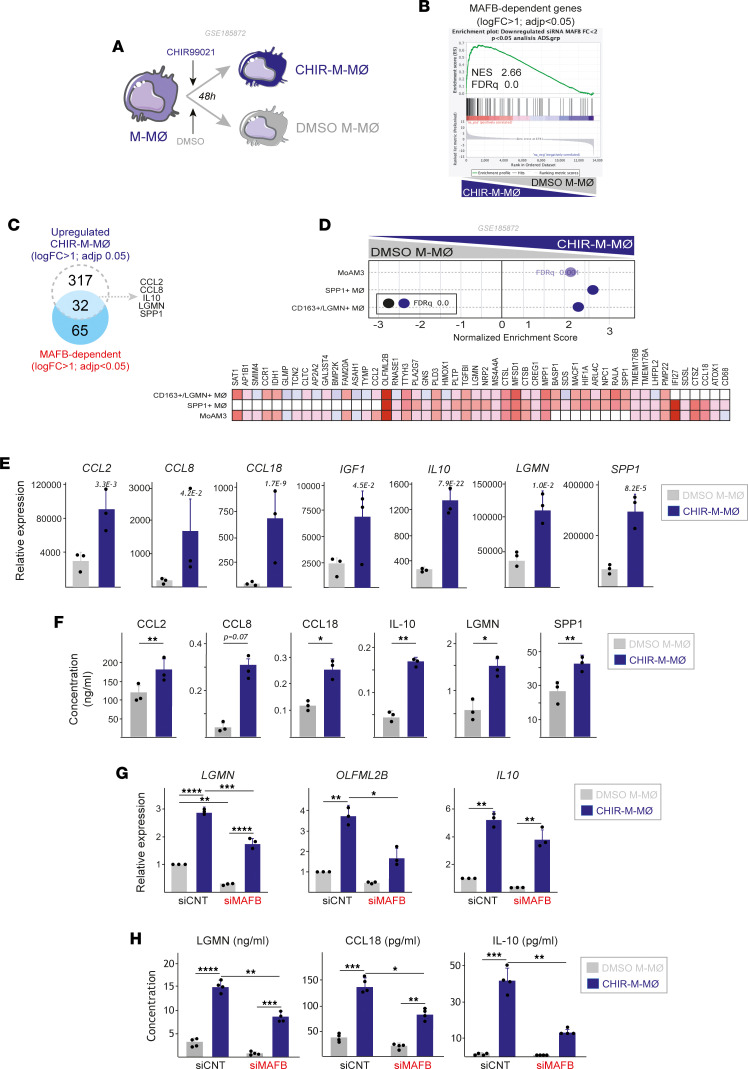
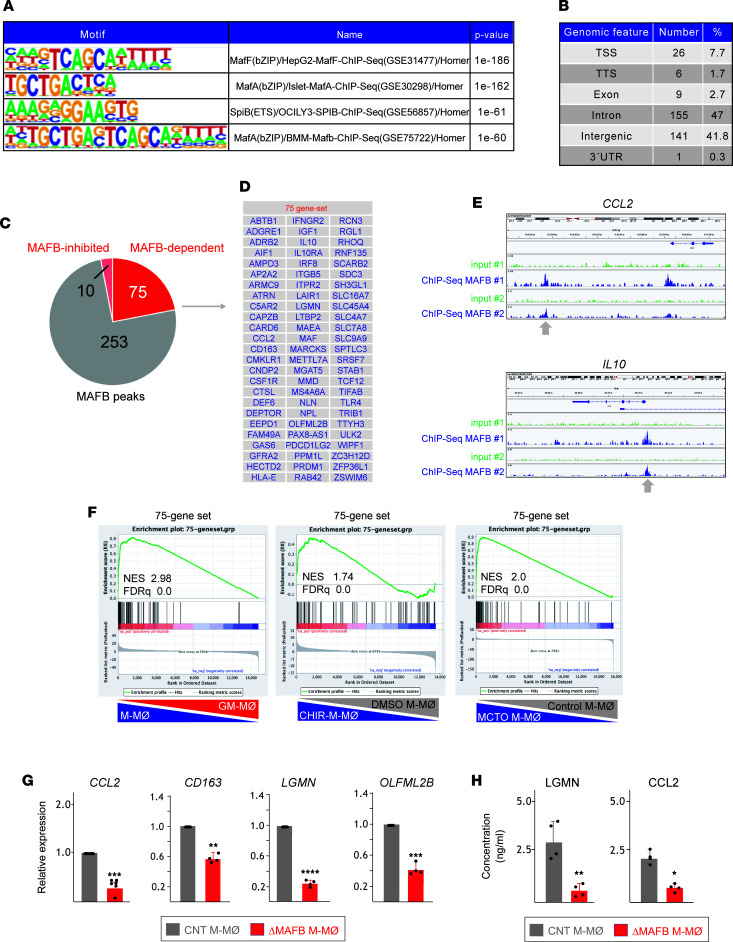
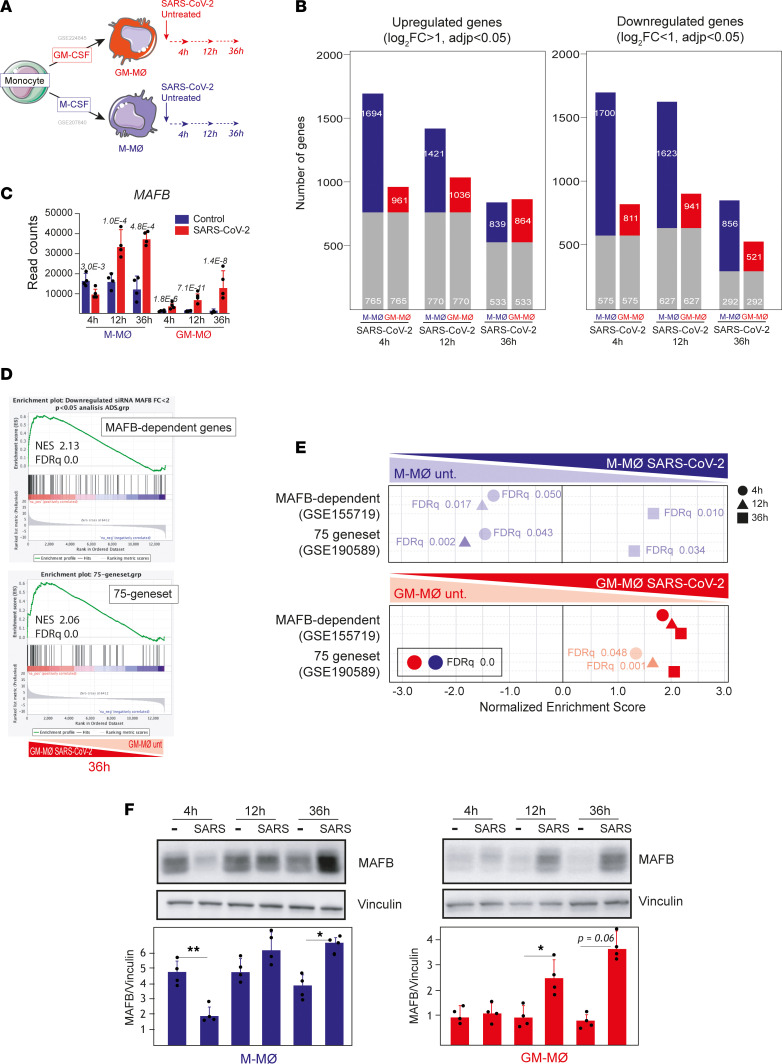
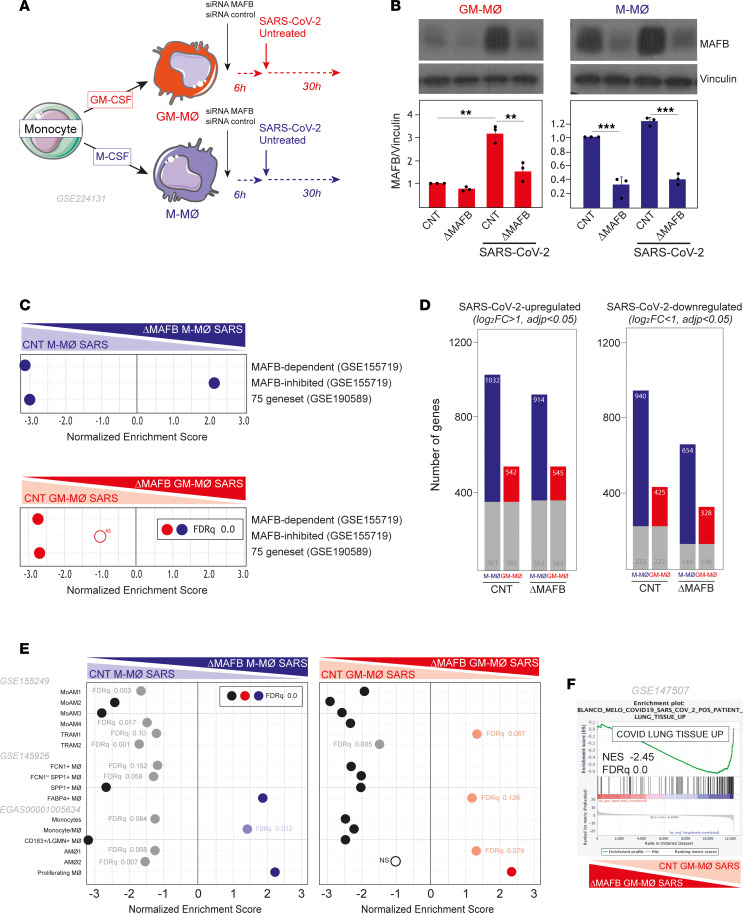
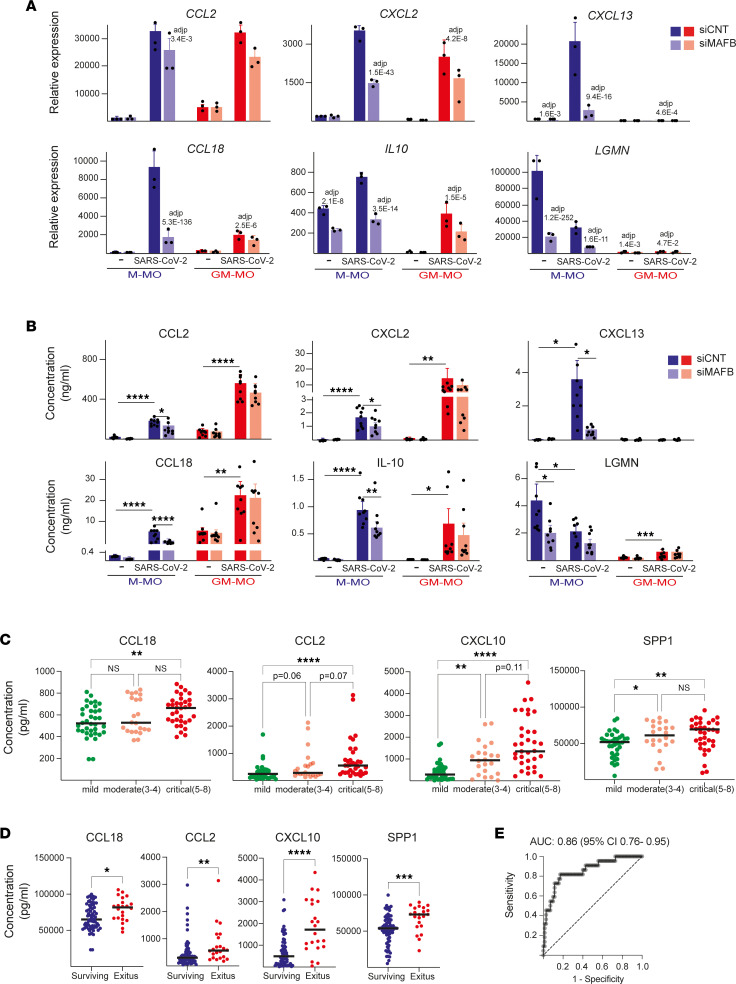
Monocyte-derived macrophages, the major source of pathogenic macrophages in COVID-19, are oppositely instructed by macrophage CSF (M-CSF) or granulocyte macrophage CSF (GM-CSF), which promote the generation of antiinflammatory/immunosuppressive MAFB+ (M-MØ) or proinflammatory macrophages (GM-MØ), respectively. The transcriptional profile of prevailing macrophage subsets in severe COVID-19 led us to hypothesize that MAFB shapes the transcriptome of pulmonary macrophages driving severe COVID-19 pathogenesis. We have now assessed the role of MAFB in the response of monocyte-derived macrophages to SARS-CoV-2 through genetic and pharmacological approaches, and we demonstrate that MAFB regulated the expression of the genes that define pulmonary pathogenic macrophages in severe COVID-19. Indeed, SARS-CoV-2 potentiated the expression of MAFB and MAFB-regulated genes in M-MØ and GM-MØ, where MAFB upregulated the expression of profibrotic and neutrophil-attracting factors. Thus, MAFB determines the transcriptome and functions of the monocyte-derived macrophage subsets that underlie pulmonary pathogenesis in severe COVID-19 and controls the expression of potentially useful biomarkers for COVID-19 severity.

Keywords: COVID-19; Cellular immune response; Immunology; Macrophages; Molecular pathology.


Figures

Figure 1
Figure 1. Overexpression of MAFB-dependent genes in the transcriptome of pathogenic pulmonary macrophage subsets in severe COVID-19.
(A) Schematic representation of the generation of M-MØ and GM-MØ. (B) Summary of GSEA of the gene sets that characterize the macrophage subsets identified in severe COVID-19 (39, 48, 49) on the ranked comparison of the transcriptomes of M-MØ versus GM-MØ (GSE68061). Leading edge analysis of the GSEA of the genes that define the MoAM3, SPP1+, or CD163+/LGMN+ subsets on the ranked comparison of the transcriptomes of M-MØ versus GM-MØ is shown under schematic representation. (C) Schematic representation of the generation of ΔMAFB M-MØ and control M-MØ (CNT M-MØ) before RNA isolation and RNA-Seq (GSE155719). (D) Summary of GSEA of the gene sets that characterize the macrophage subsets identified in severe COVID-19 (39, 48, 49) on the ranked comparison of the transcriptomes of ΔMAFB M-MØ versus CNT M-MØ. Leading edge analysis of the GSEA of the genes that define the MoAM3, SPP1+, or CD163+/LGMN+ subsets on the ranked comparison of the transcriptomes of ΔMAFB M-MØ versus CNT M-MØ is shown under schematic representation. (E) Schematic representation of the in vitro generation of M-MØ from a patient with MCTO (MCTO M-MØ) or healthy controls (Control M-MØ) before RNA isolation and RNA-Seq (GSE155883). (F) Summary of GSEA of the gene sets that characterize the macrophage subsets identified in severe COVID-19 (39, 48, 49) on the ranked comparison of the transcriptomes of MCTO M-MØ versus Control M-MØ. Leading edge analysis of the GSEA of the genes that define the MoAM3, SPP1+, or CD163+/LGMN+ subsets on the ranked comparison of the transcriptomes of MCTO M-MØ versus Control M-MØ is shown under schematic representation.
Figure 2
Figure 2. GSK3β inhibition upregulates MAFB-dependent genes and the expression of the gene sets that define pathogenic macrophage subsets in severe COVID-19.
(A) Schematic representation of the treatment of M-MØ to CHIR99021 (10 μM, CHIR-M-MØ) or DMSO (DMSO M-MØ). (B) GSEA of the MAFB-dependent gene set on the comparison of CHIR-M-MØ and DMSO M-MØ transcriptomes. (C) Overlap between the genes upregulated (|log2FC| > 1; Padj < 0.05) in CHIR-M-MØ (relative to DMSO M-MØ) and MAFB-dependent genes. (D) GSEA summary of gene sets characterizing macrophage subsets identified in severe COVID-19 (39, 48, 49) on the comparison of CHIR-M-MØ and DMSO M-MØ transcriptomes. The source of the original data is indicated. Leading edge analysis of the GSEA of the genes that define the MoAM3, SPP1+, or CD163+/LGMN+ subsets on the ranked comparison of the transcriptomes of CHIR-M-MØ versus DMSO M-MØ is shown in the bottom panel. (E) Relative expression of the indicated MAFB-dependent genes in CHIR-M-MØ and DMSO M-MØ (GSE185872). Mean ± SEM of 3 independent donors are shown, with indication of the Padj. Statistical significance was calculated using the R package DESeq2. (F) Production of soluble factors by CHIR-M-MØ and DMSO M-MØ determined by ELISA. Mean ± SEM of 3 independent donors are shown (*P < 0.05; **P < 0.01). Statistical significance was calculated using paired ratio t test (2 tailed). (G) Relative mRNA levels of specified genes (LGMN, OLFML2B, IL10) in M-MØ after indicated treatments, with mean ± SEM of 3 independent samples and significance (*P < 0.05; **P < 0.01) determined by 1-way ANOVA with Tukey multiple-comparison test. (H) Production of LGMN, CCL18, and IL10 by M-MØ after indicated treatments, as determined by ELISA, with mean ± SEM of 4 independent samples and significance (*P < 0.05; **P < 0.01; ***P < 0.005) calculated by 1-way ANOVA (Tukey multiple-comparison test).
Figure 3
Figure 3. Identification of MAFB-binding elements in antiinflammatory M-MØ.
(A) Motif enrichment within ChIP-Seq MAFB peaks, with indication of the binding sequence position weight matrices, and their corresponding statistical significance. (B) Summary of the location of the identified MAFB-binding sites. (C) Comparison of the annotated genes corresponding to ChIP-Seq peaks and MAFB-dependent and MAFB-inhibited genes. (D) List of the 75 genes (75-gene set) with MAFB-binding elements with expression downregulated in ΔMAFB M-MØ (MAFB-inhibited). (E) Viewing alignments of the MAFB-binding profiles associated with CCL2 and IL10 genes using the Integrative Genomics Viewer. Each track illustrates a different sample and shows the peaks obtained in 2 independent experiments with anti-MAFB antibody (ChIP-Seq MAFB #1 and MAFB #2) and the corresponding input controls (input #1, input #2). (F) GSEA of the 75-gene set on the ranked comparison of the transcriptomes of M-MØ versus GM-MØ (GSE68061) (left panel), CHIR-M-MØ versus DMSO M-MØ (GSE185872) (middle panel), and MCTO M-MØ versus Control MØ (GSE155883) (right panel). Normalized Enrichment Score (NES) and FDR q value is indicated. (G) Relative mRNA expression of the indicated genes in ΔMAFB M-MØ and CNT M-MØ. Mean ± SEM of 4–6 independent samples are shown (*P < 0.05; **P < 0.01; ***P < 0.001; ****P < 0.0001). Statistical significance was calculated using paired t test (2-tailed). (H) Production of LGMN and CCL2 by ΔMAFB M-MØ and CNT M-MØ, as determined by ELISA. Mean ± SEM of 4 independent samples are shown (*P < 0.05; **P < 0.01). Statistical significance was calculated using paired ratio t test (2-tailed).
Figure 4
Figure 4. SARS-CoV-2 infection of human monocyte–derived macrophages upregulates the expression of MAFB and MAFB-dependent genes.
(A) Schematic representation of the generation of SARS-CoV-2–infected M-MØ (M-MØ SARS-CoV-2) and GM-MØ (GM-MØ SARS-CoV-2), and their corresponding untreated controls at different times before RNA isolation and RNA-Seq (GSE207840) using 4 independent samples. (B) Number of differentially expressed genes ([log2FC] > 1; Padj < 0.05) in SARS-CoV-2–infected macrophages (M-MØ SARS-CoV-2 and GM-MØ SARS-CoV-2) relative to uninfected controls at 4, 12, and 36 hours. Gray columns indicate the number of genes regulated in both M-MØ and GM-MØ. (C) MAFB gene expression in SARS-CoV-2–exposed or untreated M-MØ and GM-MØ at the indicated time points after viral infection and as determined in RNA-Seq experiments (GSE207840). Padj values (relative to untreated samples) are indicated in each case. Statistical significance was calculated using the R-package DESeq2. (D) GSEA of MAFB-dependent genes (GSE155719) (upper panel) and the 75-gene set (GSE190589) (lower panel) on the ranked comparison of the transcriptomes of GM-MØ SARS-CoV-2 versus untreated GM-MØ, 36 hours after viral exposure. (E) Summary of GSEA of MAFB-dependent genes (GSE155719) and the 75-gene set (GSE190589) on the ranked comparison of the transcriptomes of M-MØ SARS-CoV-2 versus untreated M-MØ (upper panel) or GM-MØ SARS-CoV-2 versus untreated GM-MØ (lower panel), determined at 4, 12, and 36 hours after viral exposure. FDR q values are indicated in each case. (F) MAFB protein levels in M-MØ SARS-CoV-2 (left panel) and GM-MØ SARS-CoV-2 (right panel) at the indicated time points after exposure to SARS-CoV-2 (SARS) or to SARS-CoV-2 VLPs, as determined by Western blot. Vinculin protein levels were determined as protein loading control. Mean ± SEM of the MAFB/vinculin protein ratios from 4 independent experiments are shown (*P < 0.05; **P < 0.01). Statistical significance was calculated using 1-way ANOVA with Tukey multiple-comparison test. A representative Western blot experiment is shown in each case.
Figure 5
Figure 5. MAFB silencing drastically modifies the response of human macrophages to SARS-CoV-2.
(A) Schematic representation of the transfection of M-MØ or GM-MØ with a MAFB-specific or control siRNA before SARS-CoV-2 exposure to generate ΔMAFB M-MØ SARS, ΔMAFB GM-MØ SARS, and their controls. (B) MAFB protein levels in ΔMAFB M-MØ SARS, ΔMAFB GM-MØ SARS, and their controls, as determined by Western blot, with vinculin as a loading control. Mean ± SEM of the MAFB/vinculin protein ratios from 3 independent experiments are shown (*P < 0.05; **P < 0.01; ***P < 0.001). Statistical significance was calculated using 1-way ANOVA with Tukey multiple-comparison test. A representative Western blot experiment is shown. (C) Summary of GSEA of MAFB-dependent genes, MAFB-inhibited genes (GSE155719), and the 75-gene set (GSE190589) on the ranked comparison of the transcriptomes of ΔMAFB M-MØ SARS and CNT M-MØ SARS (upper panel) or ΔMAFB GM-MØ SARS and CNT GM-MØ SARS (lower panel). Except where indicated, FDR q = 0.0 in each case. (D) Number of differentially expressed genes ([log2FC] > 1; Padj < 0.05) in SARS-CoV-2–infected macrophages (ΔMAFB M-MØ SARS and ΔMAFB GM-MØ SARS) relative to controls (CNT M-MØ SARS and CNT GM-MØ SARS). Gray columns indicate genes regulated in both M-MØ and GM-MØ. (E) Summary of GSEA of the gene sets characterizing macrophage subsets identified in severe COVID-19 (39, 48, 49) on the ranked comparison of the transcriptomes of ΔMAFB M-MØ SARS and CNT M-MØ SARS (left panel) or ΔMAF GM-MØ SARS versus CNT GM-MØ SARS (right panel). (F) GSEA of the genes strongly upregulated (log2[FC] > 3.58; Padj<0.05) in postmortem lung tissue from patients with COVID-19 (“COVID Lung Tissue UP”; GSE147507) (60) on the ranked comparison of the transcriptomes of ΔMAFB GM-MØ SARS versus CNT GM-MØ SARS. In all panels, FDR q values and the source of the original gene sets are indicated.
Figure 6
Figure 6. MAFB contributes to the expression of profibrotic and neutrophil-recruiting chemokines in human macrophages exposed to SARS-CoV-2.
(A) Relative mRNA levels of the indicated genes in ΔMAFB M-MØ SARS, ΔMAFB GM-MØ SARS, and the corresponding controls, as determined by RNA-Seq. Mean ± SEM of 3 independent samples are shown. Padj of the comparison of macrophages with or without MAFB knockdown is shown. Statistical significance was calculated using the R-package DESeq2. (B) Production of the indicated soluble factors in ΔMAFB M-MØ SARS, ΔMAFB GM-MØ SARS, and the corresponding controls, as determined by ELISA. Mean ± SEM of 9 independent samples are shown (*P < 0.05; **P < 0.01; ***P < 0.001, ****P < 0.0001). Statistical significance was calculated using 1-way ANOVA with Tukey multiple-comparison test. (C and D) Concentration of CCL2, CCL18, SPP1, and CXCL10 in plasma from a cohort of 92 patients with COVID-19 grouped according to their OMS classification 14 days after hospital admission (C) or mortality (D). Horizontal lines represent the medians (*P < 0.05; **P < 0.01; ***P < 0.001; ****P < 0.0001). For C, statistical significance (P values) was obtained using the Kruskal–Wallis test followed by pairwise comparisons using the Dunn’s test. For D, statistical significance (P values) was obtained using the 2-tailed Mann-Whitney U test. (E) ROC curve estimated using the plasma cytokine levels of SPP1, CCL18, and CXCL10 on hospital admission for patient survival or death during hospitalization. Death and survival predicted powers were estimated as 66.67% and 84.42%, respectively. P < 0.0001 for the parameters estimated. Values for AUC and its 95% CI are indicated.

References

    1. Dick SA, et al. Three tissue resident macrophage subsets coexist across organs with conserved origins and life cycles. Sci Immunol. 2022;7(67):eabf7777. doi: 10.1126/sciimmunol.abf7777. - DOI - PubMed
    1. Mulder K, et al. Cross-tissue single-cell landscape of human monocytes and macrophages in health and disease. Immunity. 2021;54(8):1883–1900. doi: 10.1016/j.immuni.2021.07.007. - DOI - PubMed
    1. Hoeffel G, Ginhoux F. Fetal monocytes and the origins of tissue-resident macrophages. Cell Immunol. 2018;330:5–15. doi: 10.1016/j.cellimm.2018.01.001. - DOI - PubMed
    1. Ruffell B, Coussens LM. Macrophages and therapeutic resistance in cancer. Cancer Cell. 2015;27(4):462–472. doi: 10.1016/j.ccell.2015.02.015. - DOI - PMC - PubMed
    1. Lavin Y, et al. Regulation of macrophage development and function in peripheral tissues. Nat Rev Immunol. 2015;15(12):731–744. doi: 10.1038/nri3920. - DOI - PMC - PubMed

Publication types

MeSH terms