

Antibiotic use in pediatric acute care hospitals: an analysis of antibiotic consumption data from Germany, 2013-2020
- PMID: 37917396
- PMCID: PMC11143023
- DOI: 10.1007/s15010-023-02112-w
Antibiotic use in pediatric acute care hospitals: an analysis of antibiotic consumption data from Germany, 2013-2020
Abstract
Background: Antimicrobial stewardship (AMS) programs are effective tools for improving antibiotic prescription quality. Their implementation requires the regular surveillance of antibiotic consumption at the patient and institutional level. Our study captured and analyzed antibiotic consumption density (ACD) for hospitalized pediatric patients.
Method: We collected antibacterial drug consumption data for 2020 from hospital pharmacies at 113 pediatric departments of acute care hospitals in Germany. ACD was calculated as defined daily dose (DDD, WHO/ATC Index 2019) per 100 patient days (pd). In addition, we analyzed the trends in antibiotic use during 2013-2020.
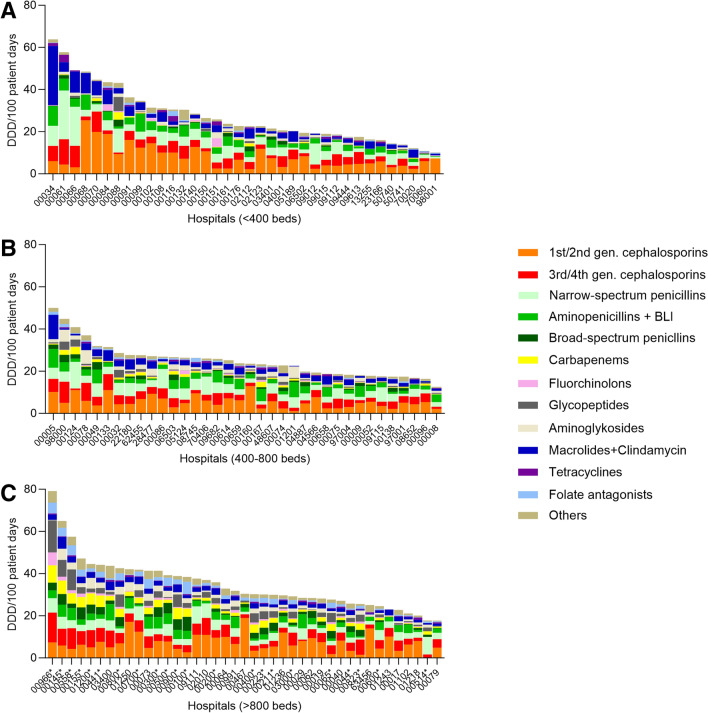
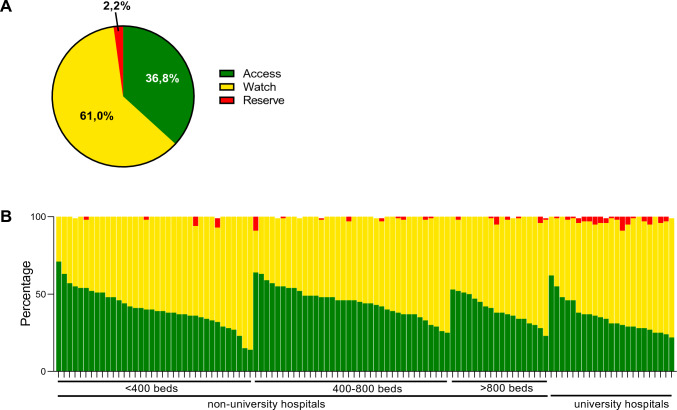
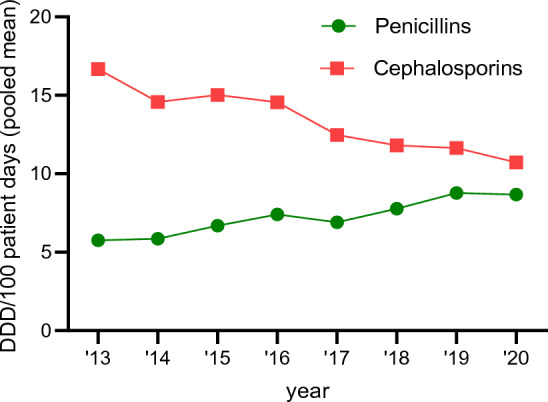
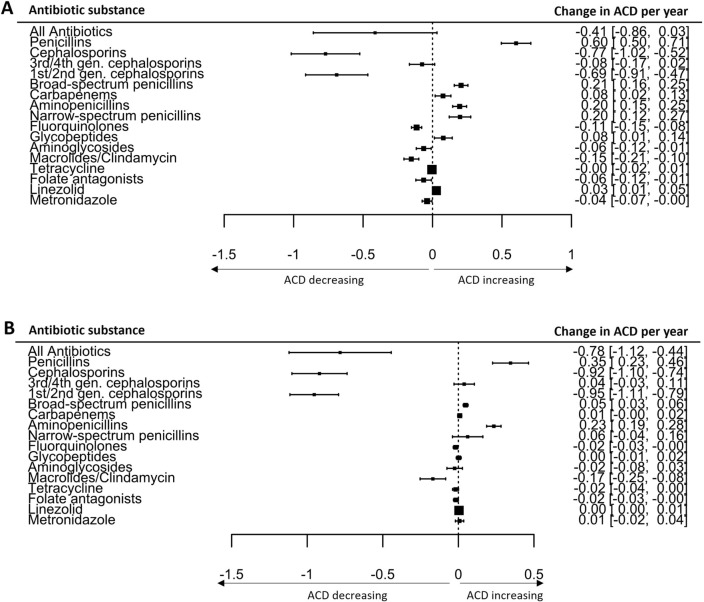
Results: In 2020, median ACD across all participating hospitals was 26.7 DDD/100 pd, (range: 10.1-79.2 DDD/100 pd). It was higher at university vs. non-university hospitals (38.6 vs. 25.2 DDD/100 pd, p < 0.0001). The highest use densities were seen on oncology wards and intensive care units at university hospitals (67.3 vs. 38.4 DDD/100 pd). During 2013-2020, overall ACD declined (- 10%) and cephalosporin prescriptions also decreased (- 36%). In 2020, cephalosporins nevertheless remained the most commonly dispensed class of antibiotics. Interhospital variability in cephalosporin/penicillin ratio was substantial. Antibiotics belonging to WHO AWaRe "Watch" and "Reserve" categories, including broad-spectrum penicillins (+ 31%), linezolid (+ 121%), and glycopeptides (+ 43%), increased over time.
Conclusion: Significant heterogeneity in ACD and prescription of different antibiotic classes as well as high prescription rates for cephalosporins and an increased use of reserve antibiotics indicate improvable antibiotic prescribing quality. AMS programs should urgently prioritize these issues to reduce antimicrobial resistance.
Keywords: Antibiotic consumption; Defined daily dose; Pediatric hospitals; Pharmacy prescription data; Recommended daily dose.
© 2023. The Author(s).
Conflict of interest statement
The authors declare that the research was conducted in the absence of any commercial or financial relationships that might be construed as a potential conflict of interest.
Figures

References
MeSH terms
Substances
Grants and funding
LinkOut - more resources
Full Text Sources
Medical
Research Materials
