. 2023 Nov 17;382(6672):820-828.
doi: 10.1126/science.adf4154. Epub 2023 Nov 2.

Autoregulatory control of mitochondrial glutathione homeostasis

Affiliations

Autoregulatory control of mitochondrial glutathione homeostasis

Yuyang Liu et al. Science. .

Abstract

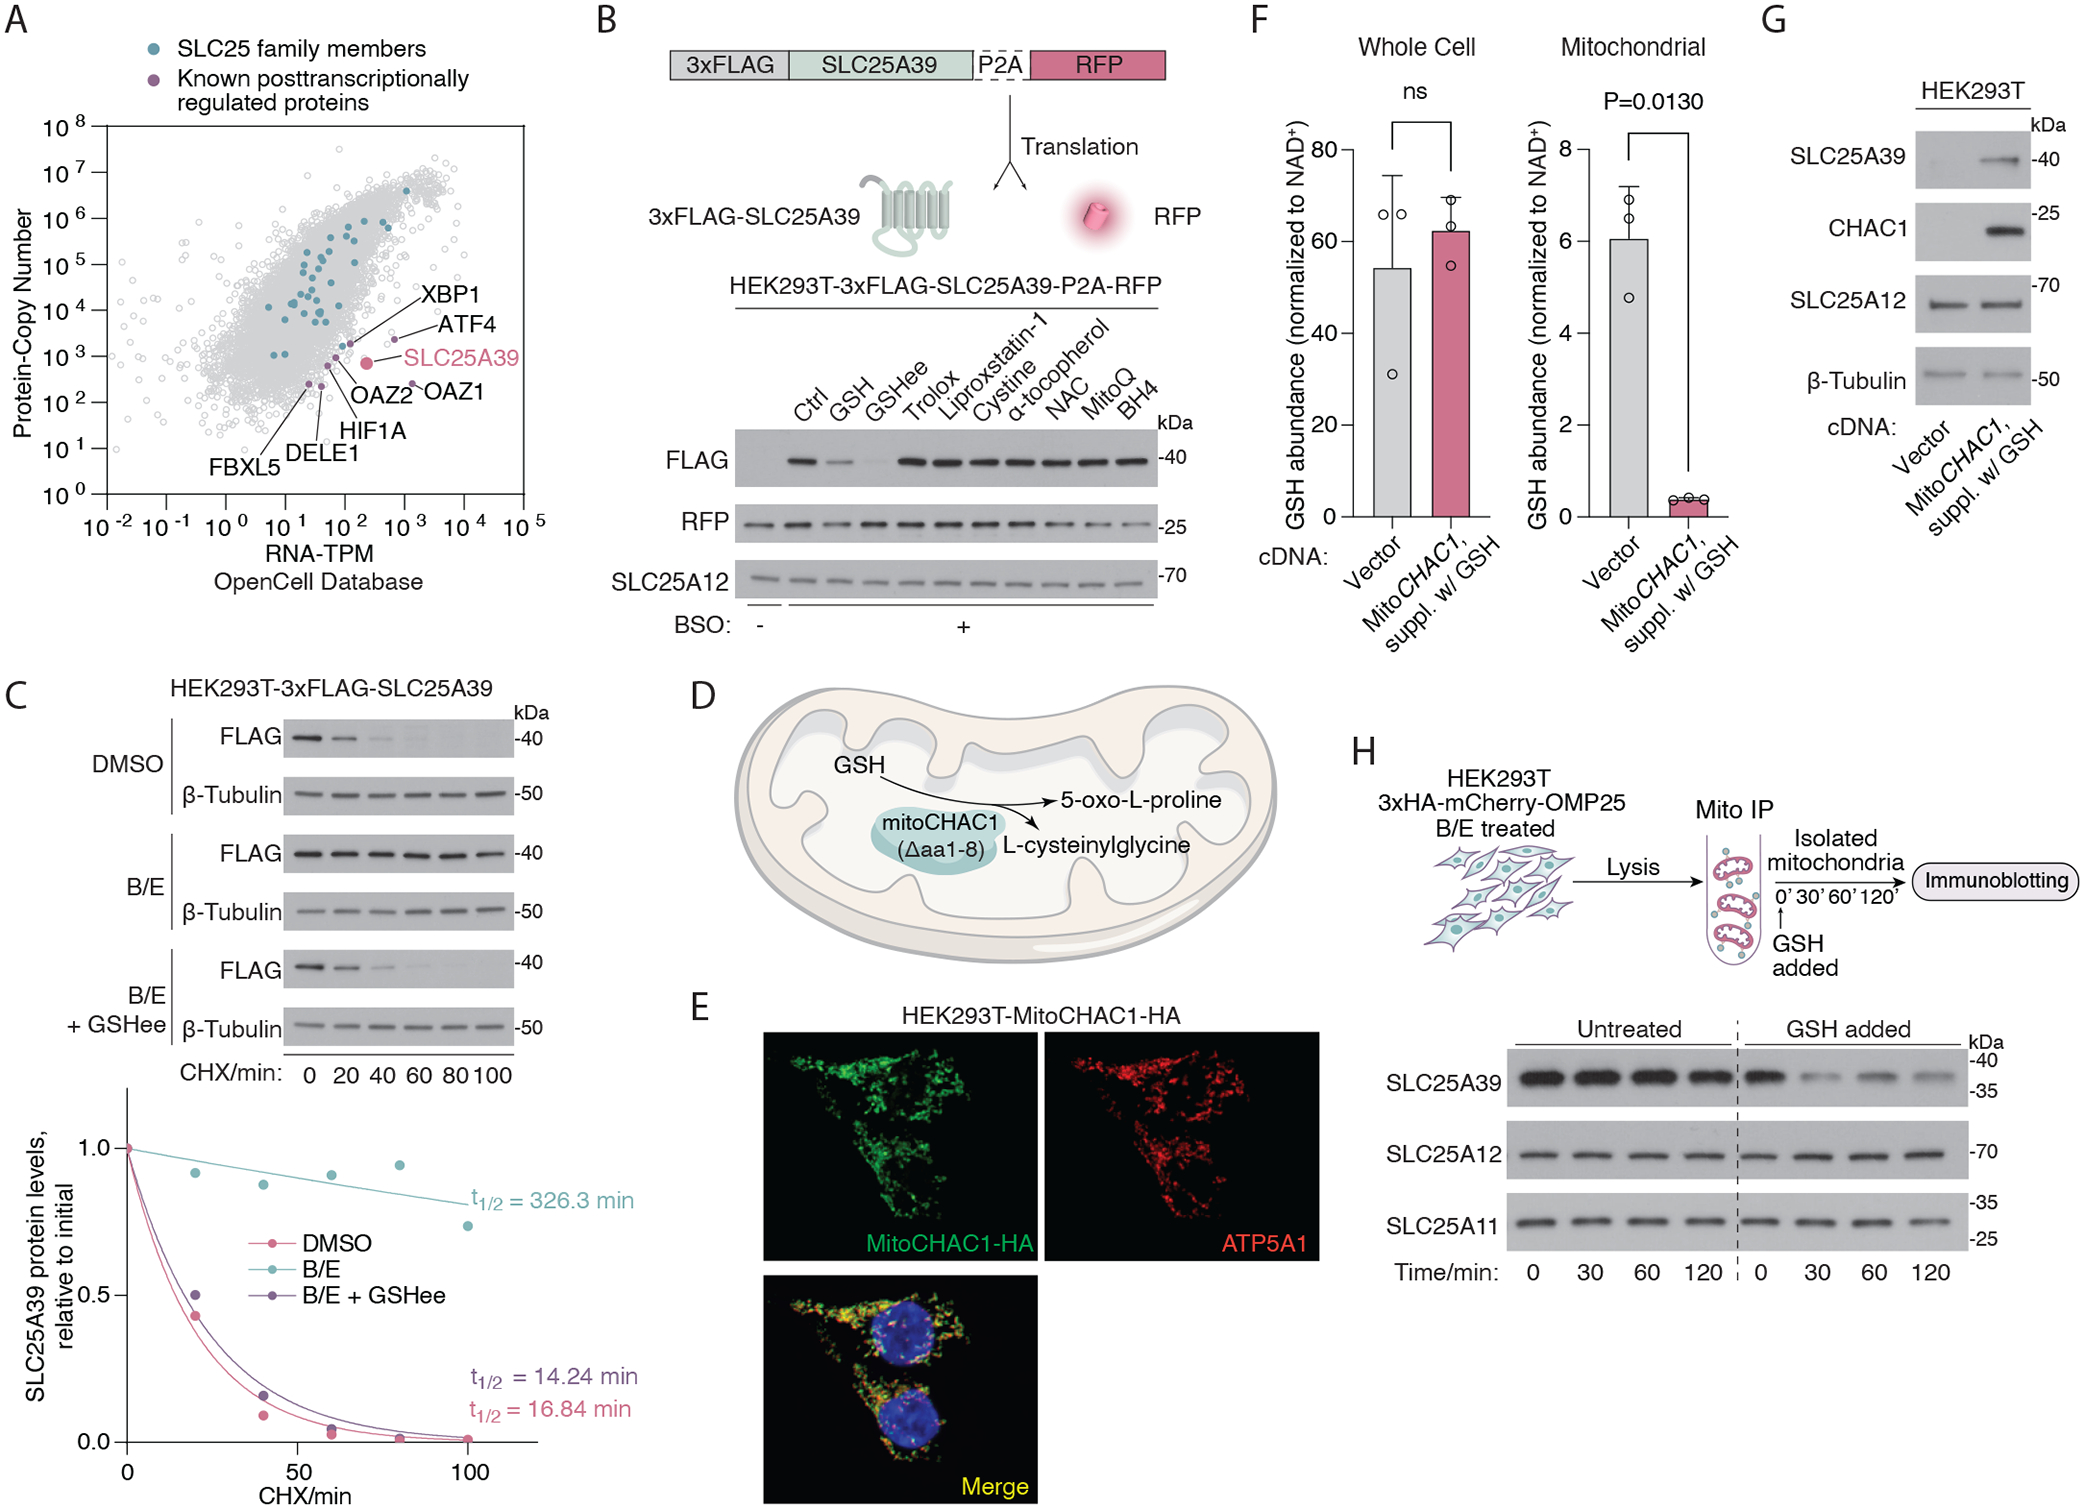
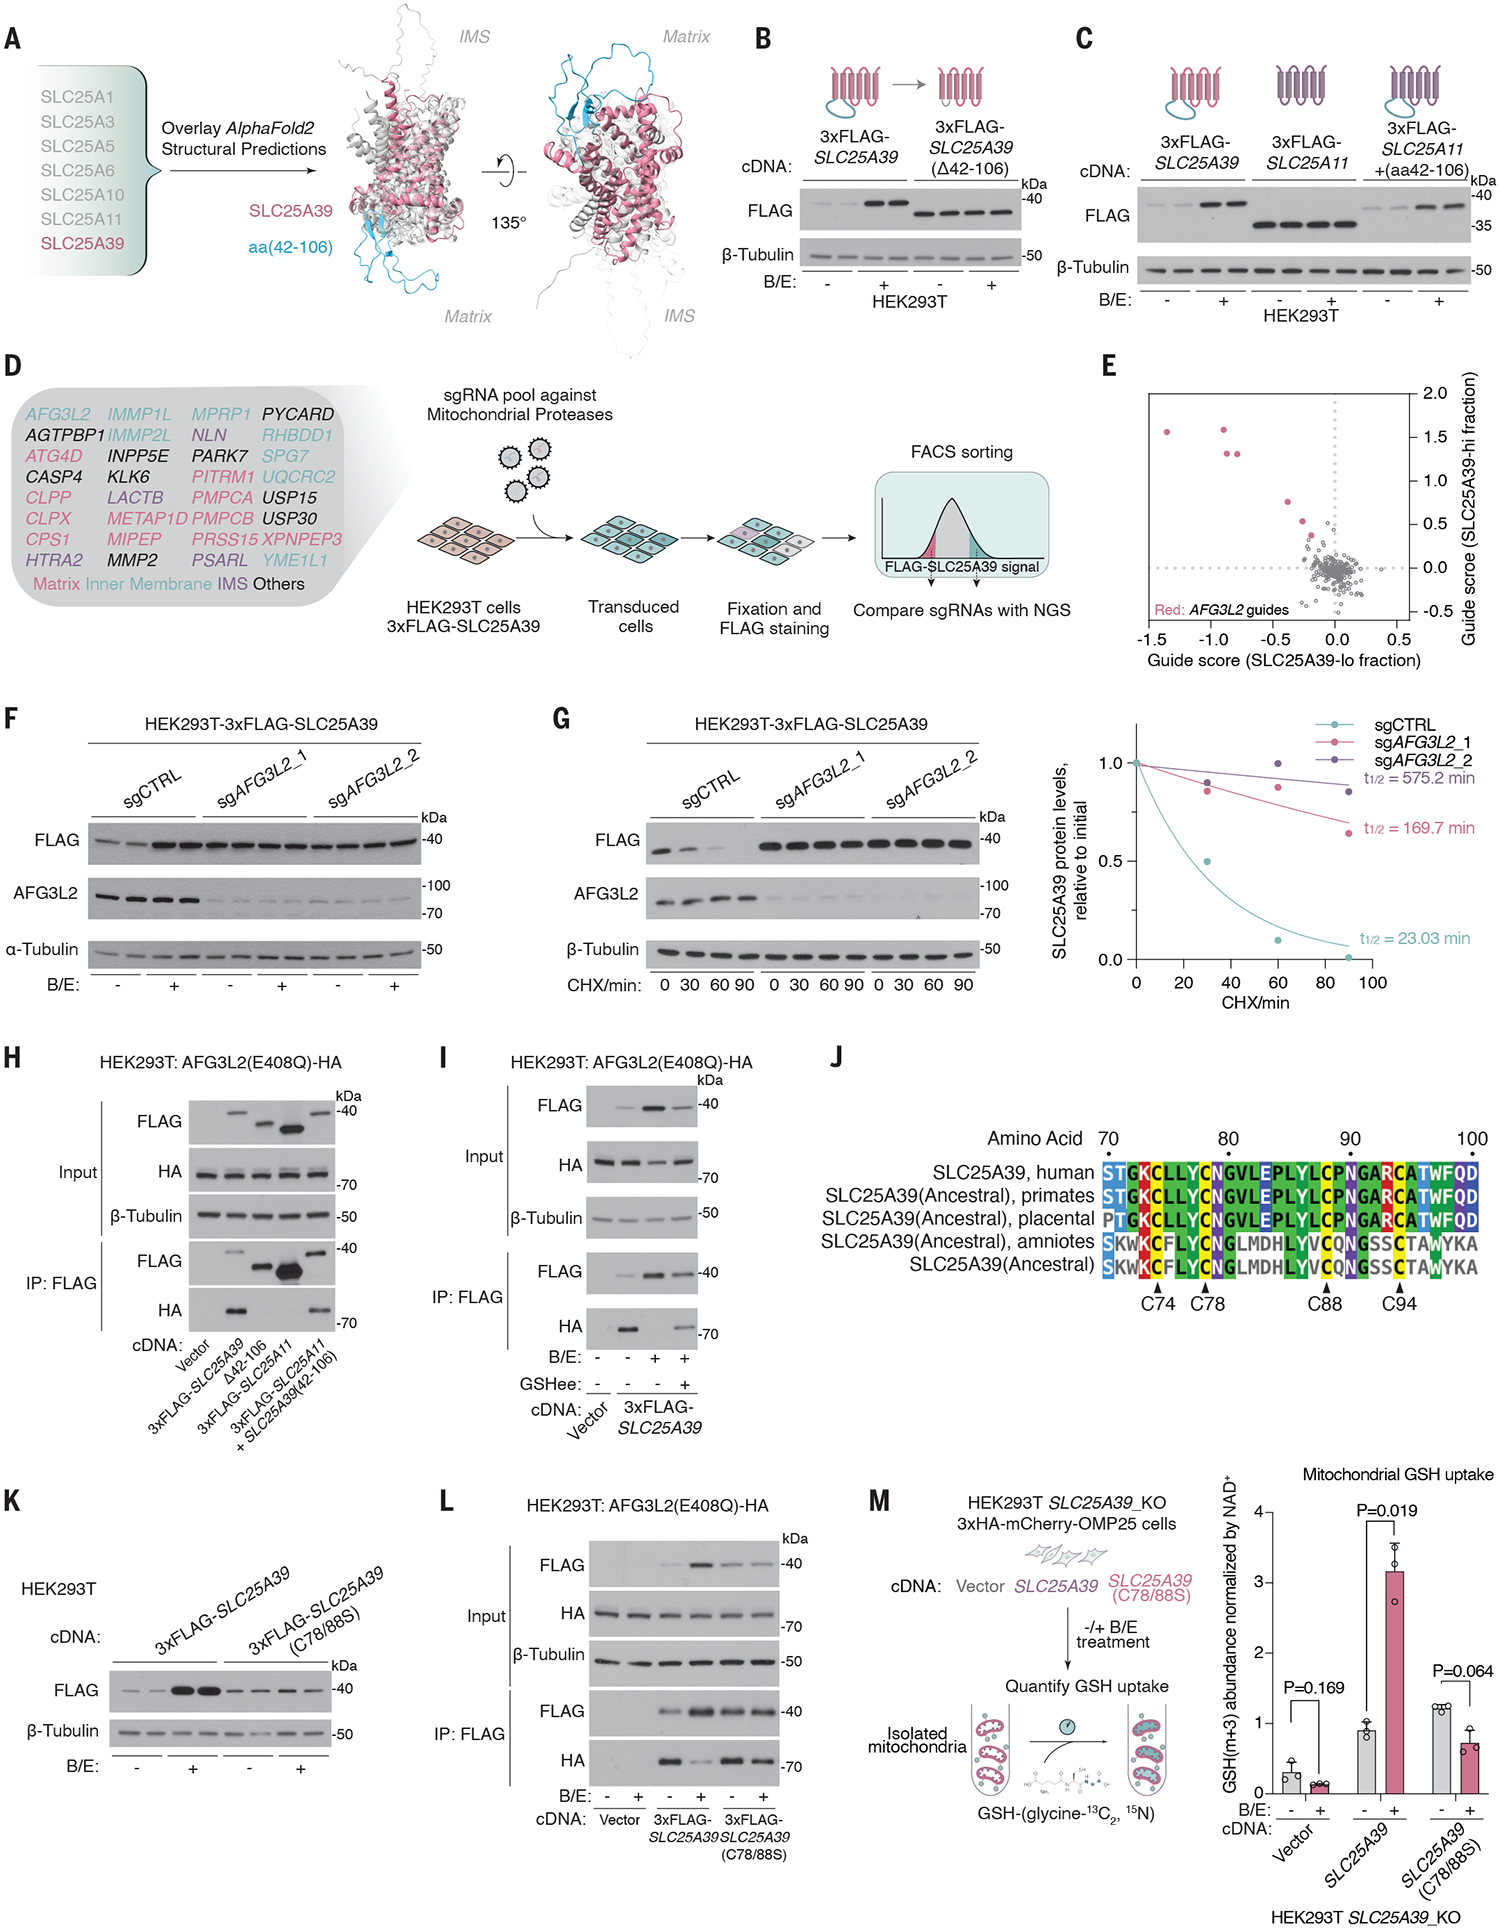
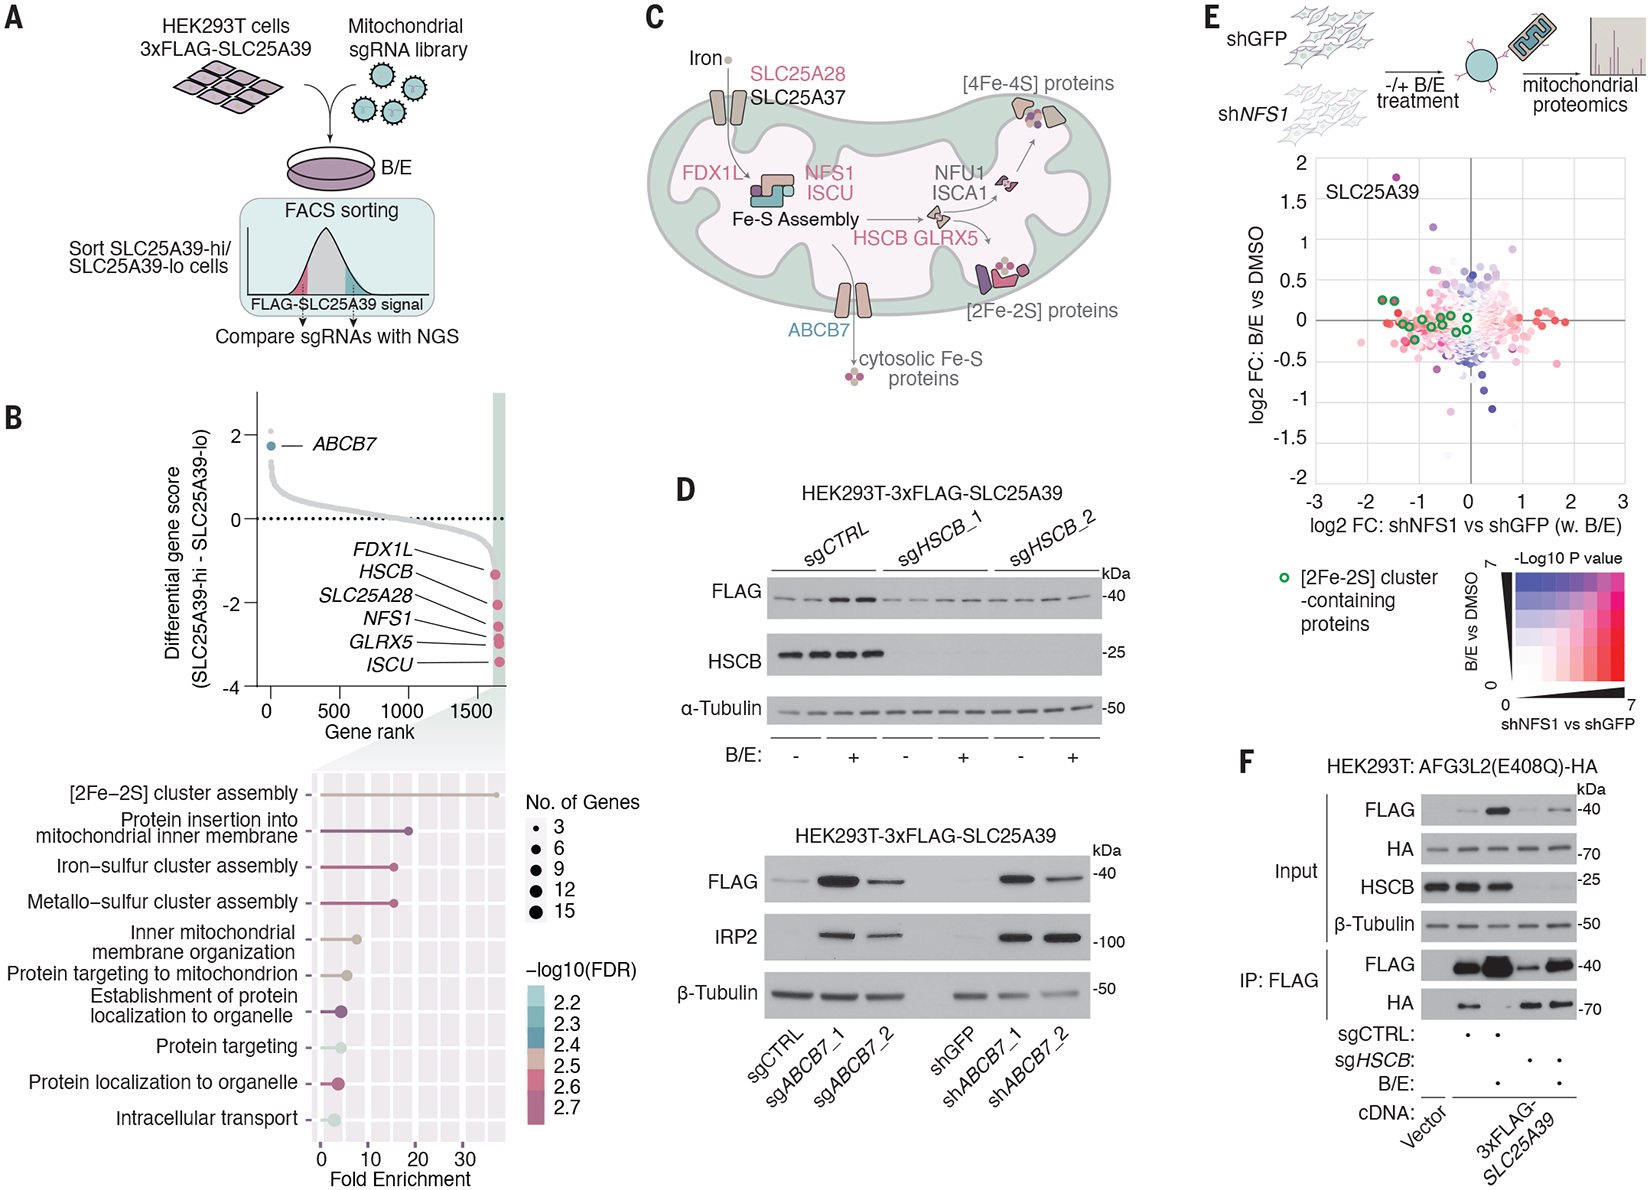
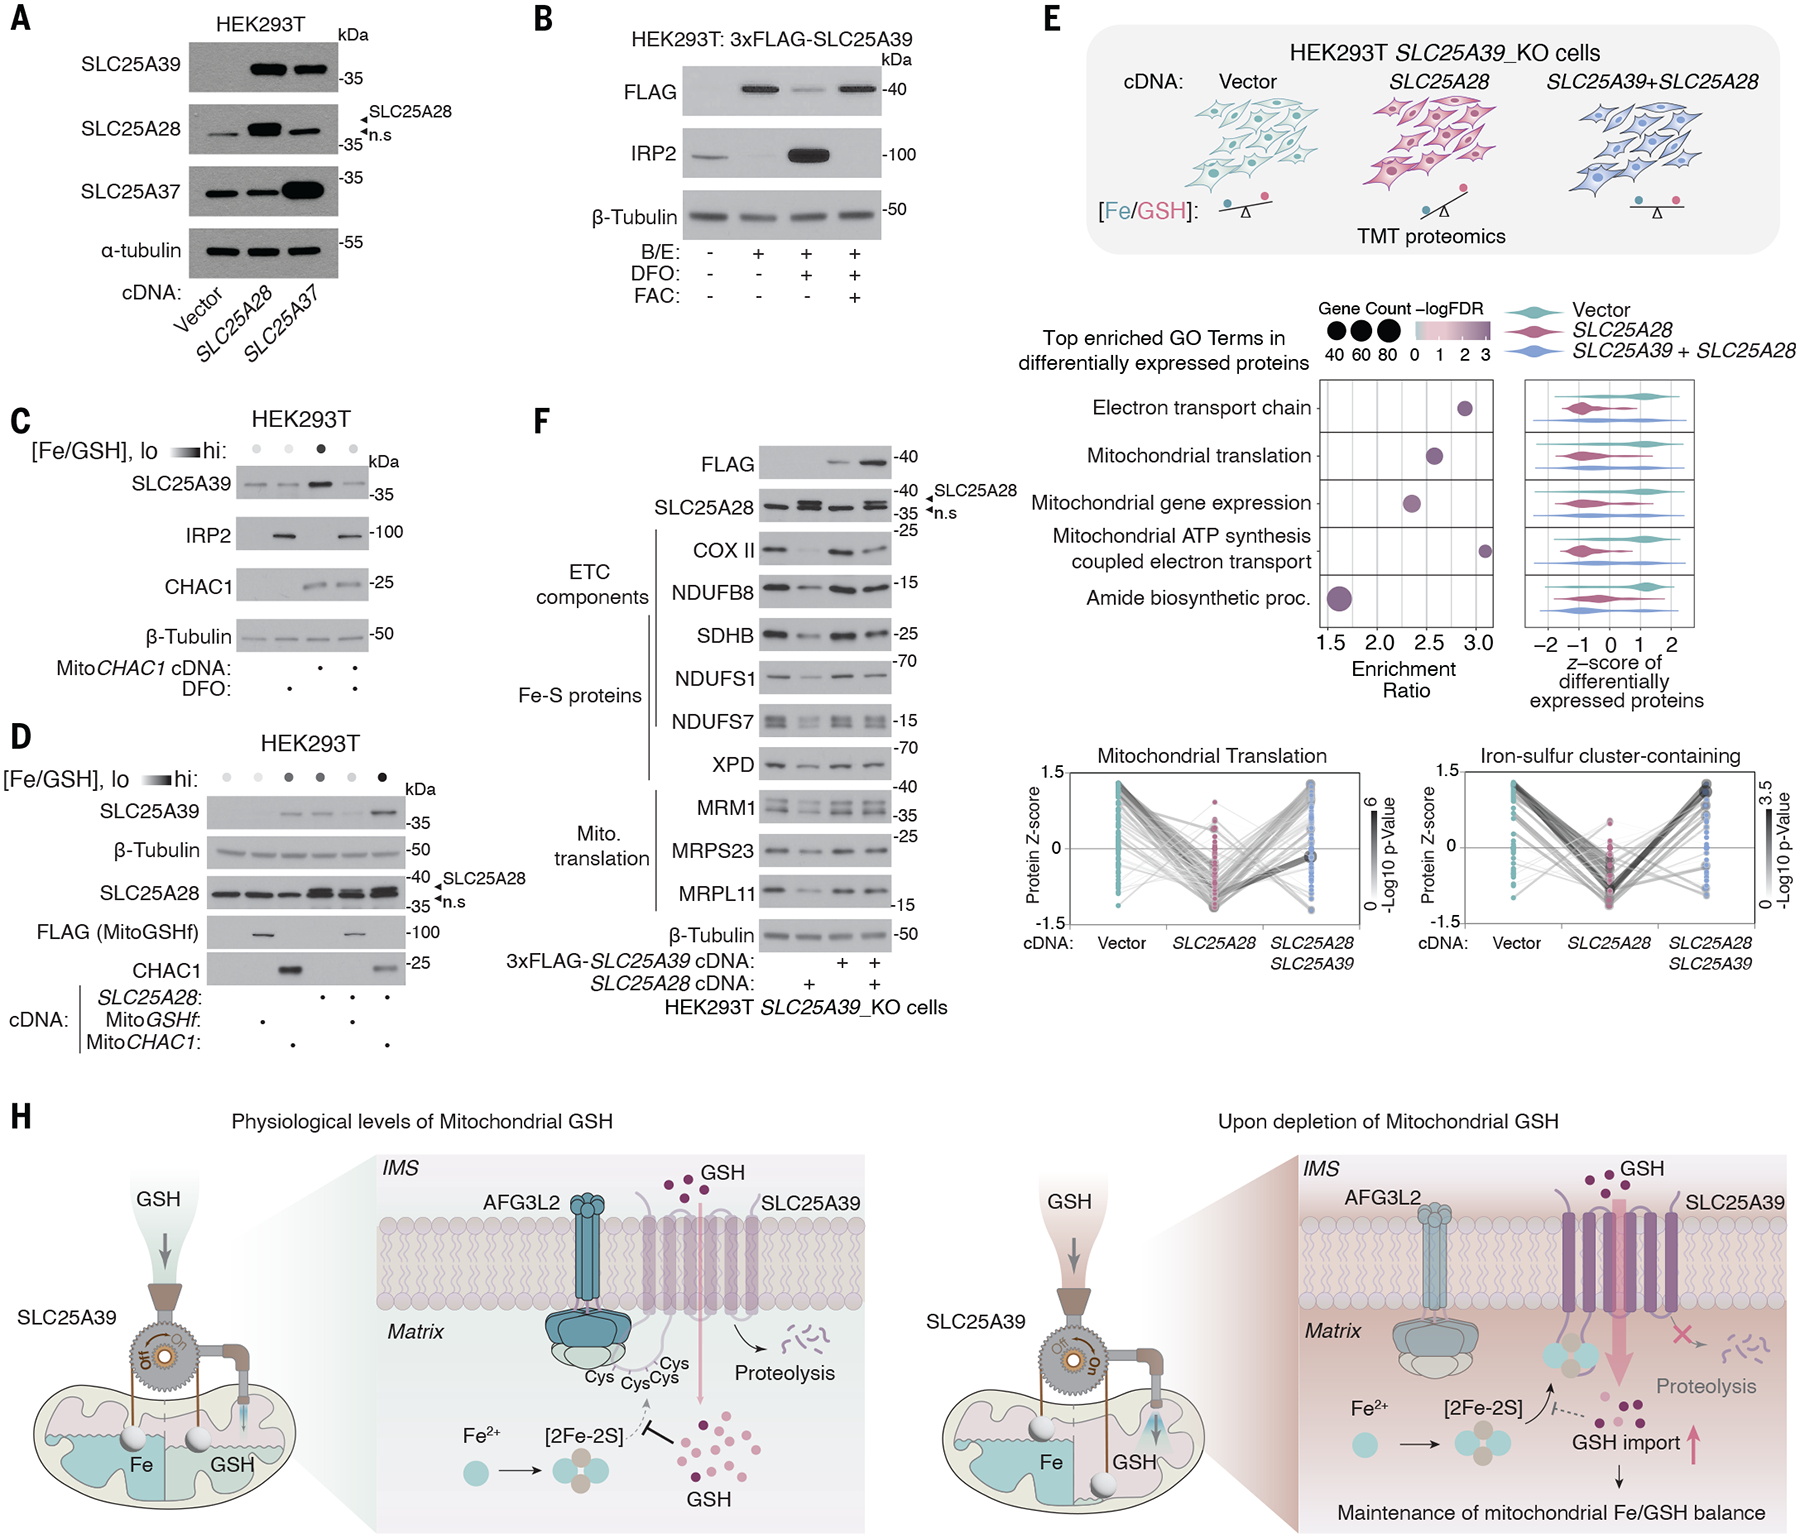
Mitochondria must maintain adequate amounts of metabolites for protective and biosynthetic functions. However, how mitochondria sense the abundance of metabolites and regulate metabolic homeostasis is not well understood. In this work, we focused on glutathione (GSH), a critical redox metabolite in mitochondria, and identified a feedback mechanism that controls its abundance through the mitochondrial GSH transporter, SLC25A39. Under physiological conditions, SLC25A39 is rapidly degraded by mitochondrial protease AFG3L2. Depletion of GSH dissociates AFG3L2 from SLC25A39, causing a compensatory increase in mitochondrial GSH uptake. Genetic and proteomic analyses identified a putative iron-sulfur cluster in the matrix-facing loop of SLC25A39 as essential for this regulation, coupling mitochondrial iron homeostasis to GSH import. Altogether, our work revealed a paradigm for the autoregulatory control of metabolic homeostasis in organelles.


Conflict of interest statement

Competing interests: K.B. is a scientific advisor to Nanocare Pharmaceuticals and Atavistik Bio. The other authors declare no competing interests.

Figures

Fig. 1.
Fig. 1.. SLC25A39 is a short–half life protein regulated by mitochondrial GSH availability.
(A) Scatter plot showing the protein copy number versus mRNA abundance (TPM) for all genes in HEK293T cells detectable across the proteome. Original data were retrieved from the OpenCell database. Green dots denote SLC25 family proteins, and purple dots denote representative proteins known to be regulated post transcriptionally. (B) (Top) Schematic showing the construct for cotranslational expression of 3xFLAG-tagged SLC25A39 and RFP, separated by a self-cleaving P2A peptide. (Bottom) Immunoblots of the indicated proteins in HEK293T cells expressing the aforementioned construct. Cells were treated with BSO (1 mM) for 48 hours and were then treated with GSH (10 mM), GSH ethyl ester (GSHee, 10 mM), Trolox (50 μM), Liproxstatin-1 (1 μM), cystine (200 μM), N-acetylcysteine (NAC, 1 mM), α-tocopherol (5 μM), MitoQ (30 nM), or BH4 (4 μM) for 8 hours. RFP was used as an internal control for the translational levels of the construct, and SLC25A12 was used as a loading control. (C) (Top) Immunoblots of the indicated proteins in HEK293T cells expressing 3xFLAG-SLC25A39 cDNA treated with cycloheximide (CHX, 50 μg/ml) for the indicated times. Prior to CHX treatment, cells were treated with BSO (1 mM) and erastin (5 μM) for 24 hours and GSH ethyl ester (GSHee, 10 mM) for 8 hours. DMSO was used as the control. β-tubulin was used as a loading control. (Bottom) Quantification of FLAG band signal intensity from the immunoblots above. Half-life (t1/2) was calculated by the nonlinear fitting of FLAG band signal intensity versus time to one phase decay exponential model. (D) Schematic showing the localization and the catalytic reaction of engineered MitoCHAC1 protein. (E) Immunofluorescence images of MitoCHAC1 (HA, green), ATP5A1 (red), and DAPI (blue) in HEK293T cells. (F) Whole-cell and mitochondrial abundance of GSH (normalized to NAD+ abundance) in HEK293T cells expressing empty vector or MitoCHAC1 (in the presence of exogenous GSH). Data are mean ± SD representing three biologically independent samples. P values were calculated from Welch’s t test. (G) Immunoblots showing the amounts of the indicated proteins in HEK293T cells that express an empty vector or MitoCHAC1 (in the presence of exogenous GSH). SLC25A12 and β-tubulin were used as loading controls. (H) (Top) The schematic of the cell-free assay that uses immunopurified mitochondria (mito IP) from HEK293T cells to analyze SLC25A39 stability. (Bottom) Immunoblots of the indicated proteins from purified mitochondria after treating them with GSH (20 mM) for the indicated times. SLC25A12 and SLC25A11 were used as loading controls.
Fig. 2.
Fig. 2.. AFG3L2 binds and degrades SLC25A39 through a matrix loop domain in a GSH-dependent manner.
(A) Schematic showing the alignment of AlphaFold2-predicted structural models of the indicated proteins. SLC25A39 is highlighted in pink, with aa42–106 highlighted in green. (B) Immunoblots of the indicated proteins in HEK293T cells expressing 3xFLAG-SLC25A39 or 3xFLAG-SLC25A39 without the matrix-facing loop (Δaa42–106) after 24-hour treatment with BSO (1 mM) and erastin (5 μM) or DMSO as the control. (C) Immunoblots of the indicated proteins in HEK293T cells expressing 3xFLAG-SLC25A39, 3xFLAG-SLC25A11, or a chimeric protein in which aa42–106 of SLC25A39 is spliced into SLC25A11 after 24-hour treatment with BSO (1 mM) and erastin (5 μM) or DMSO as the control. (D) Schematic showing the library design of the mitochondrial peptidase sgRNA library and the workflow of the FACS-based CRISPR screen for 3xFLAG-SLC25A39 stability. (E) Scatter plot showing the enrichment of sgRNAs targeting mitochondrial proteases in the SLC25A39-lo cell fraction (x axis) and SLC25A39-hi cell fraction (y axis). Red dots represent sgRNAs targeting AFG3L2. (F) Immunoblots of the indicated proteins in HEK293T cells expressing 3xFLAG-SLC25A39 and sgRNAs targeting control or AFG3L2 after 24-hour treatment with BSO (1 mM) and erastin (5 μM) or DMSO as the control. (G) (Left) Immunoblots of the indicated proteins in HEK293T cells expressing 3xFLAG-SLC25A39 and sgRNAs targeting AFG3L2 or control upon treatment with cycloheximide (CHX, 50 μg/ml) for the indicated times. β-tubulin was used as a loading control. (Right) Quantification of FLAG bands signal intensity from the immunoblots. Half-life (t1/2) was calculated by the nonlinear fitting of FLAG band signal intensity versus time to one phase decay exponential model. (H) Immunoblots of the indicated proteins from whole-cell lysates or FLAG-immunoprecipitation from HEK293T cells stably expressing cDNAs for vector, 3xFLAG-SLC25A39, 3xFLAG-SLC25A39 lacking matrix-facing loop (Δaa42–106), 3xFLAG-SLC25A11, or a chimeric protein in which aa42–106 of SLC25A39 is spliced into SLC25A11 and transiently transfected with AFG3L2 (E408Q)-HA cDNA. (I) Immunoblots of the indicated proteins from whole-cell lysates or FLAG immunoprecipitation from HEK293T cells stably expressing cDNA for empty vector or 3xFLAG-SLC25A39 and are transiently transfected with AFG3L2(E408Q)-HA cDNA. Cells were treated for 24 hours with BSO (1 mM) and erastin (5 μM) or DMSO as the control. Indicated cells were then treated for 8 hours with GSHee (10 mM). (J) Multiple sequence alignment between SLC25A39 and the inferred ancestral sequence of SLC25A39 reconstructed from amino acid sequences of SLC25A39 homologs in the indicated taxa. Four conserved cysteines in the matrix-facing loop are highlighted. (K) Immunoblots for the indicated proteins in HEK293T cells that express 3xFLAG-SLC25A39 or 3xFLAG-SLC25A39(C78/88S). Cells were treated for 24 hours with BSO (1 mM) and erastin (5 μM) or DMSO as the control. (L) Immunoblot of the indicated proteins from whole-cell lysates or FLAG immunoprecipitation from HEK293T cells stably expressing cDNAs for vector, 3xFLAG-SLC25A39, or 3xFLAG-SLC25A39(C78/88S) and are transiently transfected with AFG3L2(E408Q)-HA cDNA. Cells were treated for 24 hours with BSO (1 mM) and erastin (5 μM) or DMSO as the control. (M) (Left) Schematic showing the GSH uptake assay that uses immunopurified mitochondria from HEK293T-SLC25A39_KO cells expressing cDNAs for empty vector, SLC25A39, or SLC25A39(C78/88S). (Right) Abundance of GSH-(glycine-13C2 ,15N) taken up by isolated mitochondria. Data are mean ± SD representing three biologically independent samples. P values were calculated from Welch’s multiple t test with the Holm-Šídák method.
Fig. 3.
Fig. 3.. CRISPR screen identifies [2Fe-2S] cluster assembly as essential for the regulation of SLC25A39 stability.
(A) Schematic of the CRISPR screen workflow with mitochondrial sgRNA library for SLC25A39 stability under GSH depletion. (B) (Top) Dot plot showing the distribution of differential CRISPR gene score calculated as (median guide enrichment in the SLC25A39-hi fraction) – (median guide enrichment in the SLC25A39-lo fraction). Pink dots indicate genes in the [2Fe-2S] cluster assembly pathway. The green dot indicates the putative mitochondrial [2Fe-2S] cluster exporter ABCB7. (Bottom) Gene Ontology enrichment analysis of genes with a differential CRISPR gene score lower than −1. (C) Schematic of the mitochondrial Fe-S cluster assembly pathways that highlights the genes that scored (pink and green) in the CRISPR screen. (D) Immunoblots of the indicated proteins in HEK293T cells that express 3xFLAG-SLC25A39. (Top) Cells were transduced with lentivirus expressing Cas9 and control sgRNA or sgRNAs that target iron-sulfur cluster assembly factor HSCB. Cells were treated for 24 hours with BSO (1 mM) and erastin (5 μM) or DMSO as the control. (Bottom) Cells were transduced with lentivirus expressing control sgRNA or sgRNAs targeting ABCB7 (left), or shRNAs targeting GFP or ABCB7 (right). (E) Scatter plot showing log2 fold change and −log10(P value) of proteomics analysis from immunopurified mitochondria of the indicated samples. The x axis represents log2 protein fold change (FC) in isolated mitochondria from HEK293T cells that express shRNA targeting GFP or cysteine desulfurase NFS1 after 24-hour treatment with BSO (1 mM) and erastin (5 μM). The y axis represents log2 fold change (FC) in mitochondrial protein abundance after treating cells with BSO (1 mM) and Erastin (5 μM) versus DMSO as the control. The color grid indicates −log10(P values) and green circles represent [2Fe-2S] cluster–containing proteins. (F) Immunoblots of the indicated proteins from the whole-cell lysates or FLAG-immunoprecipitation from HEK293T cells stably expressing cDNAs for vector or 3xFLAG-SLC25A39, are infected with lentivirus-expressing control sgRNA or sgRNAs for HSCB, and are transiently transfected with AFG3L2(E408Q)-HA cDNA. Cells were treated for 24 hours with BSO (1 mM) and erastin (5 μM) or DMSO as the control.
Fig. 4.
Fig. 4.. A GSH-sensitive iron-sulfur cluster associates with SLC25A39 and mediates its regulation.
(A) Schematic showing the method of tracking iron-sulfur cluster bound to SLC25A39 by means of 55Fe tracing. (B) (Left) Immunoblots of the indicated proteins from whole-cell lysates or FLAG immunoprecipitation from HEK293T cells stably expressing cDNAs for empty vector or 3xFLAG-SLC25A39 and are infected with lentivirus-expressing control sgRNA or sgRNA targeting AFG3L2. Cells were labeled with 55FeCl3 in the culture media and treated for 24 hours with BSO (1 mM) and erastin (5 μM) or DMSO as the control. (Right) The amount of 55Fe bound to FLAG immunoprecipitant, from the identical cells as those in the immunoblot, quantified by liquid scintillation assay. (C) (Left) Immunoblots of the indicated proteins from whole-cell lysates or FLAG immunoprecipitation from HEK293FS cells stably expressing cDNAs for empty vector, 3xFLAG-SLC25A39, 3xFLAG-SLC25A39(C74/78/88/94S), or 3xFLAG-SLC25A11. Cells were labeled with 55FeCl3 in the culture media and treated for 24 hours with BSO (1 mM) and erastin (5 μM). (Right) The amount of 55Fe bound to FLAG immunoprecipitant, from the identical cells as those used for the immunoblot, quantified by liquid scintillation assay. (D) (Left) Schematic showing the location and peptide sequence of SLC25A39(aa73–95) used to reconstitute peptide-[2Fe-2S] cluster complex in vitro. (Right) UV-visible spectrum (with the calculated contribution of the indicated species) and Mössbauer spectrum of the reconstituted peptide-[2Fe-2S] complex. The Mössbauer spectrum was least-squares fit to extract hyperfine parameters: isomer shift (δ), quadrupole splitting (Δ), full width at half-maximum (FWHM), and intensities (I). The red and green curves of the Mössbauer spectrum plot represent two Fe3+ doublets with slightly different shifts and quadrupole splitting fitted to the spectral data. Red: δ = 0.23 mm/s, Δ = 0.51 mm/s, and I = 70%. Green: δ = 0.30 mm/s, Δ = 0.90 mm/s, and I = 30%. (E) Schematic for cysteine reactivity profiling for SLC25A39 with an iodoacetamide-desthiobiotin (IA-DTB) probe. (F) Reactivity of SLC25A39-Cys94, Cys88, and Cys202 after a 24-hour treatment with indicated reagents, quantified by mass spectrometry as the intensity ratio between IA-DTB–labeled versus unlabeled peptide containing SLC25A39-Cys94 and normalized to DMSO-treated samples. [(B), (C), and (F)] Data are mean ± SD and represent three biologically independent samples. P values were calculated from one-way analysis of variance.
Fig. 5.
Fig. 5.. SLC25A39-mediated GSH import maintains iron/GSH balance in mitochondria.
(A) Immunoblots of the indicated proteins from HEK293T cells overexpressing cDNAs of Mitoferrin 1 (SLC25A37), Mitoferrin 2 (SLC25A28), or an empty vector. (B) Immunoblot of the indicated proteins in HEK293T cells expressing 3xFLAG-SLC25A39 cDNA after 24-hours treatment with BSO (1 mM) and Erastin (5 μM); BSO, Erastin, and deferoxamine (50 μM); or BSO, Erastin, deferoxamine (50 μM), and Ferric Ammonium Citrate (FAC, 10 μg/ml). (C) Immunoblots of the indicated proteins from HEK293T cells overexpressing cDNAs of MitoCHAC1 or empty vector after 4 hours of treatment with 50-μM iron chelator deferoxamine (DFO) or control. (D) Immunoblots of the indicated proteins from HEK293T cells overexpressing cDNAs of SLC25A28, MitoCHAC1, or FLAG-tagged MitoGSHf, an engineered bacterial GSH synthase localized to the mitochondria. (E) (Top) Schematic of the experiment setup of TMT proteomics for cells with different iron/GSH ratios. Three biologically independent samples per condition from HEK293T-SLC25A39_KO cells expressing the indicated cDNAs were used. (Middle) Gene ontology enrichment analysis of the most differentially expressed proteins across the three conditions that shows the top five most significantly enriched biological processes. The violin plots indicate the relative protein abundance (z-scores) of the differentially expressed proteins in the indicated biological processes. (Bottom) Dot plot representing protein levels (z-scores) of the mitochondrial translation machinery and iron-sulfur cluster–containing proteins. The darkness of the lines represents the statistical significance of the changes in protein abundance. (F) Immunoblots of the indicated proteins in HEK293T-SLC25A39_KO cells overexpressing empty vector, SLC25A39 cDNA, Mitoferrin 2 (SLC25A28) cDNA, or both. (G) Schematic for the model describing the autoregulatory control of mitochondrial iron/GSH balance by SLC25A39.

References

    1. Efeyan A, Comb WC, Sabatini DM, Nature 517, 302–310 (2015). - PMC - PubMed
    1. Brown MS, Goldstein JL, Science 232, 34–47 (1986). - PubMed
    1. Mårtensson J, Lai JC, Meister A, Proc. Natl. Acad. Sci. U.S.A 87, 7185–7189 (1990). - PMC - PubMed
    1. Gu Z et al., Mol. Microbiol 51, 149–158 (2004). - PubMed
    1. Beer SM et al., J. Biol. Chem 279, 47939–47951 (2004). - PubMed

MeSH terms