. 2024 Feb 1;209(3):273-287.
doi: 10.1164/rccm.202301-0067OC.

Blood-based Transcriptomic and Proteomic Biomarkers of Emphysema

Collaborators, Affiliations

Blood-based Transcriptomic and Proteomic Biomarkers of Emphysema

Rahul Suryadevara et al. Am J Respir Crit Care Med. .

Abstract

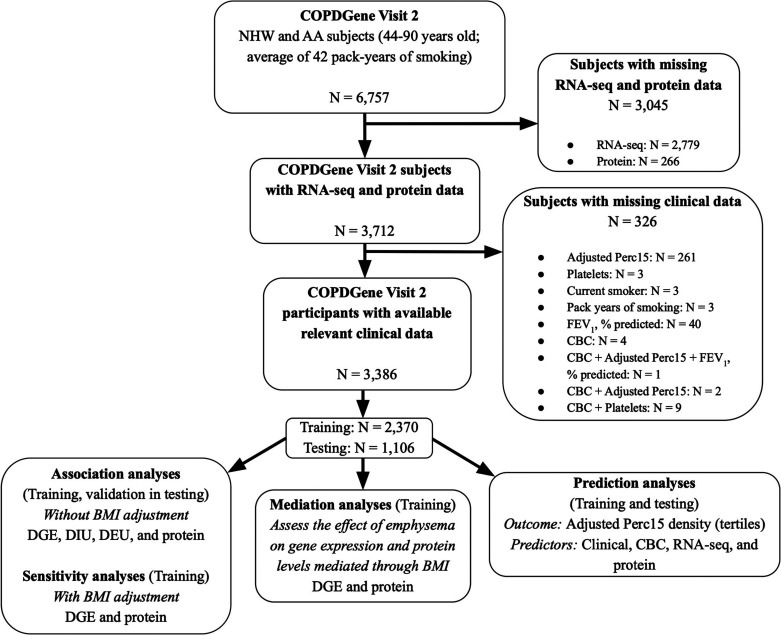
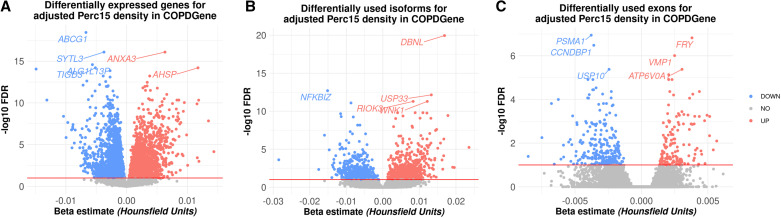
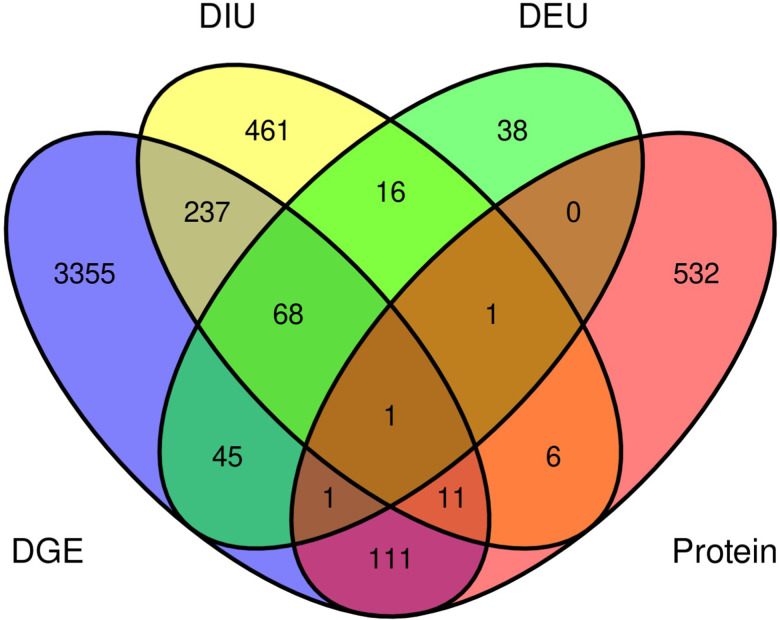
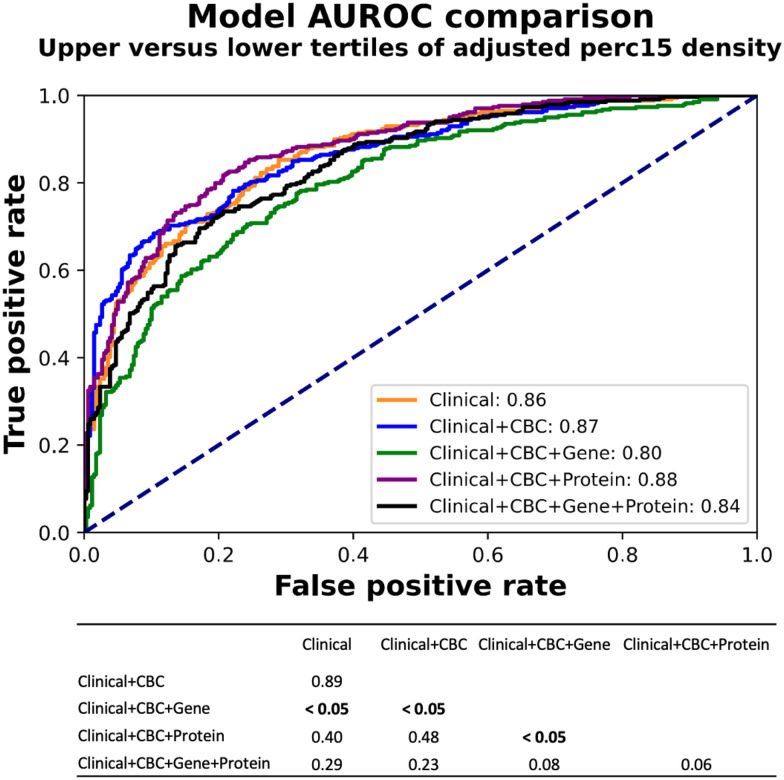
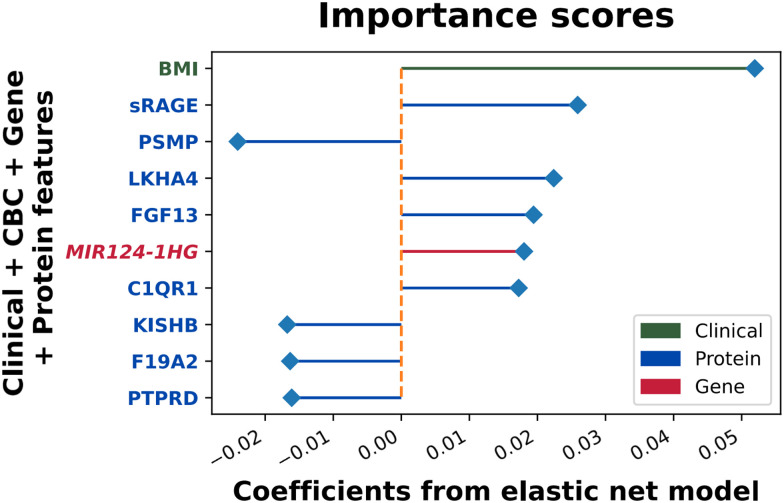
Rationale: Emphysema is a chronic obstructive pulmonary disease phenotype with important prognostic implications. Identifying blood-based biomarkers of emphysema will facilitate early diagnosis and development of targeted therapies. Objectives: To discover blood omics biomarkers for chest computed tomography-quantified emphysema and develop predictive biomarker panels. Methods: Emphysema blood biomarker discovery was performed using differential gene expression, alternative splicing, and protein association analyses in a training sample of 2,370 COPDGene participants with available blood RNA sequencing, plasma proteomics, and clinical data. Internal validation was conducted in a COPDGene testing sample (n = 1,016), and external validation was done in the ECLIPSE study (n = 526). Because low body mass index (BMI) and emphysema often co-occur, we performed a mediation analysis to quantify the effect of BMI on gene and protein associations with emphysema. Elastic net models with bootstrapping were also developed in the training sample sequentially using clinical, blood cell proportions, RNA-sequencing, and proteomic biomarkers to predict quantitative emphysema. Model accuracy was assessed by the area under the receiver operating characteristic curves for subjects stratified into tertiles of emphysema severity. Measurements and Main Results: Totals of 3,829 genes, 942 isoforms, 260 exons, and 714 proteins were significantly associated with emphysema (false discovery rate, 5%) and yielded 11 biological pathways. Seventy-four percent of these genes and 62% of these proteins showed mediation by BMI. Our prediction models demonstrated reasonable predictive performance in both COPDGene and ECLIPSE. The highest-performing model used clinical, blood cell, and protein data (area under the receiver operating characteristic curve in COPDGene testing, 0.90; 95% confidence interval, 0.85-0.90). Conclusions: Blood transcriptome and proteome-wide analyses revealed key biological pathways of emphysema and enhanced the prediction of emphysema.

Trial registration: ClinicalTrials.gov NCT00292552.

Keywords: biomarkers; emphysema; prediction; proteomics; transcriptomics.


Figures

Figure 1.
Figure 1.
COPDGene visit 2 participant flow diagram. AA = African American; BMI = body mass index; CBC = complete blood count; DGE = differential gene expression; DIU = differential isoform use; DEU = differential exon use; NHW = non-Hispanic White; RNA-seq = RNA sequencing.
Figure 2.
Figure 2.
Heatmap of expression levels (high expression in red, low expression in blue) of top 15 (A) differential gene expression (DGE) and (B) proteins in COPDGene. Subjects are listed in increasing order of adjusted 15th percentile of the attenuation histogram + 1,000 Hounsfield units (Perc15). The heatmaps are scaled by row. Subjects 1–25 represent those with the lowest adjusted Perc15, whereas subjects 26–50 represent those with the highest adjusted Perc15. The DGE and proteins are sorted in decreasing order (from top to bottom) of log fold change and β-coefficients, respectively.
Figure 3.
Figure 3.
Volcano plots of the primary model representing (A) differentially expressed genes, (B) differentially used isoforms, and (C) differentially used exons in COPDGene. Genes significantly associated with adjusted Perc15 density appear above the red line marked at false discovery rate (FDR) 5%. Upregulated genes are in blue, and downregulated genes are in red. Genes/isoforms/exons that are not differentially expressed or used are gray and appear below the threshold line. Adjusted Perc15 density = Hounsfield units at the 15th percentile of computed tomography density histogram at TLC, corrected for the inspiratory depth (per convention, adjusted Perc15 density values are reported as HU + 1,000). The lower the Perc15 values are, the more computed tomography–quantified emphysema is present. Upregulated versus downregulated genes are reported with respect to adjusted Perc15 density (i.e., they have opposite directions for their associations with emphysema).
Figure 4.
Figure 4.
Number of significant genes associated with adjusted 15th percentile of the attenuation histogram + 1,000 Hounsfield units (Perc15) density from the differential gene expression (DGE), differential isoform use (DIU), differential exon use (DEU), and protein association analyses in COPDGene. HUGO (Human Genome Organization) gene symbols were used to find the intersection of biomarkers between the DGE, DIU, DEU, and protein analyses. Multiple proteins may map to a single gene. Therefore, the diagram does not reflect the total number of proteins significantly associated with adjusted Perc15 density.
Figure 5.
Figure 5.
The areas under the receiver operating characteristic curve (AUROCs) for the elastic net prediction models in COPDGene: clinical (age, race, sex, body mass index, pack-years of smoking, and current smoking status) only, clinical + complete blood count (CBC) proportions of neutrophils, eosinophils, monocytes, lymphocytes, and platelets, clinical + CBC + genes, clinical + CBC + proteins, and clinical + CBC + genes + proteins. The table summarizes the pairwise DeLong P values of the model comparisons. P < 0.05 values are bolded.
Figure 6.
Figure 6.
Top 10 predictors sorted in descending order by the absolute values of their β-coefficients from the elastic net model using clinical (age, race, sex, body mass index [BMI], pack-years of smoking, and current smoking status), complete blood count (CBC) proportions of neutrophils, eosinophils, monocytes, lymphocytes, and platelets, gene, and protein data in COPDGene. The horizontal lines represent the magnitude of the coefficient for each feature. All predictors were centered and scaled.

Comment in

Similar articles

Cited by

References

    1. Lindberg A, Lindberg L, Sawalha S, Nilsson U, Stridsman C, Lundbäck B, et al. Large underreporting of COPD as cause of death—results from a population-based cohort study. Respir Med . 2021;186:106518. - PubMed
    1. Li Y, Swensen SJ, Karabekmez LG, Marks RS, Stoddard SM, Jiang R, et al. Effect of emphysema on lung cancer risk in smokers: a computed tomography-based assessment. Cancer Prev Res (Phila) 2011;4:43–50. - PMC - PubMed
    1. Rahman HH, Niemann D, Munson-McGee SH. Association between asthma, chronic bronchitis, emphysema, chronic obstructive pulmonary disease, and lung cancer in the US population. Environ Sci Pollut Res Int . 2023;30:20147–20158. - PubMed
    1. Morgan AD, Zakeri R, Quint JK. Defining the relationship between COPD and CVD: what are the implications for clinical practice? Ther Adv Respir Dis . 2018;12:1753465817750524. - PMC - PubMed
    1. Carolan BJ, Hughes G, Morrow J, Hersh CP, O’Neal WK, Rennard S, et al. The association of plasma biomarkers with computed tomography-assessed emphysema phenotypes. Respir Res . 2014;15:127. - PMC - PubMed

Publication types

Associated data