. 2023 Nov 22;186(24):5411-5427.e23.
doi: 10.1016/j.cell.2023.09.028. Epub 2023 Nov 1.

The proteomic landscape of synaptic diversity across brain regions and cell types

Affiliations

The proteomic landscape of synaptic diversity across brain regions and cell types

Marc van Oostrum et al. Cell. .

Abstract

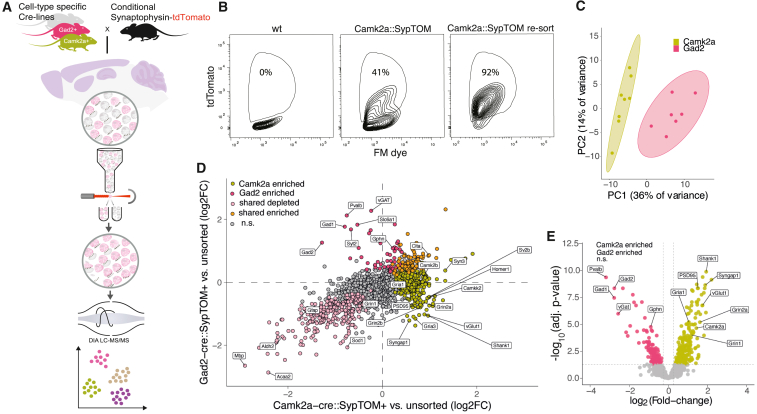
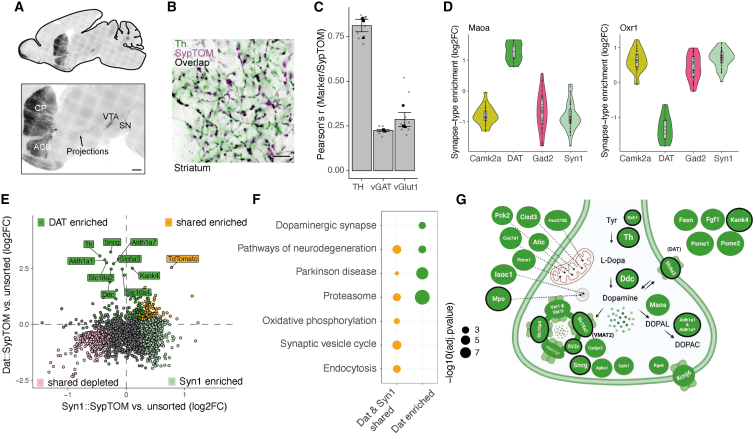
Neurons build synaptic contacts using different protein combinations that define the specificity, function, and plasticity potential of synapses; however, the diversity of synaptic proteomes remains largely unexplored. We prepared synaptosomes from 7 different transgenic mouse lines with fluorescently labeled presynaptic terminals. Combining microdissection of 5 different brain regions with fluorescent-activated synaptosome sorting (FASS), we isolated and analyzed the proteomes of 18 different synapse types. We discovered ∼1,800 unique synapse-type-enriched proteins and allocated thousands of proteins to different types of synapses (https://syndive.org/). We identify shared synaptic protein modules and highlight the proteomic hotspots for synapse specialization. We reveal unique and common features of the striatal dopaminergic proteome and discover the proteome signatures that relate to the functional properties of different interneuron classes. This study provides a molecular systems-biology analysis of synapses and a framework to integrate proteomic information for synapse subtypes of interest with cellular or circuit-level experiments.

Keywords: dopaminergic synapses; excitatory synapses; fluorescence-activated synaptosome sorting; inhibitory synapses; proteomics; synapse; synapse diversity; synaptic proteins; synaptic proteomics.


Conflict of interest statement

Declaration of interests The authors declare no competing interests.

Figures

None
Graphical abstract
Figure 1
Figure 1
Synaptic diversity, proteomic discovery pipeline, and proof-of-principle (A) Crosses of different cell-type-specific Cre-driver lines (Camk2a+, Gad2+, Syn1+, Dat+, PV+, SST+, and VIP+) and a floxed synaptophysin-tdTomato line result in the cell-type-specific labeling of presynaptic terminals. Different indicated brain regions were microdissected, and synaptosomes were generated from each region. Fluorescence-activated synaptosome sorting (FASS) was used to purify the fluorescent, cell-type-specific population of synaptosomes. Then, each purified synaptosome population was subjected to data-independent acquisition (DIA) mass spectrometry, and the proteomes determined by statistical analysis of quantitative enrichment. (B) Gating strategy and sorting efficiency. FASS contour plots showing the relative density of the targeted tdTomato+ synaptic population in cortical synaptosomes prepared from wild-type mice (0%; left) or Camk2a::SypTOM mice (41%; middle). x and y axes represent fluorescence from a membrane dye (FM4-64) and tdTomato, respectively. Following the initial sorting run (middle), re-loading of the sorted synaptosomes indicated a high enrichment and purity (92%) of the Camk2a::SypTOM sample (right). (C) PCA showing the clear separation of Camk2a+ vs. Gad2+-sorted synaptosome proteomes. Individual data points represent replicates of the indicated groups. (D) Scatter plot comparing the differential enrichment of proteins in the Camk2a+-sorted and Gad2+-sorted synaptosomes to their control synaptosome precursor populations. Indicated are proteins that were significantly enriched in Camk2a+-sorted (lime green) or Gad2+-sorted synaptosomes (rose), significant in both populations (orange), or significantly de-enriched in both (pale pink). (E) Volcano plot comparing the proteins significantly enriched in Camk2a+-sorted (lime green) vs. Gad2+-sorted synaptosomes (rose). Some canonical marker proteins for excitatory and inhibitory synapses are highlighted. The y axis shows −log10 Benjamini-Hochberg adjusted p values. See also Figure S1.
Figure S1
Figure S1
Characterization of the workflow to quantify synapse subtype-specific proteomes, related to Figure 1 (A) Contaminant proteins were significantly depleted in the (F2/3) synaptosomal fraction. Bar plots: relative fluorescent intensity across the different fractions of myelin basic protein 1 (paired one-tailed t test homogenate vs. F2/3, p = 0.023; n = 3), the glial marker glial fibrillary acidic protein (p = 0.048; n = 3), and the nuclear marker histone H3 (p = 0.032; n = 3). Synaptic proteins were enriched in the (F2/3) synaptosomal fraction; synapsin 2a (paired one-tailed t test homogenate vs. F2/3, p = 0.024; n = 3), synaptophysin (paired one-tailed t test homogenate vs. F2/3, p = 0.088; n = 3), and postsynaptic density protein 95 (paired one-tailed t test homogenate vs. F2/3, p = 0.017; n = 3). Error bars represent SEM. Relative fluorescent intensity is normalized for protein loading, local fluorescent background, and the maximum intensity of each sample. (B) Left: representative revert 700 total protein stain used to normalize for differences in protein loading. Right: representative immunoblot bands of the data shown in (A). (C) The first sorting gate (P1) used to exclude doublet particles based on side scatter. The particles in P1 were then gated according to Figure 1B to select for TdTomato+ particles. (D) Quantification of data shown in (E) for Camk2a+ synaptosomes and PSD95. Bar plots showing the percentage of TdTomato+ synaptosomes from Camk2a-cre crosses that contain a postsynaptic element (PSD95) and the same for inhibitory synaptosomes (Gad2-cre) using gephyrins as postsynaptic marker protein. n = 3 animals. (E) Representative images of spotted synaptosomes and their TdTomato fluorescence and PSD95 or gephyrin immunoreactivity for the data shown in (D). The composite contains both signals. Scale bars, 5 μm. (F) Scatterplot showing the identified particles of sorted Camk2a+ synaptosomes and their fluorescence for TdTomato and PSD95. For the estimation of particles that contained a postsynaptic element, shown in (D), the particles in the two right quadrants represent all TdTomato+ particles and form the denominator, and the particles in the upper right quadrant represent particles that are both TdTomato+ and PSD95+ and form the numerator. (G) Same as in (G), but for Gad2+ synaptosomes and the postsynaptic marker gephyrin. (H) Gene ontology (GO) analysis of the shared-enriched proteins and the union of shared, Camk2a-enriched and Gad2-enriched proteins (synapse-enriched) of Figure 1D. The selected GO terms highlight the enrichment of synaptic terms and de-enrichment of mitochondria and myelin. (I) PCA of Gad2+-enriched, Camk2a+-enriched, and unsorted control samples from the experiment displayed in Figure 1.
Figure 2
Figure 2
Synaptic proteomic diversity across brain areas and cell types (A) Scheme indicating the brain areas that were microdissected from Camk2a::SypTOM, Gad2::SypTOM, Syn1::SypTOM, or Dat::SypTOM mice and then introduced to the pipeline. (B) Plot indicating the relative abundance of each fluorescently labeled synaptosome type in the crude synaptosome fraction generated from the brain areas indicated (x axis). (C) Plot indicating the purity of each fluorescently labeled synaptosome type from the brain areas indicated (x axis) after FASS. (D) Principal-component analysis (PCA) in which the cell type clusters are highlighted. Small symbols denote individual biological replicates, and large symbols denote averages of each synapse subtype. (E) PCA in which the brain regions are highlighted. Symbols denote individual biological replicates. (F) Violin plots depicting the percentage of the variance explained by individual covariates. ∗∗∗p < 0.001; t test, n = 1,022. (G) Number of protein groups quantified for each synapse subtype, grouped by cell types and brain regions. Shown are significantly enriched and de-enriched groups (see STAR Methods), as well as protein groups that are not significantly different between the groups. (H) Correlation between immunofluorescence and mass spectrometric measurements for vGat and VGlut1 proteins across the 15 synapse types. x axis shows mass spectrometric measurements for vGat and VGlut1 protein. y axis indicates immunofluorescence measurements for vGat and VGlut1 proteins. The immunofluorescence data are described in Figure S2. See also Figures S2 and S3.
Figure S2
Figure S2
Assessment of synaptic populations that are labeled by Camk2a-cre, Gad2-cre, and Syn-cre crosses, related to Figure 2 (A) Left: sagittal overview of SypTOM expression in a Camk2a::SypTOM, Gad2::SypTOM, and Syn1::SypTOM. Middle: magnified representative image of an immunofluorescent co-staining for the inhibitory synapse marker solute carrier family 32 member 1 (vGat) and the excitatory synapse marker solute carrier family 17 member 7 (vGlut1), both in green, and of SypTOM expression, in purple, for the three mouse lines. Overlap is depicted in black. Right: fluorescence intensity analysis showing the relative spatial coincidence of the SypTOM with vGlut1 and vGat for the three mouse lines. Scale bars, 5 μm. (B) Pearson’s correlation between SypTOM fluorescence and the vGat (red) and vGlut1 (green) show distinct labeling in the CX and HC, and to a lesser extent in STR and Bulb for Camk2a::SypTOM. The Gad2::SypTOM mouse shows relatively high labeling for inhibitory synapses in the cortex, hippocampus, and cerebellum and lower labeling in the striatum and olfactory bulb. The Syn1-cre mouse shows overlapping synaptic labeling with both vGat and vGlut1 in all brain regions except for the cerebellum, where predominantly inhibitory synapses are labeled. Large symbols, average per mouse; small symbols, individual images. Error bars signify the standard error of the mean (SEM). n = 3 animals, 4 images per brain region for every marker and mouse. (C) Synaptosome density in electron micrographs was comparable across the analyzed brain regions. Displayed are representative EM tile scans (acquired with a 31,500× magnification) of representative synaptosome fractions originating from the cortex (CX), hippocampus (HC), striatum (STR), olfactory bulb (Bulb), and cerebellum (CER). Scale bars, 1 μm. Synaptosomes were identified as round structures containing synaptic vesicles. The bar chart shows the fractional area of the image, which was annotated as synaptosome. We found no significant differences in synaptosome abundance across the analyzed brain regions (repeated measures ANOVA, p = 0.95; CX: n = 4, HC: n = 4; STR: n = 3; Bulb: n = 4; CER: n = 4; n = number of animals). (D) Synaptosomes from different brain areas did not exhibit significantly different sizes. Cross-sectional area (μm2) of synaptosomes originating indicated brain areas were not significantly different (repeated measures ANOVA, p = 0.21; n (number of animals) = 4, 4, 3, 4, and 4 for CX, HC, STR, Bulb, and CER, respectively). Large symbols, average cross-sectional area from 30 synaptosomes; small symbols, individual synaptosomes. (E) Synaptosome cross-sectional sampling results in an underrepresentation of the true size. Therefore, we estimated the extent of underrepresentation of the true synaptosomes size assuming a spherical shape (see STAR Methods). We randomly sampled 30 planes from a sphere with the indicated diameter (n = 4) and plotted the obtained average cross-sectional area (black dots). Connecting the sampled data points provides the purple line, which was used to estimate the synaptosome diameter from the experimentally sampled mean cross-sectional area. The dashed line indicates the maximal cross-sectional area per diameter, assuming sphericity without cross-sectional sampling. (F) Synaptosomes that possessed a postsynaptic density (PSD) have a higher cross-sectional area, indicating that their cross-sectional sampling was closer to the maximum (paired one-tailed t test synaptosomes with vs. without PSD, p = 0.031; n = 4; brain regions pooled). (G) The fraction of synaptosomes with a PSD attached scales with cross-sectional synaptosome area percentile; plotted is the fraction of synaptosomes with a PSD for different percentiles. Line indicates 99% confidence interval. (H–J) (H) The number of synaptic vesicles, mitochondrial area (I), or fraction with a visible PSD (J) did not differ significantly between synaptosomes across the analyzed brain regions (normalized for synaptosome size, repeated measures ANOVAs; I: p = 0.083, J: p = 0.337, K: p = 0.15, same samples as in A). (K) Bipartite synaptosomes (synaptosomes containing both a pre- and postsynaptic element) have a resealed postsynaptic compartment in ∼25% of the cases, and the colors of the data points indicate that the synaptosomes originate from the same mice, albeit different brain regions. All error bars indicate SEM. (L) Representative images of synaptosomes after sorting acquired at a magnification of 4,100×. Recognizable ultrastructural features are annotated. Scale bars, 100 nm.
Figure S3
Figure S3
Comparison of synapse-enriched proteins with the SynGO database, related to Figure 2 (A) Bar plot showing the number of quantified protein groups per sample, sorted by cell types. Dash-dotted line indicates the mean number of quantified protein groups, and dotted line indicates the total number of quantified proteins in the experiment. 23% of the quantified protein groups contained a membrane domain; in UniProtKB/Swiss-Prot (Mus musculus), 26% of proteins are annotated with a membrane domain. (B) Left: log2 protein intensities across all mass spectrometry (MS) samples. Black dots indicate median intensity; upper and lower hinges the 25th and 75th percentiles. Right: violin plot showing the distribution of protein group coefficient of variation (CV) within conditions (synapse types), and the median CV was ∼20%. Boxplot indicates the median, 25th and 75th percentiles. (C) Euler diagram showing overlap between all quantified proteins, proteins that were identified as synapse-enriched, and the SynGO database. 81% of the SynGO-annotated proteins that were identified in our experiments were quantified as synapse-enriched. (D) Boxplot showing overlap with SynGO-annotated genes for all synapse types and the terms “synapse,” “presynapse,” and “postsynapse.” Each dot represents a synapse subtype. Overlap with SynGO was significantly higher for the term presynapse compared with the term postsynapse. n = 15, paired t test, ∗∗∗p < 0.001. (E) Boxplots showing percentage of novel synaptic proteins distinguished by brain region (left) or by cell type (right). We detected significantly more novel synaptic proteins in Gad2+ synapses compared with Camk2a+ synapses. n = 4 (Camk2a), 5 (Gad2), t test, ∗∗p < 0.01. (F) Bar plot showing selected significantly enriched KEGG pathways for all genes in SynGO, all synapse-enriched proteins, and the proteins identified as synapse-enriched but not previously annotated in SynGO. x axis shows the percentage of genes that were identified of the total number of genes that are associated with each term. Text indicates p value of the respective group. (G) The same as in (D) but for selected gene ontology terms. (H) Visualization of selected proteins that are associated with enriched terms in the “novel synapse-enriched” group using data from the STRING interaction database. Edges represent stringdb score >0.7 (high confidence).
Figure S4
Figure S4
Shared and subtype-specific enrichment of synaptic proteins, related to Figure 3 (A) Bar plot showing SynGO enrichment p values for the proteins that were identified in a minimum of 10, 11, 12, 13, or 14 of the total of 15 synapse types. (B) Distribution of proteins that were associated with the SynGO terms synaptic vesicle proton loading or synaptic vesicle endocytosis depending on groups defined by the minimum number of synapse types with which they were associated. The distribution for all synapse-enriched proteins is plotted for comparison. (C) Immunoblot validation. Representative immunoblots of sorted Camk2a+ and Gad2+ synaptosomes. Each lane corresponds to 25 Mio sorted synaptosomes. Displayed are two independent biological replicates (animals) per synapse type. (D) Histogram of immunoblot quantifications. p ≤ 0.05, ∗∗p ≤ 0.01, unpaired t test, two-tailed; the data reported are mean and SD. n = 3 for Vamp1, Vamp2, and Syt2; n = 4 for Syt12, Stx1b, complexin-1/2, and proton ATPase; n = 5 for Rab3c and Stx1a. (E) Correlation plot of immunoblot and mass spectrometry analysis. Dots represent log2FC measurements of either technology comparing Camk2a+ vs. Gad2+ for the indicated proteins. The dashed line represents a linear regression of the depicted data points. The gray area represents the standard error of the regression. Immunoblotting and mass spectrometry show a very high significant correlation (Pearson’s r = 0.95, p = 2.8e−5). (F) Heatmap for transsynaptic cell-adhesion molecules showing their variable presence in Camk2a+ and Gad2+ synaptic proteomes across brain regions. Black border around dots indicates a significant difference.
Figure 3
Figure 3
Synaptic proteome commonalities and differences (A) Bar plot showing proteins significantly enriched in the direct quantitative comparison of Camk2a+ vs. Gad2+ synaptic proteomes for each brain region. Shared proteins are defined as significantly enriched in both Camk2a+ and Gad2+ vs. control synaptosomes and not significantly different between Gad2+ and Camk2a+. Note the increased number of shared proteins in brain regions where Camk2a-cre and Gad2-cre label exclusive as well as overlapping synapse types (Figures S2A and S2B). The cerebellum lacked detectable tdTomato signal in the Camk2a::SypTOM mouse and therefore was replaced by the Syn1+ proteome. (B) Chord diagram of intersections between the groups defined in (A), with the 3 colors representing Camk2a+-enriched (green), Gad2+-enriched (red), or enriched in both (yellow). The arcs indicate overlapping proteins between the two connected groups. Note that there are few intersections (∼1% of synapse-enriched proteins) between Camk2a and Gad2 relative to Gad2 with shared and Camk2a with shared. (C) Dot plot of SynGO analysis results for shared and cell-type-specific enriched proteins. Depicted are selected significantly enriched SynGO terms of Camk2a-enriched, Gad2-enriched, and shared groups from cortex. (D) Protein interaction network of synaptic vesicle cycle proteins for cortical Camk2a, Gad2, or shared-enriched groups. Proteins with SynGO annotation for the synaptic vesicle cycle are displayed. Edges represent a stringdb score >0.7 (high confidence). Proteins that are associated with the significantly enriched terms “synaptic vesicle endocytosis,” “synaptic vesicle exocytosis,” and “synaptic vesicle proton loading” (data shown in C) are indicated on the left. (E) Heatmap for transsynaptic cell-adhesion molecules showing their presence in cortical and hippocampal Camk2a+ and Gad2+ synaptic proteomes. Black border color indicates significant enrichment in the direct comparison of Camk2a vs. Gad2 proteomes. Note that very few adhesion proteins were common in Camk2a+ and Gad2+ synaptic proteomes (<5%), and the majority show synapse-type-specific localization. See also Figure S4.
Figure 4
Figure 4
The synaptic protein-protein correlation network reveals protein communities (A) Density plot of pairwise protein-protein abundance profile correlations (Pearson’s r) for protein pairs that are annotated members of the same protein complex (purple) and for random protein pairs (gray) as control. Proteins of the same complex exhibited a highly co-regulated abundance profile across the 15 synapse types, whereas random protein pairs showed no correlation on average. Dashed lines denote median values for each group. The left tail of the distribution depicts negatively correlated protein pairs previously linked to a shared complex, which may arise because of differences in subcellular or cell-type-specific protein complexes or the formation of different complexes across various synapse types. (B) Community network of protein-protein correlations. The network represents a visualization of the adjacency matrix used for WGCNA. The nodes are synapse-enriched proteins, and they are connected by edges that represent the abundance profile correlation of the two nodes they connect. Specifically, edges represent adjacency based on biweight midcorrelation and are filtered for weights >0.3, meaning negative and low correlations are not considered for visualization of the network. Protein nodes are colored according to their associated protein module. Only synapse-type-enriched proteins without missing values are used for the analysis (1,557 proteins). (C) Heatmap of module correlations with synaptic traits. Protein module Eigen proteins were correlated with the following traits of the 15 synapse types: cell type, brain region, and immunofluorescence for vGat and VGlut1. Protein module Eigen proteins are protein abundance profiles that are representative for the proteins in their module (specifically, the first principle component of the module). p < 0.05; ∗∗p < 0.01; ∗∗∗p < 0.001; Pearson correlation. (D) Network from (B) with the protein nodes colored for correlation with vGat immunoreactivity (top) and VGlut1 immunoreactivity (bottom), revealing the nature of the two protein communities. The proteins of the left community showed a correlation with the vGat and an anti-correlation with VGlut1, whereas the proteins of the right community showed a correlation with vGlut1 and an anti-correlation with vGat. (E) Subnetwork from (B) depicting only the proteins from modules that were significantly correlated with vGat immunofluorescence (modules 9, 10, and 11). Selected proteins of interest are highlighted with an increased border width. (F) Ridge plots for pathways enriched in VGlut1 and vGat protein communities showing enrichment distribution for core-enriched genes of selected significantly enriched terms. GSEA was conducted using the Kyoto Encyclopedia of Genes and Genomes (KEGG) pathway database, and proteins ranked by their correlation with vGat and VGlut1 immunofluorescence. (G) Heatmap for selected negatively correlated protein pairs showing presence in cortical and hippocampal Camk2a+ and Gad2+ synaptic proteomes. Black border color indicates a significant enrichment in the direct comparison Camk2a vs. Gad2 proteomes. The full list of negatively correlated protein pairs is in Table S3 and displayed in Figure S5. (H) Correlation plots for selected negatively correlated protein pairs. Dots represent the log2fold-change (FC) for each protein on the x and y axes compared with unsorted controls for each synapse type. The color indicates the cell type underlying the synapse type. The dashed lines represent a linear regression through the indicated data points. Pearson’s r and statistical significance are indicated at the bottom of each plot. See also Figure S5.
Figure S5
Figure S5
Validation of the protein-protein correlation network, related to Figure 4 (A) STRING network of proteins that are associated with the three modules that were significantly correlated with vGat (modules 9, 10, and 11). Edges are based on stringdb score >0.4. (B) Bar plot showing number of hubs from the network in (A) for each module. Hubs are defined as the top 10% most connected proteins in the network (centrality parameter “degree”). Modules 9, 10, and 11 represent the modules that were significantly correlated with vGat immunofluorescence. The core module (module 10) of the protein-protein correlation network also contains the most hubs in the STRING network from (A), and the auxiliary modules of the protein-protein correlation network (modules 9 and 11) account for fewer hubs in the STRING network. (C) Ridge plots for pathways enriched in vGlut1 and vGat protein communities. Ridge plots show enrichment distribution for core-enriched genes of selected significantly enriched terms. Gene set enrichment analysis (GSEA) was conducted, and proteins were ranked by their correlation with vGat (right) and vGlut1 (left) immunofluorescence. (D) Heatmap for negatively correlated protein pairs showing relative enrichment or de-enrichment across the 15 synaptic proteomes. Black around dots indicates a significant difference in the direct comparison of Camk2a vs. Gad2 proteomes. The protein correlations and p values of the negatively correlated protein pairs are in Table S3.
Figure 5
Figure 5
The dopaminergic synaptic proteome (A) Representative images of an immunostained brain section from a Dat::SypTOM mouse showing tdTomato present in the nigrostriatal pathway. Fluorescent signal was detected in the cell bodies of the ventral tegmental area (VTA), substantia nigra (SN), and their associated projections to striatal areas caudate putamen (CP) and nucleus accumbens (ACB). Scale bars, 500 μm. (B) Representative image depicting overlap between tyrosine hydroxylase (Th) immunoreactivity with tdTomato fluorescence in the striatum of a Dat::SypTOM mouse. Scale bars, 5 μm. (C) Analysis of data shown in (B) supplemented by correlation of tdTomato immunoreactivity with VGlut1 and vGat in the striatum of Dat::SypTOM mice. n = 2–4 animals, 2–4 images per mouse, error bars = the standard error of the mean. (D) Violin plots for two representative proteins showing the specific enrichment (amino oxidase A, Maoa, a marker for dopaminergic neurons) or depletion (oxidation resistance protein 1 [Oxr1]) in dopaminergic synaptic terminals compared with all other synapse types. (E) Scatter plot comparing the differential enrichment of proteins in the Dat+- and Syn1+-synaptosomes to their striatal control synaptosome precursor populations. Colors indicate proteins that were significantly enriched in Dat+-sorted synaptosomes (green), Syn1+-sorted synaptosomes (pale cyan), significant in both populations (orange), or significantly de-enriched in both (pale pink). (F) Dot plot of selected significantly enriched pathways (KEGG) of GSEA comparing exclusively dopaminergic synapse-enriched proteins with shared-enriched proteins between dopaminergic and all striatal synapses (Syn1+). (G) Scheme showing selected top-enriched proteins (Dat+ compared with unsorted controls or Syn1+) within the presynaptic terminal. The ten proteins with the highest fold-change difference compared with Syn1+ and unsorted controls are highlighted with a black border. See also Figure S6.
Figure S6
Figure S6
Analysis of the dopaminergic synaptic proteome, related to Figure 5 (A) Violin plots for representative proteins showing specific enrichment or specific depletion in dopaminergic synaptic terminals compared with all other synapse types. (B) Validation of Oxr1, Mapk3, and Atp6v1g1 enrichment or de-enrichment at Dat+ vs. Syn1+ synapses. Left: representative immunoblots of striatal Syn1+ and Dat+ synaptosomes. Each lane corresponds to 20 Mio sorted synaptosomes. Shown are two independent replicates per genotype. Right: histograms of the corresponding quantifications of the immunoblots. ∗∗p ≤ 0.01, unpaired t test, two-tailed; the data reported are mean and SD. n = 5 for Mapk3 and Oxr1; n = 4 for Atp6v1g1. (C) Scheme showing selected proteins that were enriched in Dat+ synapses and Syn1+ synapses within the presynaptic terminal. (D) SDS-PAGE and immunoblot of the different fractions of the synaptosome preparation (H, homogenate; S1, soluble fraction; F2/3, synaptosome fraction) from mouse striatum (n = 3 biological replicates). Although in the F2/3 fractions synaptic proteins PSD95 and Th were enriched, the nuclear protein histone H3 was not detectable. The constitutive proteasome subunits PSMA3 and PSMB5 as well as the PA28 regulatory particle subunit PSME1 were found across all fractions at comparable levels. By contrast, the immunoproteasome subunit PSMB8 was only detected in the purified 20Si proteasome sample. (E) Immunoblot of a PSME1 co-immunoprecipitation experiment using primary rat cortical neurons. The experiment shows that in rat cortical neurons PSME1 interacted with the constitutive 20S proteasome. (F) SDS-PAGE of mouse striatal F2/3 fractions and purified 20Si proteasome assayed for proteasome activity using an activity-based probe. Although activity corresponding to the PSMB10 subunit of the 20Si proteasome was visible in the purified sample, this was not the case in the F2/3 striatal fractions. Asterisks indicate non-specific bands. (G) Re-analysis of published single-cell RNA sequencing (scRNA-seq) data showing expression of proteasomal genes in midbrain dopaminergic neurons. mRNA for the constitutive proteasome subunits was detected, whereas mRNA of 2 of 3 immunoproteasome subunits was not detected.
Figure S7
Figure S7
Inhibitory synaptic proteomes of the hippocampus, related to Figure 6 (A) Number of protein groups quantified for each hippocampal subfield interneuron synapse type. Shown are significantly enriched and de-enriched groups as well as protein groups that are not significantly different between the groups. (B) PCA of Gad2+-enriched and unsorted control samples from hippocampal subfields. Note distinct clustering of control samples and interspersed Gad2+-enriched samples, indicating global subfield-specific differences in proteome composition in crude synaptosome fractions but not Gad+-enriched fractions. (C) Bar plot showing significantly different protein groups for comparisons between unsorted controls or Gad2+-enriched fraction. (D) Correlation plots of Gad2+-enriched fractions vs. unsorted controls comparing different hippocampal formation subfields. Note the significant high correlation between all subfields and shared enrichment of inhibitory synapse marker proteins, indicating high similarity of Gad2+-enriched synaptic proteomes across hippocampal subfields. (E) Boxplots for some selected proteins that showed subfield-specific enrichment in unsorted control fractions (upper) and the absence of regulation of these proteins in Gad2+-enriched fractions.
Figure 6
Figure 6
Proteomic diversity of Gad2, parvalbumin, somatostatin, and vasointestinal active peptide synapses (A) Scheme showing the different mouse lines from which cortical synaptosomes were prepared. (B) Plot indicating the relative abundance of each fluorescently labeled synapse type in the crude cortical synaptosome fraction. (C) Plot indicating the purity of each fluorescently labeled cortical interneuron synaptosome type after FASS. For all types, the average purity exceeded 80%. Purity is assessed by re-analysis of the sorted fraction by synaptosome flow cytometry. (D) Number of protein groups quantified for each cortical interneuron synapse subtype. Shown are significantly enriched and de-enriched groups as well as protein groups that are not significantly different between the groups. (E) PCA of synaptic proteomes from cortical inhibitory subtypes. (F) Dot plot of selected significantly enriched pathways (KEGG) of GSEA comparing cortical interneuron types with one another. Analysis is based on protein lists ranked by log2FC of the synapse types indicated on the x axis. (G) Boxplots for representative proteins that show specific enrichment in the indicated cortical interneuron subtype. Boxplot indicates the median, 25th and 75th percentiles. See also Figures S7 and S8.
Figure S8
Figure S8
Supplementary analysis for cortical interneuron subtype proteomes, related to Figure 6 (A) Left: sagittal overview of SypTOM expression in a PV::SypTOM mouse and below an overview of SypTOM expression throughout the cortex of a PV::SypTOM mouse. The relative density of the SypTOM signal across the different cortical layers is plotted on the side. This analysis provides an overview of PV+ synapse abundance across the cortical layers. Right: representative image of a immunofluorescent co-staining for the inhibitory synapse marker solute carrier family 32 member 1 (vGat) and the synaptotagmin-2 (Syt2), a marker for synapses formed by PV neurons, both in green, and of SypTOM expression, in purple, in the CX of a PV::SypTOM mouse. Overlap is depicted in black; SypTOM overlaps with Syt2 and partially with vGat, which is further illustrated by maximum normalized fluorescent intensity line plots. (B) Same as (A) but for the SST::SypTOM mouse and the SST-neuron marker protein somatostatin. (C) Same as (A) but for the VIP::SypTOM mouse and the VIP-neuron marker protein VIP peptides. (D) Validation of labeling specificity of SST::SypTOM and VIP::SypTOM mice. Representative images for both mouse lines showing RNA fluorescence in situ hybridization (FISH) signal for sst and TdTomato mRNA, immunoreactivity for the Vip protein, and TdTomato fluorescence. Scale bars, 50 μm. (E) Quantification of the experiment shown in (D). Both mouse lines show a high labeling specificity for their respective cell type. Around 90% of the cells that express TdTomato in SST::SypTOM mice express sst mRNA, and very few show immunoreactivity for Vip. The inverse is true for VIP::SypTOM mice. n = 3, each bar represents one animal. (F) KEGG pathway enrichment analysis of cortical interneuron proteomes. (G) Boxplots for indicated representative proteins show specific enrichment in the indicated cortical interneuron subtypes. Boxplots indicate the median, 25th and 75th percentiles of standardized (Z score) protein abundances. Black dots, outliers.

References

    1. Hanus C., Schuman E.M. Proteostasis in complex dendrites. Nat. Rev. Neurosci. 2013;14:638–648. - PubMed
    1. Magee J.C., Grienberger C. Synaptic plasticity forms and functions. Annu. Rev. Neurosci. 2020;43:95–117. - PubMed
    1. de Wit J., Ghosh A. Specification of synaptic connectivity by cell surface interactions. Nat. Rev. Neurosci. 2016;17:22–35. - PubMed
    1. O’Rourke N.A., Weiler N.C., Micheva K.D., Smith S.J. Deep molecular diversity of mammalian synapses: why it matters and how to measure it. Nat. Rev. Neurosci. 2012;13:365–379. - PMC - PubMed
    1. Koopmans F., van Nierop P., Andres-Alonso M., Byrnes A., Cijsouw T., Coba M.P., Cornelisse L.N., Farrell R.J., Goldschmidt H.L., Howrigan D.P., et al. Syngo: an evidence-based, expert-curated knowledge base for the synapse. Neuron. 2019;103:217–234.e4. - PMC - PubMed

Publication types

LinkOut - more resources