. 2023 Nov;11(11):e007661.
doi: 10.1136/jitc-2023-007661.

Th17-inducing dendritic cell vaccines stimulate effective CD4 T cell-dependent antitumor immunity in ovarian cancer that overcomes resistance to immune checkpoint blockade

Affiliations

Th17-inducing dendritic cell vaccines stimulate effective CD4 T cell-dependent antitumor immunity in ovarian cancer that overcomes resistance to immune checkpoint blockade

Yan Luo et al. J Immunother Cancer. 2023 Nov.

Abstract

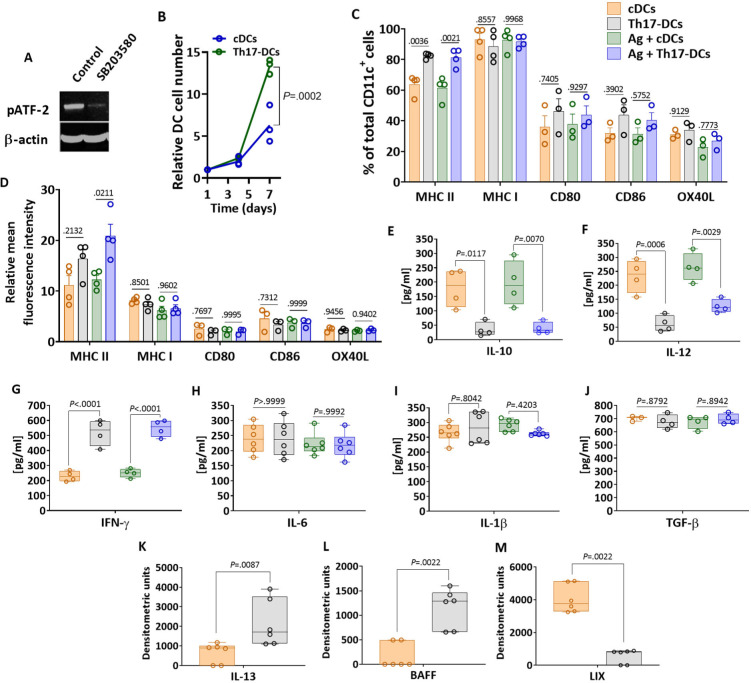
Background: Ovarian cancer (OC), a highly lethal cancer in women, has a 48% 5-year overall survival rate. Prior studies link the presence of IL-17 and Th17 T cells in the tumor microenvironment to improved survival in OC patients. To determine if Th17-inducing vaccines are therapeutically effective in OC, we created a murine model of Th17-inducing dendritic cell (DC) (Th17-DC) vaccination generated by stimulating IL-15 while blocking p38 MAPK in bone marrow-derived DCs, followed by antigen pulsing.

Methods: ID8 tumor cells were injected intraperitoneally into mice. Mice were treated with Th17-DC or conventional DC (cDC) vaccine alone or with immune checkpoint blockade (ICB). Systemic immunity, tumor associated immunity, tumor size and survival were examined using a variety of experimental strategies.

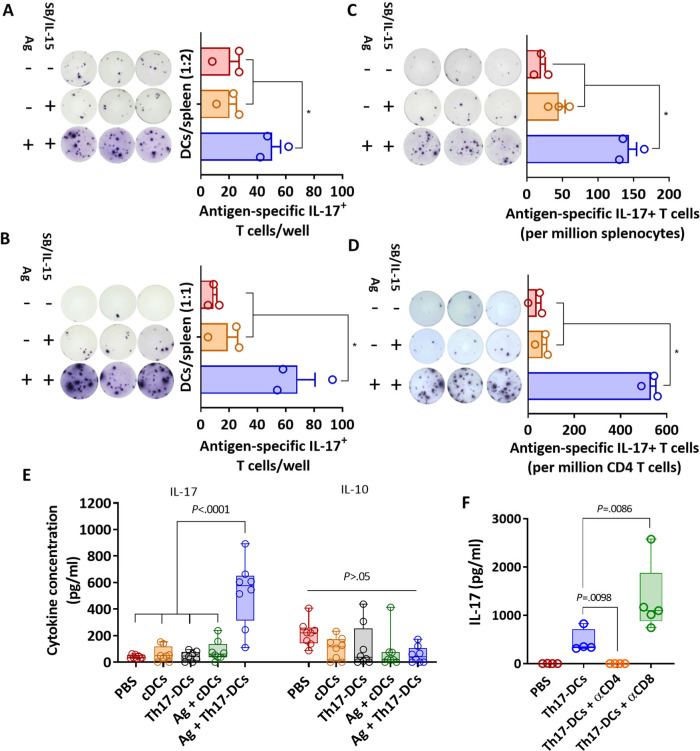
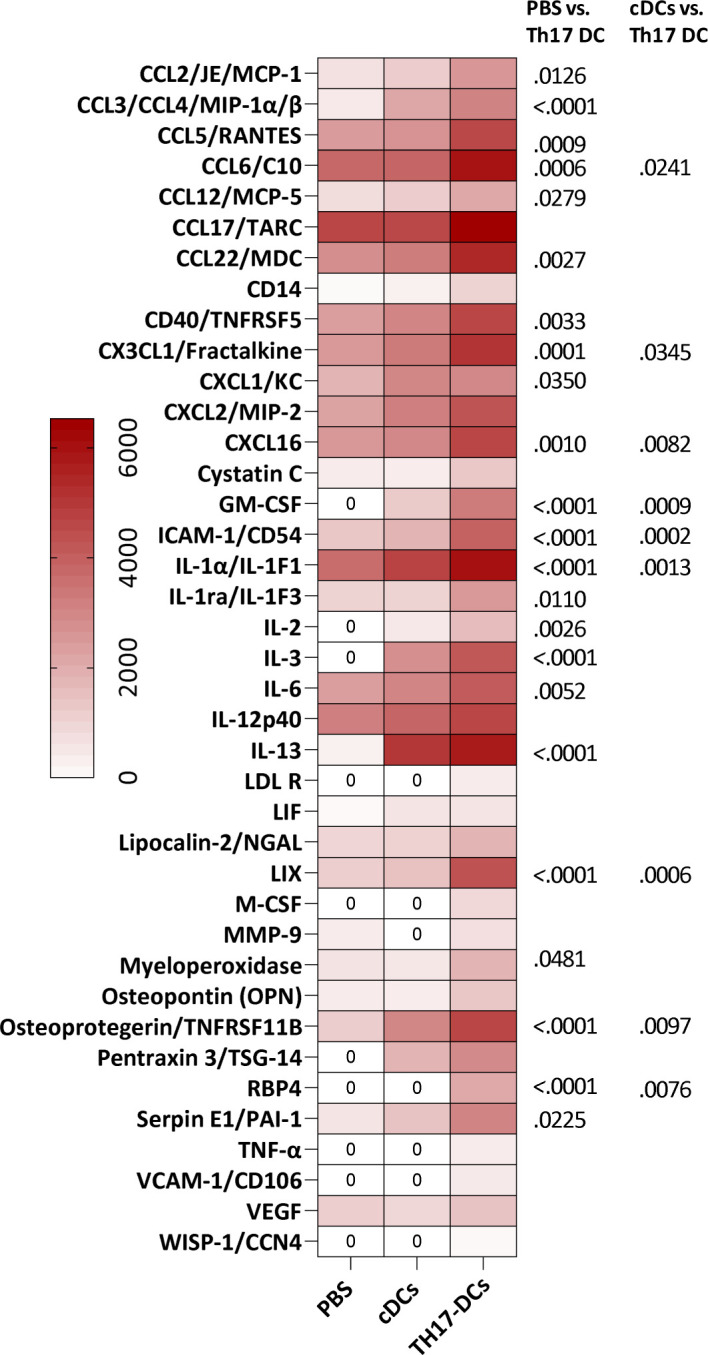
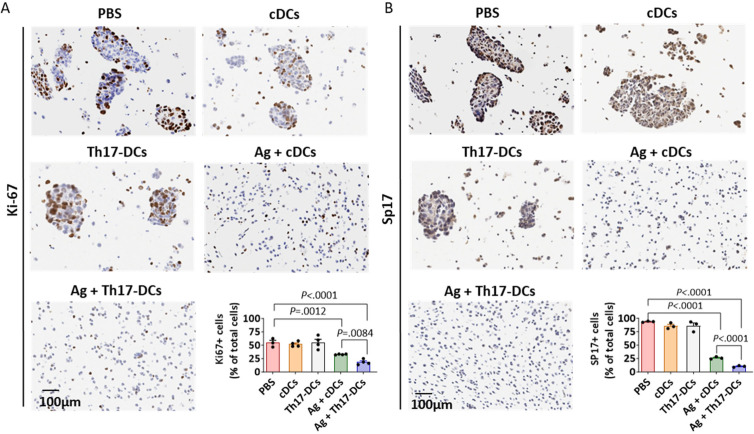
Results: Th17-DC vaccines increased Th17 T cells in the tumor microenvironment, reshaped the myeloid microenvironment, and improved mouse survival compared with cDC vaccines. ICB had limited efficacy in OC, but Th17-inducing DC vaccination sensitized it to anti-PD-1 ICB, resulting in durable progression-free survival by overcoming IL-10-mediated resistance. Th17-DC vaccine efficacy, alone or with ICB, was mediated by CD4 T cells, but not CD8 T cells.

Conclusions: These findings emphasize using biologically relevant immune modifiers, like Th17-DC vaccines, in OC treatment to reshape the tumor microenvironment and enhance clinical responses to ICB therapy.

Keywords: Antigens; CD4-Positive T-Lymphocytes; Immunomodulation; Immunotherapy, Active; Tumor Escape.


Conflict of interest statement

Competing interests: MC is an inventor on a patent filed by the University of Arkansas, entitled ‘Inhibition of dendritic cell-driven regulatory T cell activation and potentiation of tumor antigen-specific T cell responses by interleukin-15 and MAP kinase inhibitor.’ KLK and MB are inventors on a patent filed by the Mayo Clinic, entitled ‘Dendritic Cell Based Vaccines Combined with Pembrolizumab for the Treatment of Advanced Ovarian Cancer.’

Figures

Figure 1
Figure 1
IL-15 costimulation and p38 MAPK blockade selectively upregulates expression of MHC class II and IFN-γ while suppressing IL-10 and IL-12 production. (A) Representative western blot of phospho-ATF-2 and β-actin in DCs treated with (SB203580) or without (Control) IL-15 and SB203580. DC matured with combination of IL-15 and SB203580 here referred to as Th17-DCs. (B) Line depicts the mean (n=3) relative cells numbers of DCs generated using conventional DC maturation (cDC) or Th17-DC maturation. (C) Bars show mean (+SE, n=3–4) percentage of CD11C+ DCs positive for MHC class II, MHC class I, CD80, CD86 and OX40L. DCs were prepared under cDC or Th17-DC conditions and pulsed with or without tumor lysates (Ag). (D) bars (+SE, n=3–4) show relative mean fluorescence intensity of surface expression of MHC class II, MHC class I, CD80, CD86 and OX40L on cells derived from C. (E–J) box and whisker plots of (n=4) cell culture supernatant concentrations of (E) IL-10, (F) IL-12, (G) IFN-γ, (H) IL-6, (I) IL-1β, and (J) TGF-β in DCs stimulated under cDC or Th17-DC conditions in the presence or absence of tumor cell lysates (Ag). Refer to legend in C. Each symbol is a unique replicate. Inset p values above lines and bars were calculated with one-way ANOVAs followed by the Tukey’s multiple comparisons test. K-M, Bars show box and whisker plots of densitometric units (n=6) derived from dots blots of IL-13 (K), BAFF (L) and LIX (M) from three independent experiments. P values were calculated using Mann-Whitney tests. Data shown are representative of three independent experiments. ANOVA, analysis of variance; DC, dendritic cell; MHC, major histocompatibility complex.
Figure 2
Figure 2
IL-15 costimulation and p38-MAPK blockade specifically empowers DC vaccines to generate IL-17+ T cells and high avidity antibodies in vivo in addition to IFN-γ+ and IL-4+ T cells. (A–C) Representative ELISpot wells and min/max box and whisker plots (n=9–18) depicting the number of antigen-specific IFN-γ+ (A), IL-4+ (B), and IL-17+ (C) T cells per million splenocytes following vaccination with PBS or with cDCs or Th17-DCs that were either pulsed or not pulsed with tumor lysate antigen (Ag). (D–E) The min/max box and whisker plots showing total tumor (D) and high avidity (E) antigen-specific- IgG antibody levels (n=12–18) in the blood. The results shown are derived from three independent experiments. Each symbol is a unique replicate. P values shown in (A–C) compare Ag+DC and Ag+Th17 DC. P values were calculated with one-way ANOVAs followed by the Tukey’s multiple comparisons test (A–C) or Fisher’S LSD test (D–E). ANOVA, analysis of variance; cDC, conventional dendritic cell.
Figure 3
Figure 3
IL-15 costimulation and p38-MAPK blockade empowers DC vaccines to rapidly generate antigen-specific Th17 T cells in vitro and in vivo. (A–B) Representative images of ELISpot wells and bar graphs depicting the mean (+SEM, n=3) number of antigen-specific IL-17+T cells/well following in vitro DC vaccination with or without SB203580/IL-15 (SB/IL-15) and tumor cell lysate (Ag) at different ratios DC/splenocyte ratios 1:2 (A) and 1:1 (B) for 72 hours. (C) Representative IL-17 ELISpot analysis wells and bar graphs which depict the mean (+SEM, n=3) number of antigen-specific IL-17+T cells per million splenocytes in mice immunized in vivo with or without SB/IL-15 and tumor cell lysate (Ag). (D) Representative ELISpot wells and bar graphs that depict the mean (+SEM, n=3) number of Th17 T cells per million purified CD4+T cells isolated from splenocytes shown in (C). (E) The min/max box and whisker plots (n=8) of the levels of IL-17 and IL-10 in the peripheral blood of tumor-bearing mice (vaccinated with PBS, non-antigen pulsed cDCs (cDCs), non-antigen Th17-DCs (Th17-DCs), antigen-pulsed cDCs (Ag+cDCs), antigen-pulsed Th17-DCs (Ag+Th17 DCs)) at day 42 following tumor challenge and vaccination with PBS, cDCs or Th17-DCs pulsed with or without antigen. (F) Levels of IL-17 in the blood in tumor-bearing mice immunized as in vivo with either PBS, antigen-pulsed Th17-DC vaccines along with either anti-CD4 or anti-CD8 antibody to deplete CD4 or CD8 T cells, respectively. *p<0.05. P values were calculated with one-way ANOVAs followed by the Tukey’s multiple comparisons test. ANOVA, analysis of variance; cDC, conventional dendritic cell; PBS, phosphate buffered saline.
Figure 4
Figure 4
Th17-DC vaccination induces a unique T cell:APC cytokine network. Figure shows a heat map summary of cytokines detected with dot blotting following cDC stimulation of purified CD4 T cells derived from splenocytes of mice immunized with PBS, antigen pulsed cDCs, or antigen-pulsed Th17-DCs. Each box is the median of 6–8 replicates. Adjusted p values (far right two columns) were calculated using one-way ANOVA followed by the Tukey’s multiple comparisons test. Medians of zero are marked. ANOVA, analysis of variance; cDC, conventional dendritic cell; PBS, phosphate buffered saline.
Figure 5
Figure 5
Th17-inducing vaccines eliminate tumor cell load into the peritoneal cavity. (A, B) Representative Ki67 (A) or SP17 (B) IHC analysis of peritoneal washings from tumor-bearing mice at day 42 in mice immunized with PBS, non-antigen pulsed cDCs (cDCs), non-antigen Th17-DCs (Th17-DCs), antigen-pulsed cDCs (Ag+cDCs), antigen-pulsed Th17-DCs (Ag+Th17 DCs). Brown spots indicate the positive staining. Inset graphs in A and B depict the mean (±SE, n=3–4) percent of Ki-67+or SP17+ cells as a percent of total cells. P values were with calculated using ANOVA followed by Tukey’s multiple comparisons test. ANOVA, analysis of variance; cDC, conventional dendritic cell; IHC, immunohistochemistry; PBS, phosphate buffered saline.
Figure 6
Figure 6
Vaccination induces infiltration of T cells into tumor tissue and extends the lifespan of mice bearing OC. (A) Kaplan-Meier survival analysis of mice (n=13–16/group) immunized with PBS control, non-antigen pulsed cDCs (cDCs), non-antigen pulsed Th17-inducing DCs (Th17-DCs), antigen-pulsed cDCs (Ag+cDCs) or antigen-pulsed Th17-DCs (Ag+Th17 DCs). (B) Kaplan-Meier survival analysis of mice (n=14–25/group) immunized with PBS control, or antigen-pulsed Th17-DCs (Ag+Th17 DCs) with or without CD4 (αCD4) or CD8 (αCD8) T cell depletion. (C) The mean (±SE, n=6) levels of IL-17 in the ascites fluid of representative tumor-bearing mice at sacrifice in the same groups depicted in (A). (D) CD3, CD4 and CD8 IHC analysis in tumor tissue harvested at sacrifice in mice treated with PBS, antigen-pulsed cDCs or antigen-pulsed Th17-DCs. (E–G) The min/max box and whisker plots depicting the levels of CD3 (E), CD4 (F), and CD8 (G) T cells per field analyzed. (H) Min-max box and whiskers plots of levels of antigen-specific antibodies (n=12–18) in blood and ascites. (I) Kaplan-Meier survival analysis of either wild-type (WT) or IL-17 knockout (KO) mice (n=5–10/group) immunized with PBS or antigen-pulsed Th17-DCs (Th17-DCs). Inset p values (**p<0.05, ****p<0.0001) for (A, B) were calculated using Mantel-Cox log rank test. P values for (C–H) were calculated with one-way ANOVA followed by Fisher’s LSD test. Light blue inset lines on the x-axis in A, D, I show approximate treatment period. ANOVA, analysis of variance; cDC, conventional dendritic cell; IHC, immunohistochemistry; PBS, phosphate buffered saline; MDSC, myeloid derived suppressor cells.
Figure 7
Figure 7
Th17-DC vaccination synergizes with immune checkpoint blockade in a CD4 T cell dependent manner. (A) PD-L1 staining of the tumor cells derived from the peritoneal cavity on Day 42. (B) The min/max box and whisker plots (n=10/group) depicting PD-1 expression on surface of CD4 and CD8 T cells derived from mice vaccinated with either PBS or antigen-pulsed Th17 DC vaccines. P values were calculated with an unpaired Student’s t-test. C) A Kaplan-Meier curve comparing survival in tumor-bearing mice (n=8/group) immunized with PBS, antigen-pulsed Th17-DC vaccines, anti-PD-1 (αPD-1), the combination of anti-PD-1 and Th17-DC vaccine (*p<0.05, ****p<0.0001). P values were calculated using Mantel-Cox log rank test. Light blue inset line on the x-axis shows approximate treatment period. (D) The min/max box and whisker plots (n=9–18) depicting the levels of splenic antigen-specific IFN-γ+, IL-4+ and IL-17+T cells at day 42 in tumor-bearing mice immunized and treated with αPD-1 as in (B). (E) Levels of serum antibodies targeting tumor antigens at day 42. P values in (D) and (E) were calculated with one-way ANOVA followed by Fisher’s LSD test. (F) The min/max box plots (n=2–7/group) number of cells recovered from the peritoneal cavity at day 42 in mice immunized with PBS, Th17-DC vaccine, αPD-1 or combination Th17-DC vaccine and αPD-1. NS=Not significant, P value calculated by Mann-Whitney U test. (G) The min/max box plots depicting the distribution of peritoneal immune cells in the lymphocyte (lymphs), monocyte (DCs/Macs), and granulocyte (Gran) gates from mice treated as in (F) (n=4–6/group). (H) The min/max box plots depicting the relative levels of total and activated (CD69+) CD4+ and CD8+ T cells and B cells and NK cells in the lymphocyte gate at day 42 following treatment of mice as described in (E) (n=4–6/group). (I) The relative levels of CD11b+CD11c+DCs, CD11b+F4/80+macrophages (Macs) and CD11b+GR-1+ MDSCs in the monocyte gate at day 42 following treatment of mice as described in A (n=4–6/group). (J) The relative levels of CD11b+Ly6G+ (neutrophils, Neut), CD11b+CD193+SiglecF+ (eosinophils, Eosin) and CD11b+CD200 R3+FcεRIα+ (Basophils, Baso) in the granulocyte gate at day 42 following treatment of mice as described in A (n=4–6/group). P values for (F–J) were calculated using a one-way ANOVA followed by Fisher’s LSD post hoc test. (K) The min/max box plots of IL-10 levels (pg/mL) in ascites fluid of moribund mice (n=3–10) following treatment as described in (C). P values were calculated with unpaired Student’s t-test. ANOVA, analysis of variance; cDC, conventional dendritic cell; PBS, phospate buffered saline; MDSCs, myeloid derived suppressor cells.

References

    1. DeSantis CE, Ma J, Gaudet MM, et al. Cancer statistics, 2019. CA Cancer J Clin 2019;69:438–51. 10.3322/caac.21583 - DOI - PubMed
    1. Mirza MR, Pignata S, Ledermann JA. Latest clinical evidence and further development of PARP inhibitors in ovarian cancer. Ann Oncol 2018;29:1366–76. 10.1093/annonc/mdy174 - DOI - PubMed
    1. Cress RD, Chen YS, Morris CR, et al. Characteristics of long-term survivors of epithelial ovarian cancer. Obstet Gynecol 2015;126:491–7. 10.1097/AOG.0000000000000981 - DOI - PMC - PubMed
    1. Odunsi K. Immunotherapy in ovarian cancer. Ann Oncol 2017;28:viii1–7. 10.1093/annonc/mdx444 - DOI - PMC - PubMed
    1. Kryczek I, Banerjee M, Cheng P, et al. Phenotype, distribution, generation, and functional and clinical relevance of Th17 cells in the human tumor environments. Blood 2009;114:1141–9. 10.1182/blood-2009-03-208249 - DOI - PMC - PubMed

Publication types

Substances