. 2023 Nov 2;14(1):7030.
doi: 10.1038/s41467-023-42704-6.

A neurodegeneration checkpoint mediated by REST protects against the onset of Alzheimer's disease

Affiliations

A neurodegeneration checkpoint mediated by REST protects against the onset of Alzheimer's disease

Liviu Aron et al. Nat Commun. .

Abstract

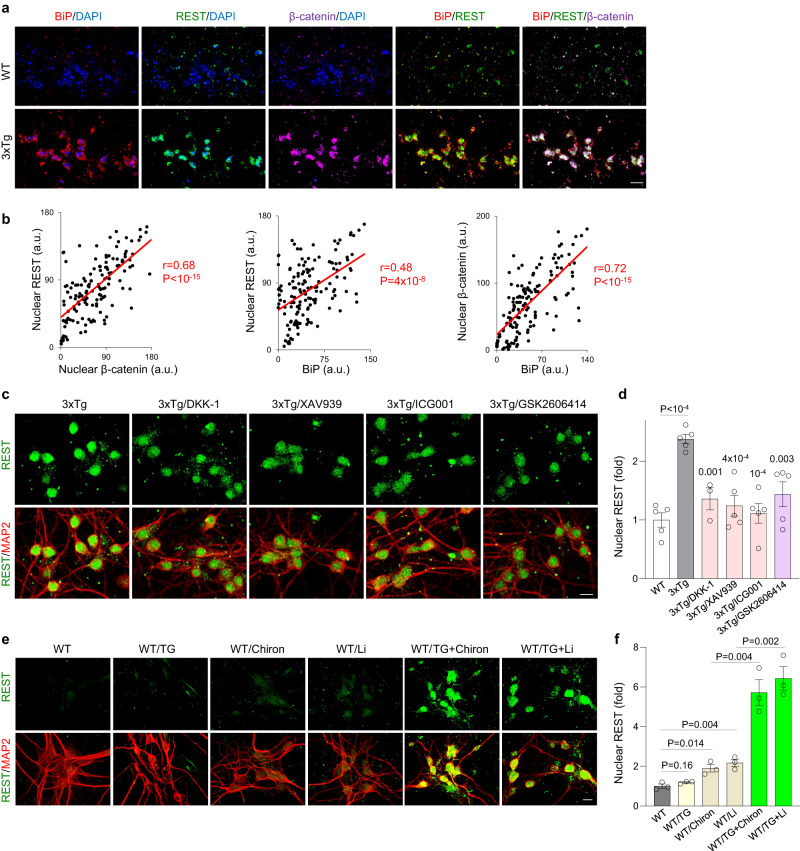
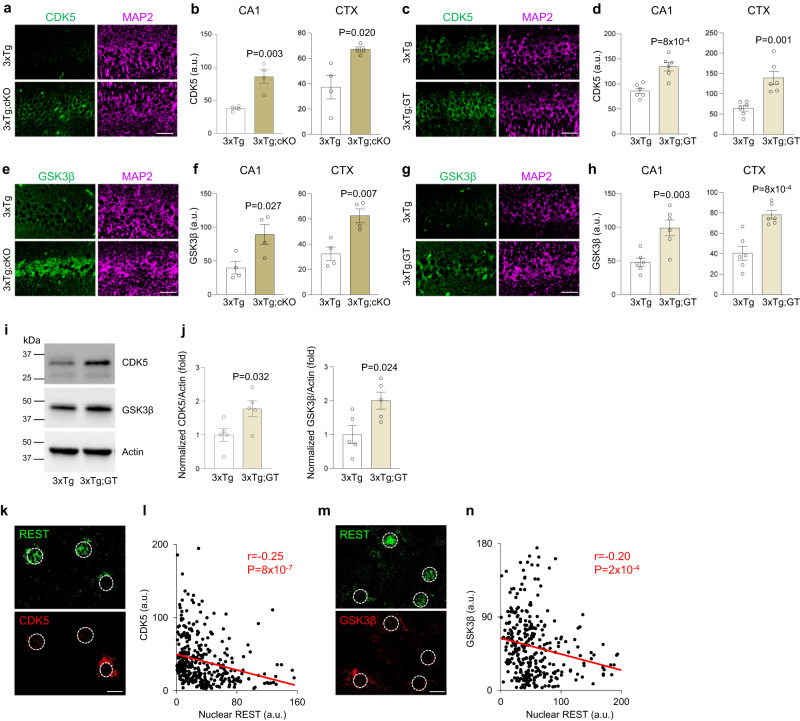
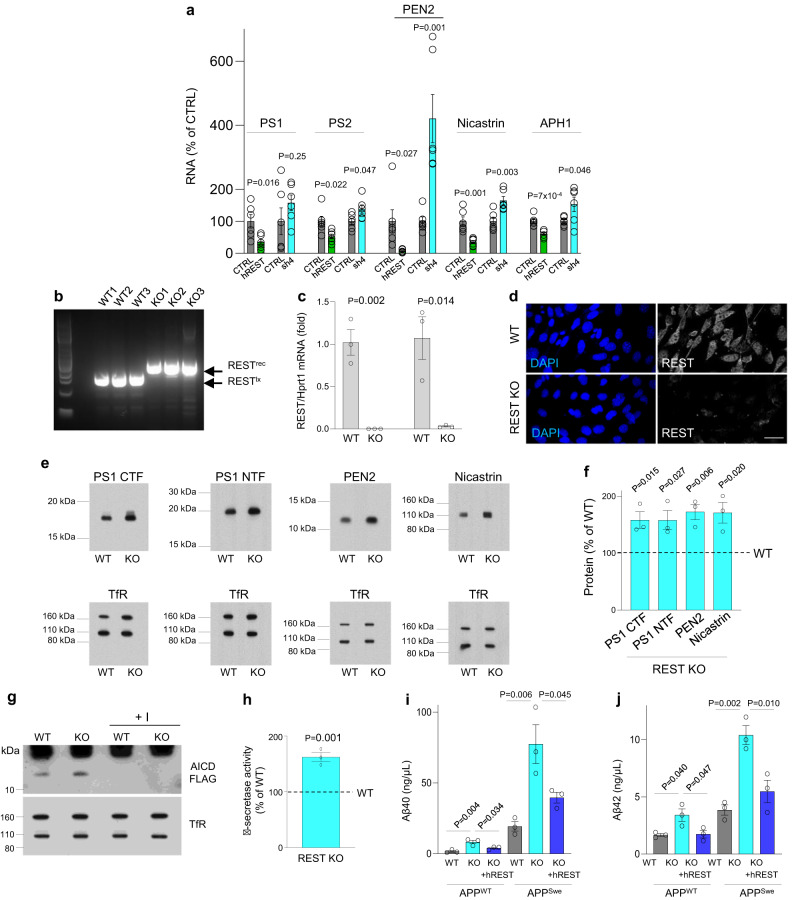
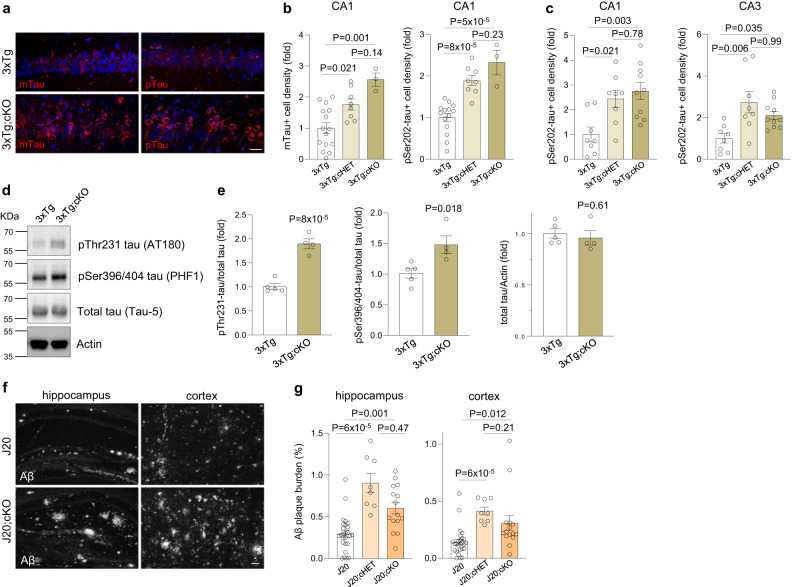
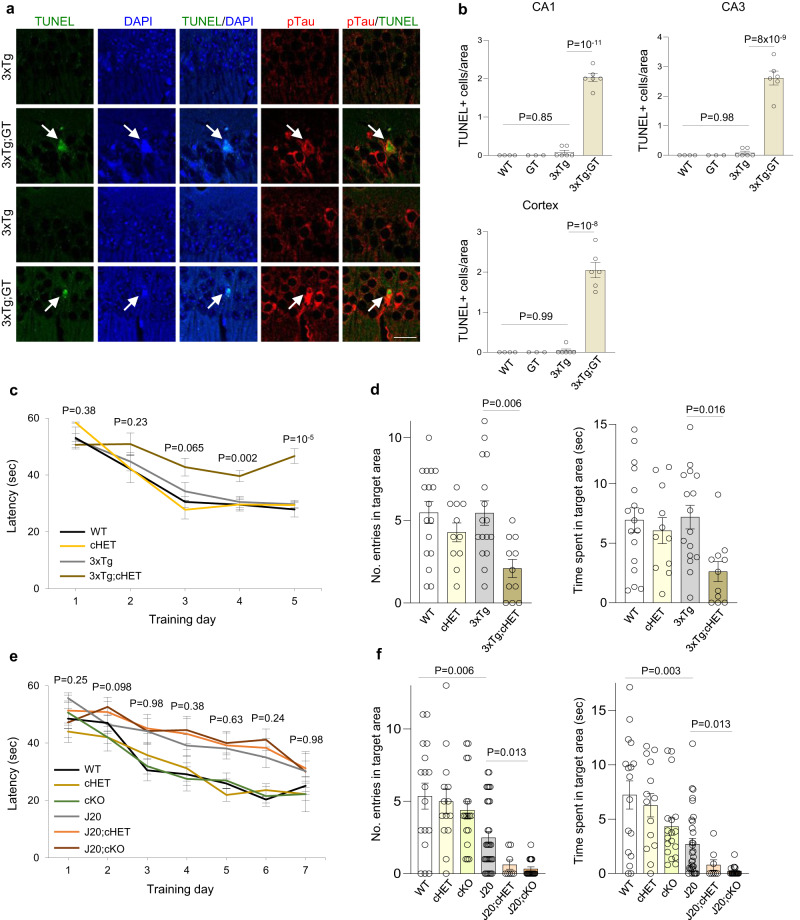
Many aging individuals accumulate the pathology of Alzheimer's disease (AD) without evidence of cognitive decline. Here we describe an integrated neurodegeneration checkpoint response to early pathological changes that restricts further disease progression and preserves cognitive function. Checkpoint activation is mediated by the REST transcriptional repressor, which is induced in cognitively-intact aging humans and AD mouse models at the onset of amyloid β-protein (Aβ) deposition and tau accumulation. REST induction is mediated by the unfolded protein response together with β-catenin signaling. A consequence of this response is the targeting of REST to genes involved in key pathogenic pathways, resulting in downregulation of gamma secretase, tau kinases, and pro-apoptotic proteins. Deletion of REST in the 3xTg and J20 AD mouse models accelerates Aβ deposition and the accumulation of misfolded and phosphorylated tau, leading to neurodegeneration and cognitive decline. Conversely, viral-mediated overexpression of REST in the hippocampus suppresses Aβ and tau pathology. Thus, REST mediates a neurodegeneration checkpoint response with multiple molecular targets that may protect against the onset of AD.


Conflict of interest statement

The authors declare no competing interests.

Figures

Fig. 1
Fig. 1. REST and the onset of AD pathology.
a Induction of REST in neurons with early AD pathology. Labeling of REST (green), the early tau pathology marker pSer202-tau (antibody CP13, red) and DNA (DAPI, blue) in the aging human prefrontal cortex shows increased nuclear REST in an NCI case with early AD-type pathology relative to no pathology, and reduced REST levels in AD. CP13 labeling (red) shows broad accumulation of phosphorylated tau in neurites, and in some neuronal cell somas, in NCI cases with early pathology (middle panel), and a strong increase in tau accumulation in neurites and neuronal cell bodies in AD (lower panel). Scale bar, 25 µm. b Quantification of nuclear REST levels in pyramidal neurons of the prefrontal cortex in NCI cases with no pathology (n = 21), early pathology (n = 30), mid pathology (n = 26) and late pathology (n = 5), as well as in AD cases with no pathology (n = 3), early pathology (n = 3), mid pathology (n = 13) and late pathology (n = 44). Neurons were identified by co-labeling with the neuron marker MAP2 (see Supplementary Fig. 1d). See Supplementary Fig. 1b for the relative distribution of each level of pathology in NCI and AD cases. P-values were generated by two-way ANOVA with Tukey’s post-hoc test. The interaction between cognitive status and pathology stage was significant: F(3, 136) = 3.68, P = 0.013). c Reduced nuclear REST in AD. The mean nuclear REST level is significantly reduced in AD (n = 63) relative to NCI cases (n = 82). Individual values and the mean ± S.E.M are shown. P < 10−12 by two-tailed unpaired t-test. Source data are provided as a Source Data file.
Fig. 2
Fig. 2. REST induction in AD mice with early pathology.
ac REST induction in neurons that accumulate early tau pathology. a Immunolabeling of REST (green) the marker of early tau pathology, phospho-Ser202 tau (antibody CP13, red) and DNA (DAPI, blue) in the cortex (CTX) and the CA1 region of the hippocampus, shows elevated nuclear REST levels in neurons with accumulation of pSer202 tau in 11-month-old 3xTg mice b, c Quantification of nuclear REST levels in 11-month-old WT (n = 4) and 3xTg (n = 4) cortex (b) and 11-month-old WT (n = 4) and 3xTg (n = 6) hippocampus (c). df Loss of REST in aged 3xTg mice with advanced tau pathology. d Immunolabeling of REST (green), phospho-Ser396 tau, a marker of late, fibrillary, tau pathology (antibody PHF1, red) and DNA (DAPI; blue) in the cortex (CTX) and the CA1 region of the hippocampus, shows decreased nuclear REST levels in PHF1-positive neurons in 22-month-old 3xTg mice. Quantification of nuclear REST levels in the cortex (e) and hippocampus CA1 sector (f) of 22-month-old WT (n = 3) and 3xTg (n = 3) mice. g, h REST induction in J20 mice with early Aβ pathology. g Immunolabeling of REST (green), the neuron marker MAP2 (magenta) and nuclei (DAPI, blue) in the CA1 region of the hippocampus, shows elevated nuclear REST levels in 3-month-old J20 mice. h Quantification of nuclear REST levels in 3-month-old WT (n = 7) and J20 (n = 7) mice. i, j Loss of REST in aged J20 mice with advanced Aβ plaque pathology. i Immunolabeling of REST (green), Aβ (red) and DNA (DAPI, blue) in the CA1 region of the hippocampus, shows decreased nuclear REST levels in 18-month-old J20 mice. j Quantification of nuclear REST levels in 18-month-old WT (n = 6) and J20 (n = 6) mice. b, c, e, f, h, j Individual values (representing the average mean fluorescence intensities/mouse) as well as the mean ± S.E.M are shown. P-values were generated by one-way ANOVA with Tukey’s post-hoc test (b, c, e, f) or two-tailed unpaired t-test (h, j). a.u.-arbitrary units. Scale bars, 25 µm. Source data are provided as a Source Data file.
Fig. 3
Fig. 3. Role of the UPR and Wnt/β-catenin signaling in nuclear REST induction.
a Immunolabeling of UPR activation (marker BiP/GRP78, red), REST (green), β-catenin (magenta) and DNA (DAPI, blue) in 11-month-old 3xTg and WT mice shows coordinate upregulation of BiP, nuclear REST and nuclear β-catenin expression in 3xTg mice. b Correlation between nuclear β-catenin and nuclear REST (left graph), BiP and nuclear REST (middle graph) and BiP and nuclear β-catenin (right graph) levels in the hippocampus CA1 region of 11-month-old 3xTg mice. Shown are the mean fluorescence intensity values for nuclear REST in individual CA1 neurons from n = 3 3xTg mice. a.u.- arbitrary units. The Pearson correlation coefficient (r) and P-value are shown. c Immunolabeling of REST (green) and neuron marker MAP2 (red) in 3xTg primary cortical neurons (PCNs) shows nuclear REST in neurons treated with vehicle and decreased nuclear REST in 3xTg neurons after a 24-h treatment with the Wnt/β-catenin inhibitors Dickkopf 1 (DKK1), XAV939 and ICG001, or the PERK inhibitor GSK2606414. d Quantification of average nuclear REST levels in WT PCNs, as well as 3xTg PCNs treated with vehicle or the individual drugs. The P-values for planned comparisons (using two-tailed unpaired t-test) between each treated group and 3xTg treated with vehicle are shown; for WT vs 3xTg/vehicle, P < 10−4. e Immunolabeling of REST (green) and neuron marker MAP2 (red) in WT primary cortical neurons (PCNs) shows low nuclear REST in WT neurons treated with vehicle or the UPR inducer thapsigargin (TG), mildly increased nuclear REST expression after treatment with the GSK3β inhibitors CHIR99021 (Chiron) and lithium chloride (Li), and strongly increased nuclear REST levels after treatment with a combination of TG and Chiron, or a combination of TG and Li. f Quantification of average nuclear REST levels. P-values for pre-planned comparisons, using two-tailed unpaired t-tests, are indicated. d, f Nuclear REST levels are expressed as mean fluorescence intensity/nucleus (in arbitrary units, a.u.) for n = 5 (all drugs except DKK-1) or n = 3 (f, and DKK-1 in panel e) independent experiments. Individual values and the mean ± S.E.M are shown. Scale bars, 25 µm. Source data are provided as a Source Data file.
Fig. 4
Fig. 4. REST targets key pathogenic pathways in AD.
a Analysis of known (left panels) and de novo motifs (right panels) shows that the REST-RE1 DNA binding motif is highly enriched in the ChIP-seq peaks in both 3xTg and WT mice. b Heat maps showing REST binding to the 507 REST peaks that exhibit significantly higher REST binding in the 3xTg vs. WT cortex. Peak regions are sorted from highest to lowest REST binding levels. c Gene ontology analysis of genes located under the peaks that are predominantly bound in 3xTg mice shows that REST targets genes that regulate cellular metabolism, cell communication, stress responses, and apoptotic cell death. Dashed line: FDR = 0.05. d Examples of REST binding to selected genomic regions in WT (blue: shown is the average of 4 biological replicates) and 3xTg (red: average of 4 biological replicates) mouse cortex resolved by ChIP-seq. The arrows indicate the transcription start sites. The regions within REST ChIP-seq peaks that were amplified by qPCR are indicated in green. e ChIP-qPCR analysis REST binding to peak regions in Cdk5, Gsk3β, and Daxx genes, in 5- and 11-month-old WT and 3xTg cortex. Also shown is binding by a non-specific IgG control antibody, as well as REST binding to control sites located 10 kb downstream from the REST peaks. n = 3 mice/group. Individual values and the mean ± S.E.M are shown. P-values were generated by one-way ANOVA analyses with Šídák’s multiple comparisons test, followed by Bonferroni correction for the simultaneous testing of 6 genomic regions (see Supplementary Data 1 for all Bonferroni-adjusted P-values). Source data are provided as a Source Data file.
Fig. 5
Fig. 5. REST suppresses the tau kinases CDK5 and GSK3β.
a, b Loss of REST in excitatory neurons increases CDK5 expression in cortex and hippocampus. a Immunolabeling for CDK5 (green) and the neuronal marker MAP2 (magenta) in CA1 neurons of the hippocampus in 9-month-old 3xTg and 3xTg;cKO mice. b Quantification of CDK5 immunofluorescence intensity in the hippocampus and cortex of 9-month-old 3xTg (n = 4) and 3xTg;cKO (n = 4) mice. c, d Loss of a single REST allele increases CDK5 expression. c Immunolabeling for CDK5 (green) and MAP2 (magenta) in 29-month-old 3xTg and 3xTg;GT (heterozygous REST null) mice. d Quantification of CDK5 immunofluorescence intensity in 28–29-month-old 3xTg (n = 6) and 3xTg;GT (n = 6) mice. e, f Loss of REST in excitatory neurons increases GSKβ expression in cortex and hippocampus. e Immunolabeling for GSK3β (green) and MAP2 (magenta) in hippocampal CA1 neurons in 9-month-old 3xTg and 3xTg;cKO mice. f Quantification of GSK3β immunofluorescence intensity in 9-month-old 3xTg (n = 4) and 3xTg;cKO (n = 4) mice. g, h Loss of a single REST allele increases GSK3β expression. g Immunolabeling for GSK3β (green) and MAP2 (magenta) in 29-month-old 3xTg and 3xTg;GT (heterozygous REST null) mice. h Quantification of GSK3β immunofluorescence intensity) in 28–29-month-old 3xTg (n = 6) and 3xTg;GT(n = 6) mice. i Western blot analysis of CDK5 and GSK3β levels in the hippocampus of 29-month-old 3xTg and 3xTg;GT mice. j Quantification shows CDK5 and GSK3β levels normalized to actin in 28–29-month-old 3xTg (n = 5) and 3xTg;GT (n = 5) mice. b, d, f, h, j Individual values and the mean ± S.E.M are shown; P-values are derived from two-tailed unpaired t-tests. k, m Immunofluorescence labeling of REST (green) and CDK5 (red, k) or GSK3β (red, m) in a NCI case with early AD pathology shows an inverse relationship between nuclear REST and either CDK5 (k) or GSK3β (m) total cellular levels in neurons of the prefrontal cortex. l, n Correlation between nuclear REST levels and total cellular levels of CDK5 (l) or GSK3β (n) in individual neurons from n = 3 NCI cases with early pathology. Shown are the Pearson r correlation coefficients and the P-values. Scale bars, 25 μm. Source data are provided as a Source Data file.
Fig. 6
Fig. 6. REST suppresses γ-secretase.
a Cultured human SHY-5Y neuroblastoma cells were transduced with recombinant lentiviruses leading to either REST inhibition (short hairpin RNA; sh4) or overexpression (human REST cDNA: hREST), as previously described. Expression of γ-secretase components was assessed by qRT-PCR. b RESTlx/lx MEF cells were transduced with Cre recombinase (generating REST-KO lines 1–3) or a control vector without Cre (lines WT 1–3). The REST floxed (RESTlx) and Cre-recombined REST (RESTrec) alleles were detected by PCR. No RESTlx band was detected in REST-KO cells, suggesting complete Cre-mediated recombination. c qRT-PCR using two sets of primers spanning the transcript shows loss of REST mRNA in REST-KO MEFs. d Immunolabeling with anti-REST antibody (REST14; white) shows loss of REST expression in REST-KO MEFs. Nuclei are labeled with DAPI (blue). Scale bar, 40 μm. e Western blot analysis of γ-secretase components in WT and REST-KO MEFs. The transferrin receptor (TfR) served as loading control. f Quantification of protein levels normalized to TfR shown as percentage expression in REST-KO relative to WT cells (interrupted line: 100%). For PS1, similar results were seen with antibodies against the N-terminus (NTF; antibody 231f) or C-terminus (CTF; antibody EP2000Y). g REST-KO MEFs show elevated γ-secretase enzymatic activity. Solubilized membranes were incubated with Met-C99-FLAG in the presence or absence of a γ-secretase inhibitor (+I), and levels of AICD-FLAG were determined by Western blotting using TfR as a loading control. h Quantification of γ-secretase activity in membrane preparations from WT and REST-KO cells. AICD-FLAG levels were normalized to TfR, and shown as percentage expression in REST-KO relative to WT cells (interrupted line: 100%). Loss of REST in REST-KO MEFs leads to elevated Aβ40 (i) and Aβ42 (j) levels following transfection of hAPPWT or hAPPSwe. Lentiviral transduction of human REST cDNA (hREST) suppresses Aβ production. Individual values and the mean ± S.E.M are shown for n = 6 (a) or n = 3 (c, f, h, i, j) independent experiments. P-values are derived from two-tailed unpaired t-tests (a, c, f, h) or one-way ANOVA with Tukey’s post-hoc test (i, j). Source data are provided as a Source Data file.
Fig. 7
Fig. 7. REST suppresses tau accumulation and Aβ deposition in AD mouse models.
a, b Increased mTau and pTau accumulation in REST-deficient 3xTg mice. a Immunolabeling for conformationally altered tau (antibody MC1, mTau) or pSer202 tau (antibody CP13, right panels, pTau), and DNA (DAPI) in 18-month-old 3xTg and 3xTg;cKO mice with a CA1 neuron-specific REST deletion. b Quantification of mTau-positive and pTau-positive neuron density in the hippocampal CA1 sector of 17–18-month-old 3xTg (n = 15), 3xTg;cHET (n = 8) and 3xTg;cKO (n = 3) mice. Scale bar, 25 μm. c Quantification of pTau-positive neuron density in 17–18-month-old 3xTg (n = 8), 3xTg;cHET (n = 8) and 3xTg;cKO (n = 10) mice generated with a second Cre line that gives rise to conditional forebrain deletion of REST in glutamatergic neurons. d, e REST deletion induces multiple phospho-tau epitopes associated with neurofibrillary pathology. d Western blot analysis of pThr231-tau (antibody AT180) and pSer396-tau (antibody PHF1), as well as total tau (antibody tau-5) and actin, in the hippocampus of 9-month-old 3xTg (n = 5) and 3xTg;cKO (n = 4) mice. e Quantification of pThr231-tau:total tau, pSer396-tau:total tau and total tau:Actin ratios in 9-month-old 3xTg and 3xTg;cKO mice. f, g Increased Aβ plaque deposition in aged REST-deficient J20 mice. f Immunolabeling of Aβ (white) in 14-month-old J20 and J20;cKO hippocampus and cortex. g Quantification of Aβ plaque burden in the hippocampus (left bar graph) and the cortex (right bar graph) in 12−14-month-old J20 (n = 26), J20;cHET (n = 8), and J20;cKO (n = 15) mice. Scale bar, 200 μm. b, c, e, g Individual values as well as the mean ± S.E.M are shown. P-values were generated by one-way ANOVA with Tukey’s post-hoc test (b, c), Kruskal–Wallis one-way ANOVA with Dunn’s post-hoc test (g) or two-tailed unpaired t-test (e). Source data are provided as a Source Data file.
Fig. 8
Fig. 8. Loss of REST accelerates neurodegeneration and cognitive decline in AD mice.
a, b Increased neurodegeneration in REST-deficient 3xTg mice. a TUNEL labeling (green), immunolabeling for p-Ser202 tau (pTau) (antibody CP13, red), and DAPI labeling for DNA identifies TUNEL-positive nuclei in neurons with NFT-like tau pathology in hippocampal CA1 (top 2 panels) and CA3 (lower 2 panels) sectors in 29-month-old 3xTg;GT but not 3xTg mice. b Quantification of TUNEL-positive cells in 27–29-month-old WT (n = 4), GT (n = 3), 3xTg (n = 6) and 3xTg;GT (n = 6) mice. P-values were generated by two-way ANOVA with Tukey’s post-hoc test. Scale bar, 25 μm. c Time course of spatial learning in the Morris water maze for 17–18-month-old mice of the indicated genotypes. d Memory retrieval in the probe trial of the Morris water maze. Shown are the numbers of entries in the target (platform) area and time spent in target (platform) area for 17–18-month-old mice of the indicated genotypes. Two-way ANOVA revealed no significant interaction between REST genotype (+/+, cHET) and AD pathology (WT, 3xTg): F (1, 51) = 2.41, P = 0.12. One-way ANOVA with Tukey’s post-hoc test was then conducted and the P-values are shown. Panels c, d: n = 17 WT, n = 11 REST cHET, n = 16 3xTg, and n = 11 3xTg;cHET mice. e Time course of spatial learning in the Morris water maze for 12–14-month-old mice of the indicated genotypes. REST loss-of-function alleles do not further impair learning in J-20 mice. f Memory retrieval in the probe trial for 12–14-month-old mice of the indicated genotypes. J-20 mice have impaired memory retrieval relative to WT mice by two-tailed Mann–Whitney U test. Two-way ANOVA revealed no significant interaction between REST genotype (+/+, cHET, cKO) and AD pathology (WT, J20): F (2,100) = 0.82, P = 0.44. Kruskal–Wallis one-way ANOVA with Dunn’s post-hoc test was then conducted and the P-values are shown. Panels e, f: n = 17 WT, n = 14 REST cHET, n = 18 REST cKO, n = 31 J20, n = 8 J20;cHET and n = 18 J20;cKO mice. b, d, f Shown are individual values and the mean ± S.E.M. c, e Shown are the mean ± S.E.M, and P-values for planned comparisons by the two-tailed unpaired t-test. Source data are provided as a Source Data file.
Fig. 9
Fig. 9. Human REST overexpression suppresses AD-type pathology in mice.
a, c Immunofluorescent labeling of the early tau pathology marker pSer202-tau (CP13 antibody, red; pTau; a) or misfolded tau (MC1 antibody, red; mTau; c) and DNA (blue) in the hippocampal regions CA1 and CA3 of 3xTg mice that had received an intracranial delivery of AAV9-REST or AAV9-CTRL at the age of 11 months and were sacrificed 10 weeks later. Overexpression of human REST leads to a marked suppression of tau pathology. b, d Quantification of pSer202-tau (pTau; b) or misfolded tau (mTau; d) levels in CA1 and CA3 regions of the hippocampus. n = 5 3xTg/AAV9-CTRL, n = 6 3xTg/AAV9-REST mice. e, f REST overexpression rscues the advanced tau pathology in 3xTg;GT mice. Quantification of pSer202-tau (pTau; e) or misfolded tau (mTau; f) levels in CA1 and CA3 regions of the hippocampus in n = 5 3xTg/AAV9-CTRL, n = 6 3xTg;GT/AAV9-CTRL and n = 6 3xTg;GT/AAV9-REST mice that had received an intracranial delivery of AAV9-REST or AAV9-CTRL at the age of 11 months and were sacrificed 10 weeks later. g qRT-PCR analysis of Cdk5, Gsk3β and Daxx RNA levels in the hippocampus of 3xTg mice that received intracranial injections of AAV9-CTRL (n = 4) and 3xTg;GT mice that received injections of AAV9-CTRL (n = 5) or AAV9-REST (n = 5) at the age of 11 months and were sacrificed 10 weeks after injection. h Immunofluorescent labeling of Aβ (red) and DNA (blue) in the hippocampus of J20 mice that had received an intracranial delivery of AAV9-REST or AAV9-CTRL at the age of 14 months and were sacrificed 10 weeks later. Overexpression of human REST leads to a marked suppression of Aβ pathology. i Quantification of Aβ plaque burden in the hippocampus, n = 8 J20/AAV9-CTRL and n = 5 J20/AAV9-REST mice. The data is shown as percentage change in Aβ plaque burden relative to J20/AAV9-CTRL mice. a, c, e, f Individual values as well as the mean ± S.E.M are shown. P-values for two-tailed unpaired t-tests (b, d, i) or one-way ANOVA with Tukey’s post-hoc tests (e, f, g) are shown. Scale bars, 25 µm. Source data are provided as a Source Data file.

References

    1. James BD, Bennett DA. Causes and patterns of dementia: an update in the era of redefining Alzheimer’s disease. Annu Rev. Public Health. 2019;40:65–84. doi: 10.1146/annurev-publhealth-040218-043758. - DOI - PubMed
    1. Crystal H, et al. Clinico-pathologic studies in dementia: nondemented subjects with pathologically confirmed Alzheimer’s disease. Neurology. 1988;38:1682–1687. doi: 10.1212/WNL.38.11.1682. - DOI - PubMed
    1. Katzman R, et al. Clinical, pathological, and neurochemical changes in dementia: a subgroup with preserved mental status and numerous neocortical plaques. Ann. Neurol. 1988;23:138–144. doi: 10.1002/ana.410230206. - DOI - PubMed
    1. Schneider JA, Aggarwal NT, Barnes L, Boyle P, Bennett DA. The neuropathology of older persons with and without dementia from community versus clinic cohorts. J. Alzheimers Dis. 2009;18:691–701. doi: 10.3233/JAD-2009-1227. - DOI - PMC - PubMed
    1. Bennett DA, et al. Neuropathology of older persons without cognitive impairment from two community-based studies. Neurology. 2006;66:1837–1844. doi: 10.1212/01.wnl.0000219668.47116.e6. - DOI - PubMed

Publication types