. 2023 Nov 2;13(1):18933.
doi: 10.1038/s41598-023-44854-5.

Gut microbiota composition and diversity before, during, and two months after rifamycin-based tuberculosis preventive therapy

Affiliations

Gut microbiota composition and diversity before, during, and two months after rifamycin-based tuberculosis preventive therapy

Marie Nancy Séraphin et al. Sci Rep. .

Abstract

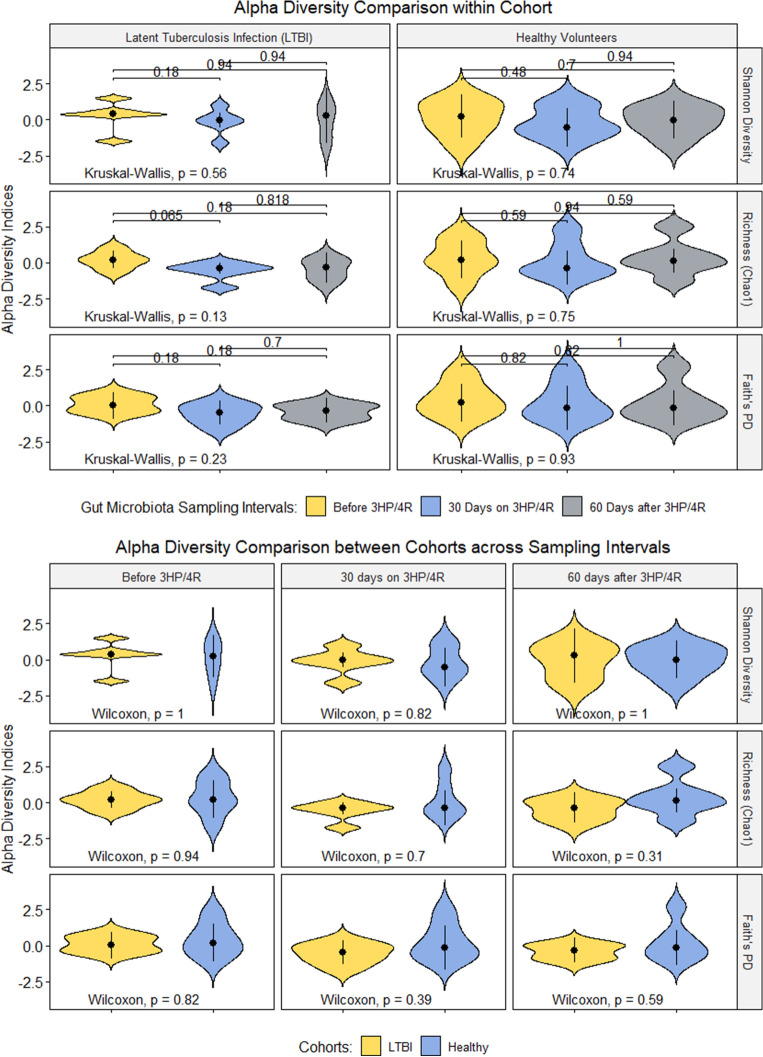
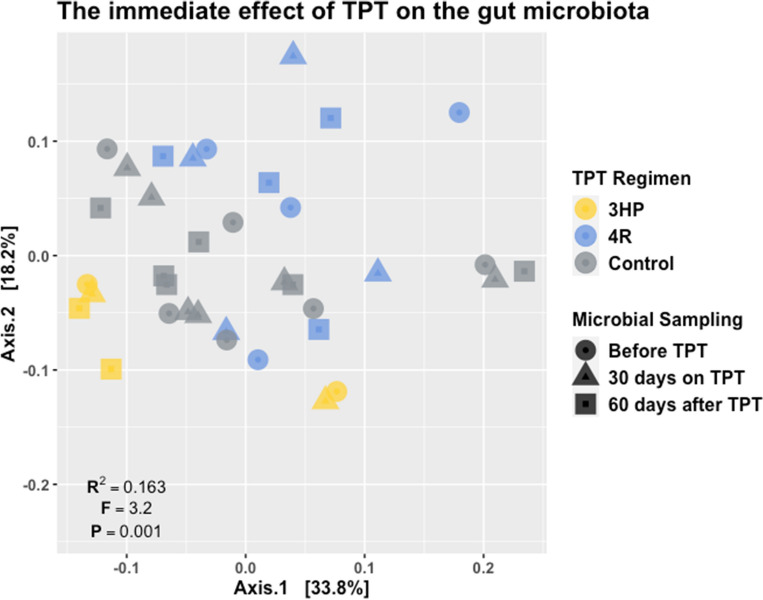
Tuberculosis (TB) preventive therapy (TPT) is an effective strategy to eliminate TB in low-incidence settings. Shorter TPT regimens incorporating the antimicrobial class of rifamycins are designed to improve adherence and completion rates but carry the risk of modifications to the gut microbiota. We enrolled six subjects diagnosed with latent TB infection (LTBI) who accepted to initiate TPT. We also enrolled six healthy volunteers unexposed to the rifamycins. We profiled the gut microbiota using 16S rRNA amplicon sequencing (V1-V2 region) to document the immediate effect of rifamycin-based TPT on the gut microbiota composition and tracked recovery to baseline two months after TPT. Overall, TPT accounted for 17% of the variance in gut microbial community dissimilarity. This rifamycin-based TPT induced dysbiosis was characterized by a depletion of butyrate-producing taxa (Clostridium-XIVa and Roseburia) and expansion of potentially pathogenic taxa within the Firmicutes and Proteobacteria phyla. Recovery of the gut microbial composition was incomplete two months after TPT. Robust clinical studies are necessary to comprehensively catalogue TPT-induced gut microbiota dysbiosis to inform strategies to mitigate potential long-term sequelae of this important TB control intervention.


Conflict of interest statement

The authors declare no competing interests.

Figures

Figure 1
Figure 1
Gut microbiota alpha diversity comparison within (top panel) and between (bottom panel) LTBI and healthy volunteer cohorts using stool samples collected before, during, and two months after tuberculosis preventive therapy (TPT). Healthy volunteers did not receive TPT but collected stool samples in parallel with LTBI subjects on self-administered 4R. Each study participant collected three stool samples during TPT. Here we show the results of analyses conducted on the stool sample collected after 30 days on TPT. Results of analyses comparing alpha diversity across all five stool samples are shown in Supplementary Fig. 2. Our findings suggest a decrease in alpha diversity following rifamycin-based TPT initiation. The results did not vary when samples collected by participants who reported antibiotic and probiotic use during study follow-up were excluded.
Figure 2
Figure 2
Principal coordinates analysis (PCoA) plot of the weighted UniFrac distance matrix calculated from amplicon sequence variants (ASV) randomly resampled to 33,582 sequence reads. For these analyses we focused on the first sample collected 30 days after TPT initiation. Pairwise comparison of the weighted UniFrac distances of the bacterial communities are mapped according to TPT exposure (color) and gut microbiota sampling intervals (shapes). Each point on the ordination represents a sample and points closer to each other suggest more similar bacterial communities while those further apart are more dissimilar. Permutational multivariable analysis of variance (PERMANOVA) results for the influence of rifamycin-based TPT on the gut microbiota community dissimilarity is shown on the plot (R2 = 0.163; P = .001). Overall, TPT regimen accounted for 17.0% of the variance in community dissimilarity. TPT with 3HP explained 10.5% (F = 13.2, p = 0.001) of the variance in community dissimilarity, while 6.5% (F = 8.2, p = 0.001) was explained by 4R.
Figure 3
Figure 3
Magnitude and direction of TPT induced change in relative abundance of taxa aggregated at the phylum level. LTBI participants collected stool samples at home every 30 days, calculated from the date TPT was started. Here we show the change in relative abundance of each phylum compared to the relative abundance of phylum in samples collected before TPT. Healthy volunteers were not exposed to rifamycins but collected stool samples in parallel with LTBI subjects prescribed 4R.

References

    1. Bagcchi S. WHO’s global tuberculosis report 2022. The Lancet Microbe. 2023;4:e20. doi: 10.1016/S2666-5247(22)00359-7. - DOI - PubMed
    1. Behr MA, Edelstein PH, Ramakrishnan L. Revisiting the timetable of tuberculosis. BMJ. 2018;362:k2738. doi: 10.1136/bmj.k2738. - DOI - PMC - PubMed
    1. Cohen A, Mathiasen VD, Schön T, Wejse C. The global prevalence of latent tuberculosis: a systematic review and meta-analysis. Eur. Respir. J. 2019;54:1900655. doi: 10.1183/13993003.00655-2019. - DOI - PubMed
    1. Sloot R, Schim Van der Loeff MF, Kouw PM, Borgdorff MW. Risk of tuberculosis after recent exposure. A 10-year follow-up study of contacts in Amsterdam. Am. J. Respir. Crit. Care Med. 2014;190:1044–1052. doi: 10.1164/rccm.201406-1159OC. - DOI - PubMed
    1. Linas BP, Wong AY, Freedberg KA, Horsburgh CR. Priorities for screening and treatment of latent tuberculosis infection in the United States. Am. J. Respir. Crit. Care Med. 2011;184:590–601. doi: 10.1164/rccm.201101-0181OC. - DOI - PMC - PubMed

Publication types