. 2023 Nov;55(11):1953-1963.
doi: 10.1038/s41588-023-01548-y. Epub 2023 Nov 2.

Single-haplotype comparative genomics provides insights into lineage-specific structural variation during cat evolution

Affiliations

Single-haplotype comparative genomics provides insights into lineage-specific structural variation during cat evolution

Kevin R Bredemeyer et al. Nat Genet. 2023 Nov.

Abstract

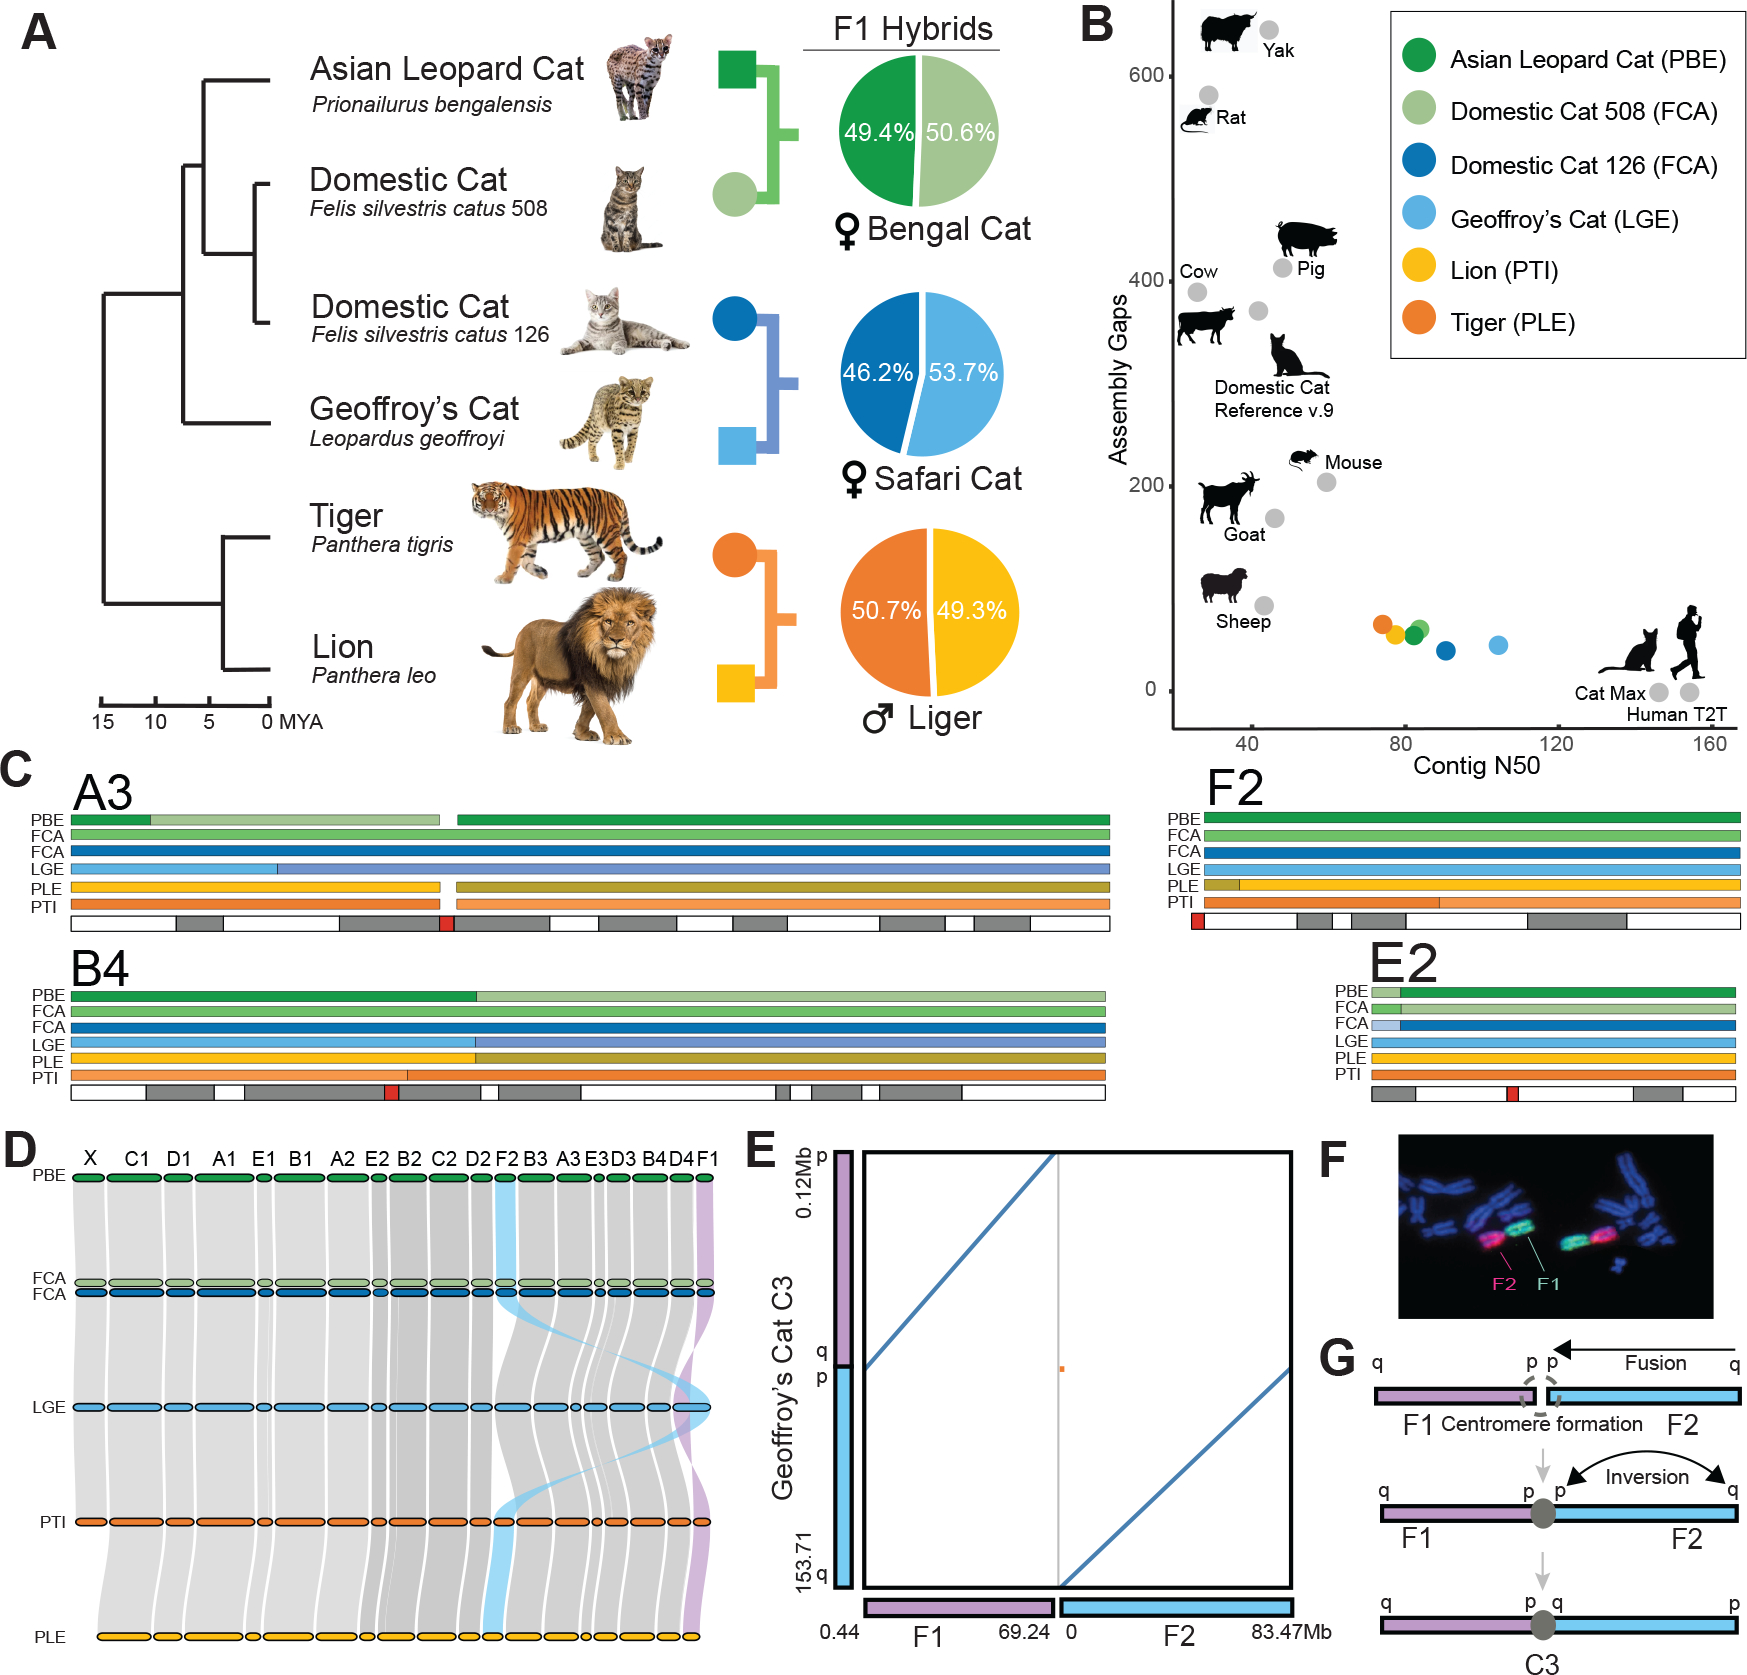
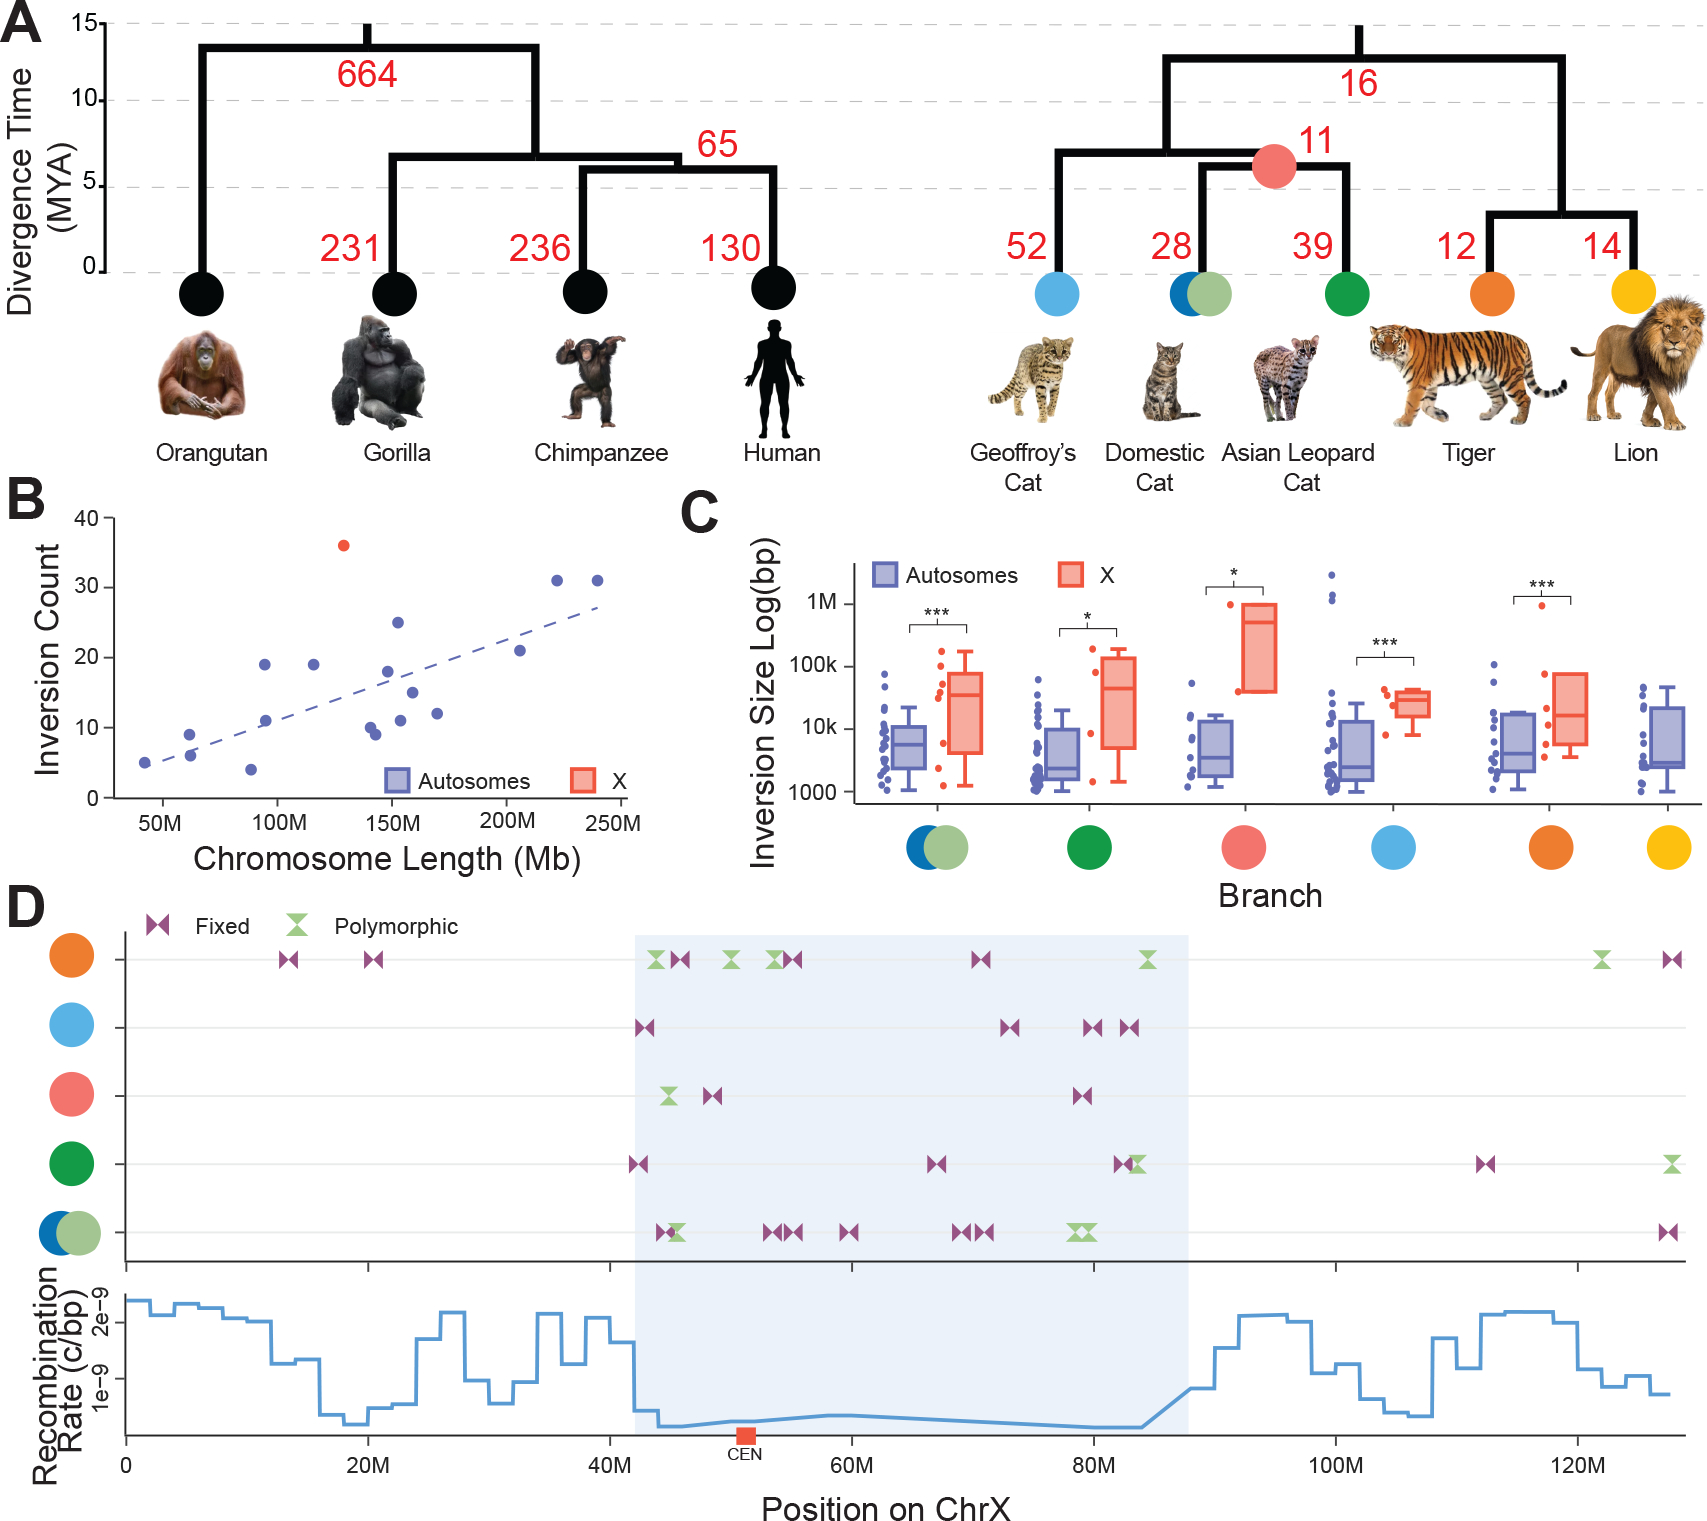
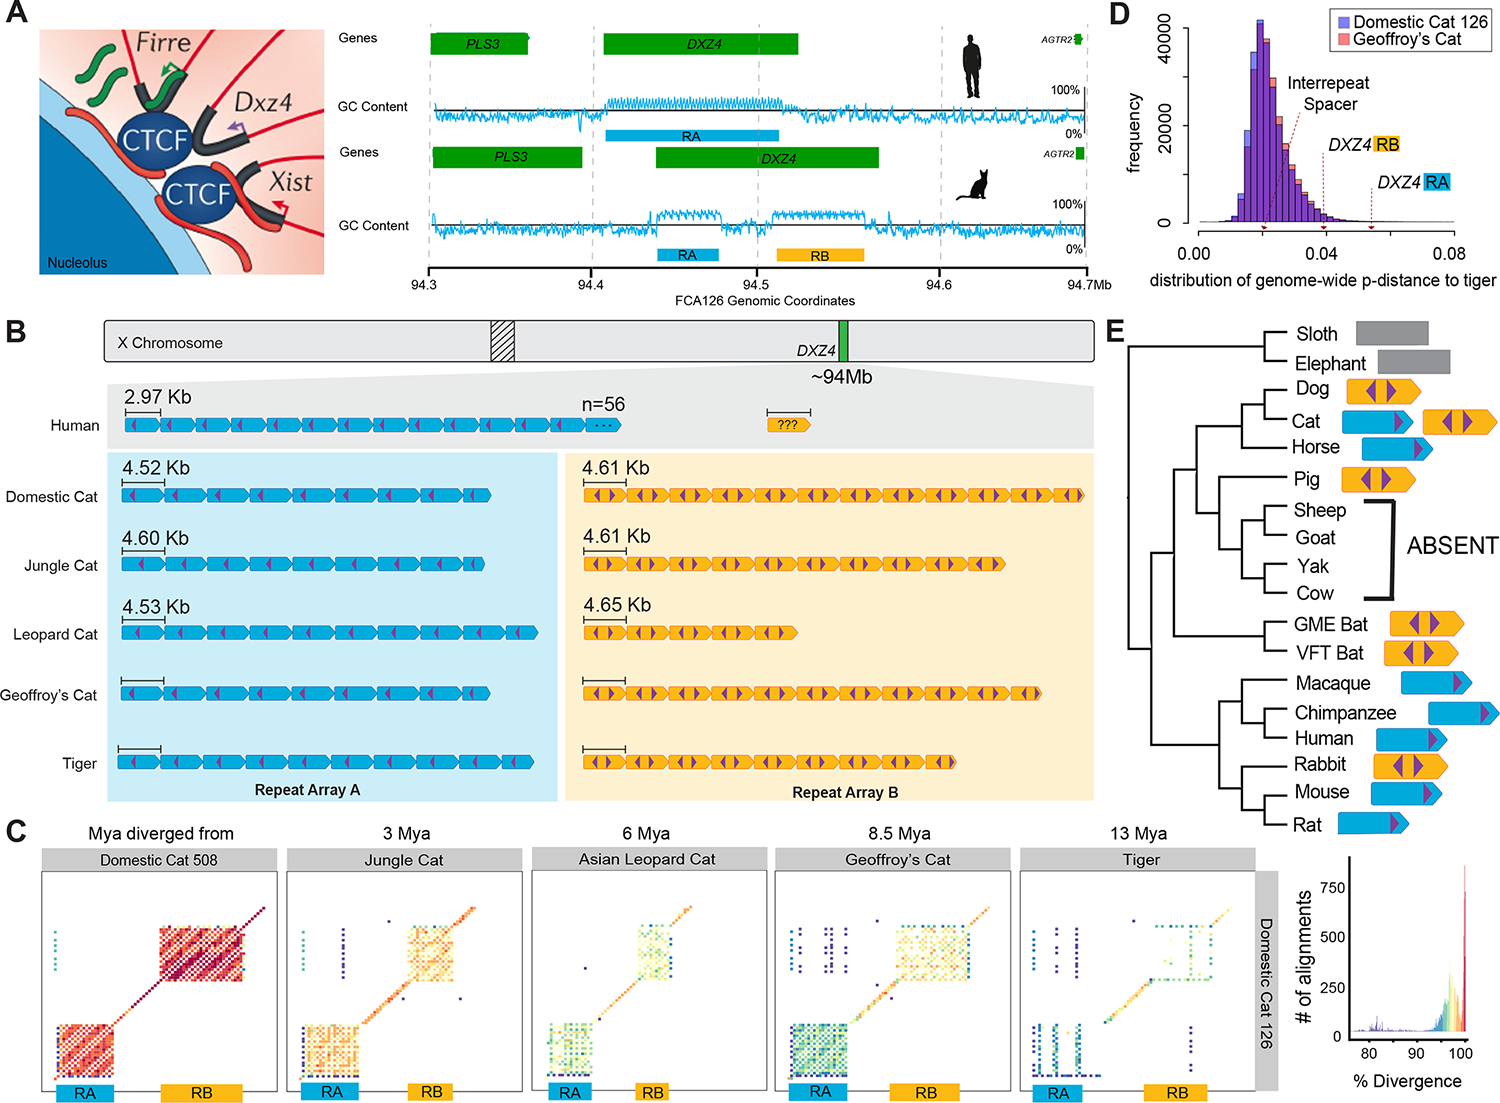
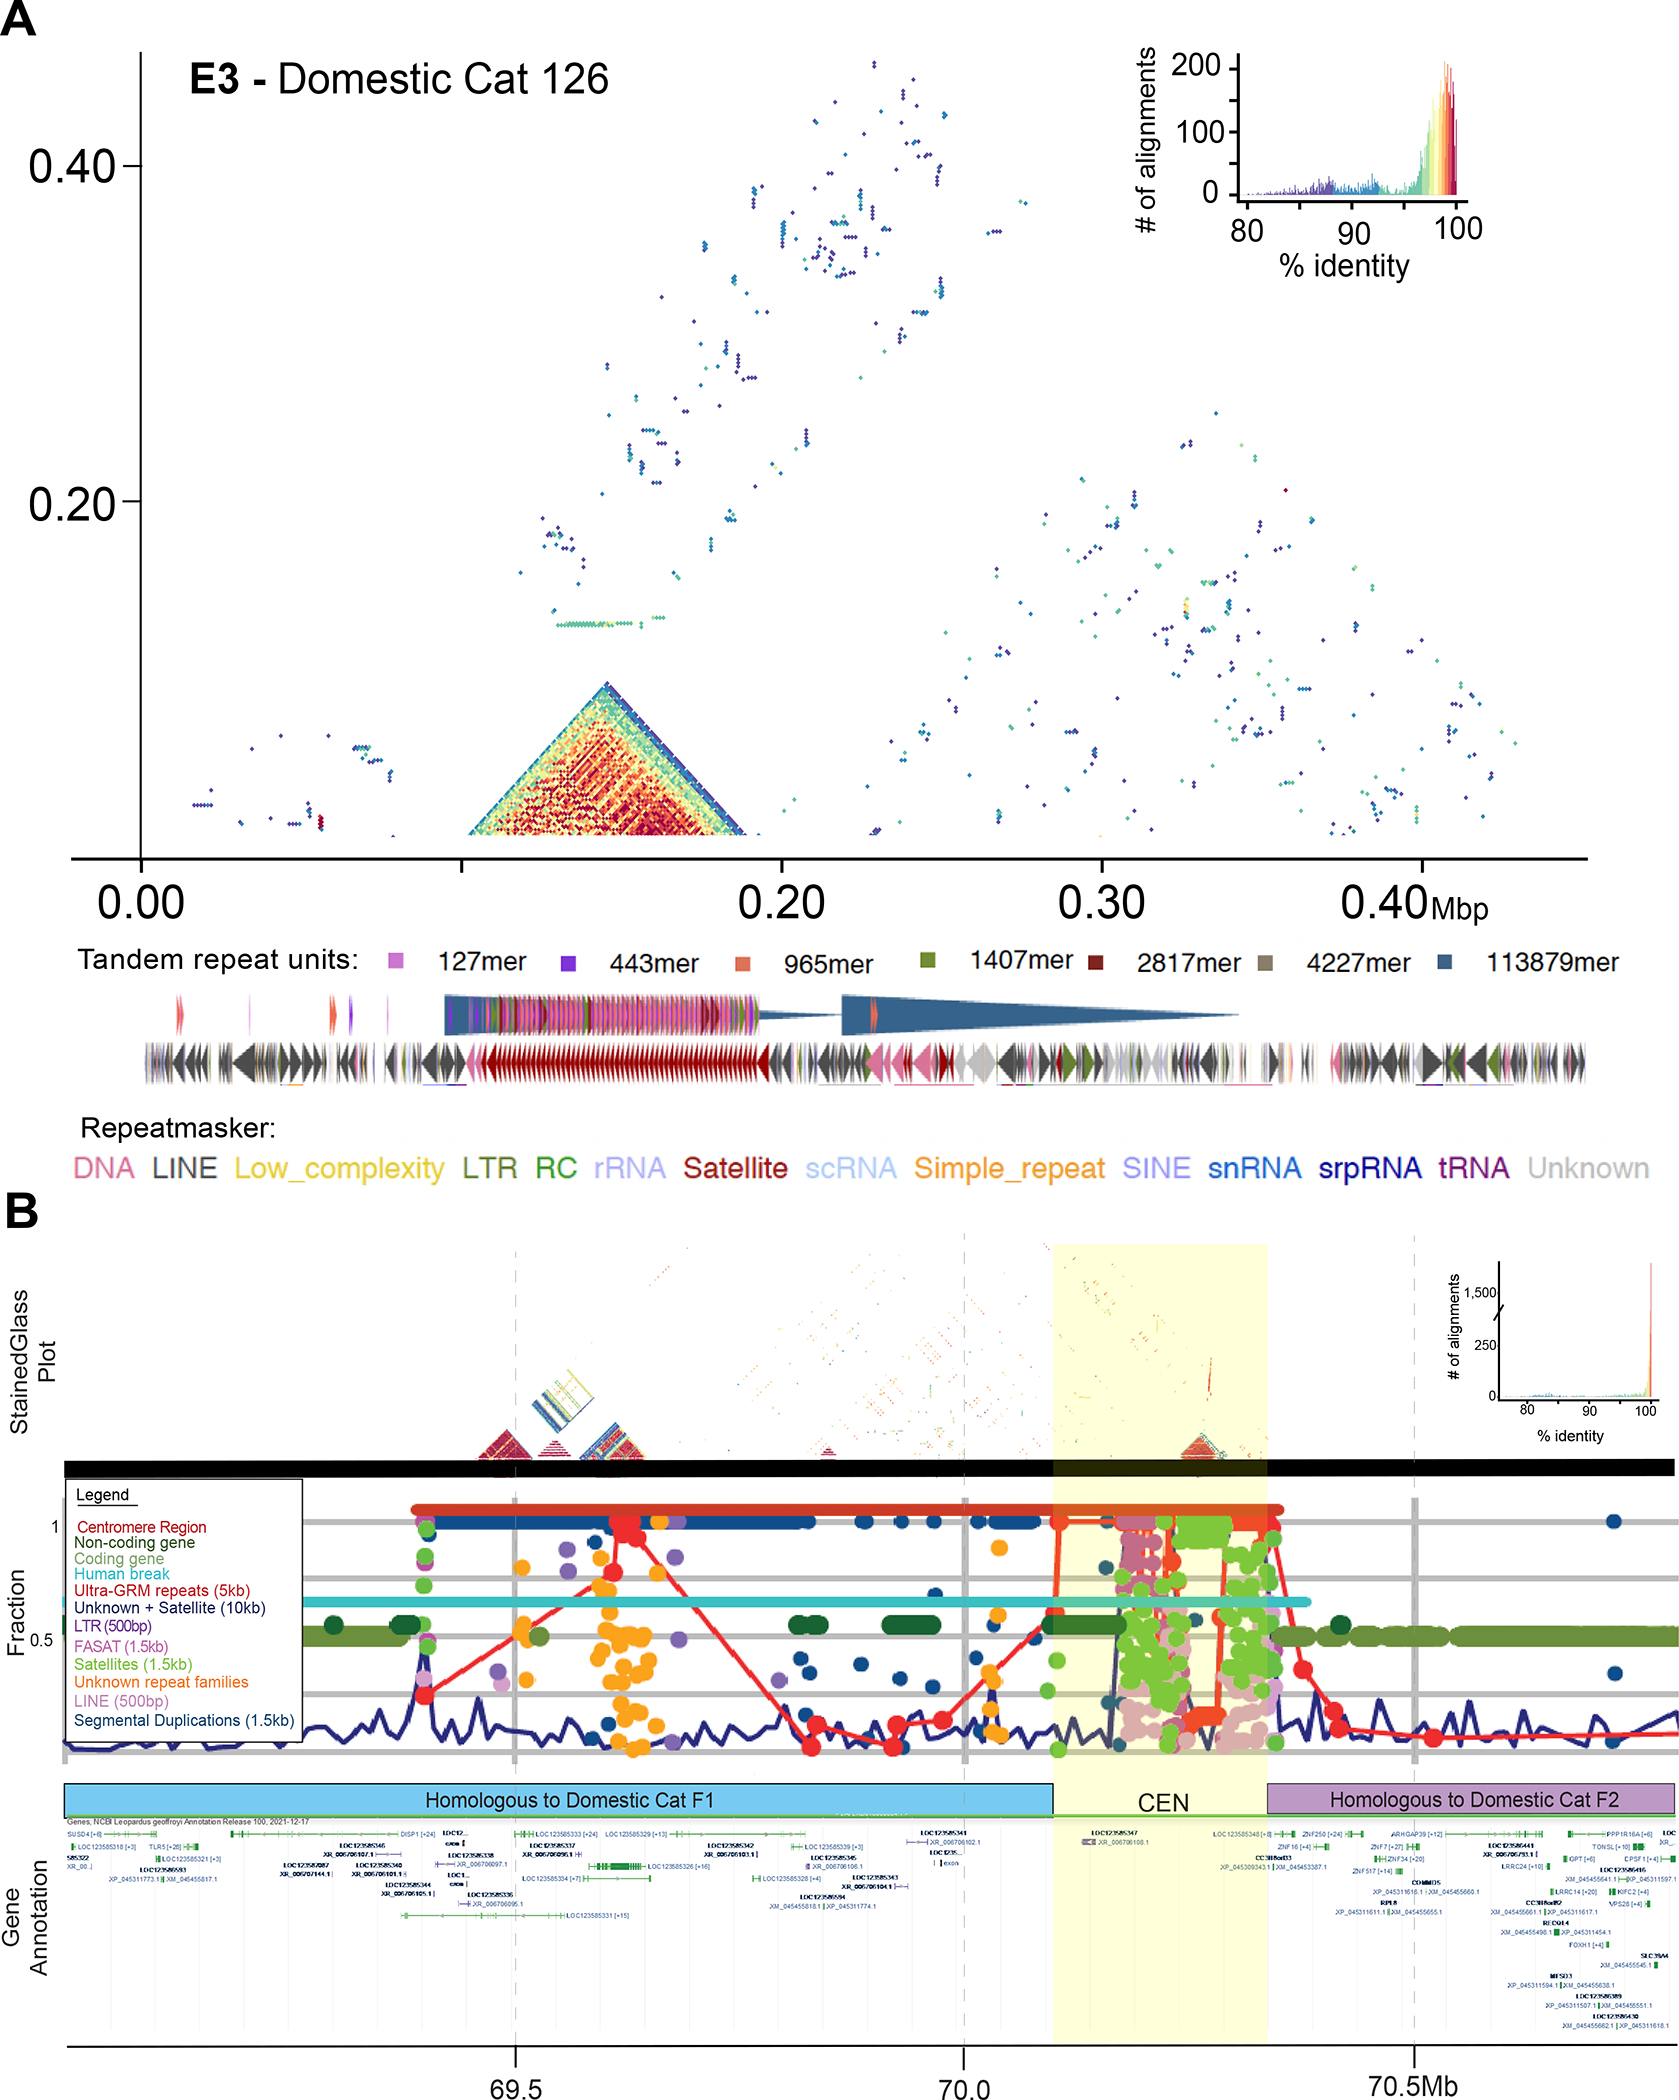
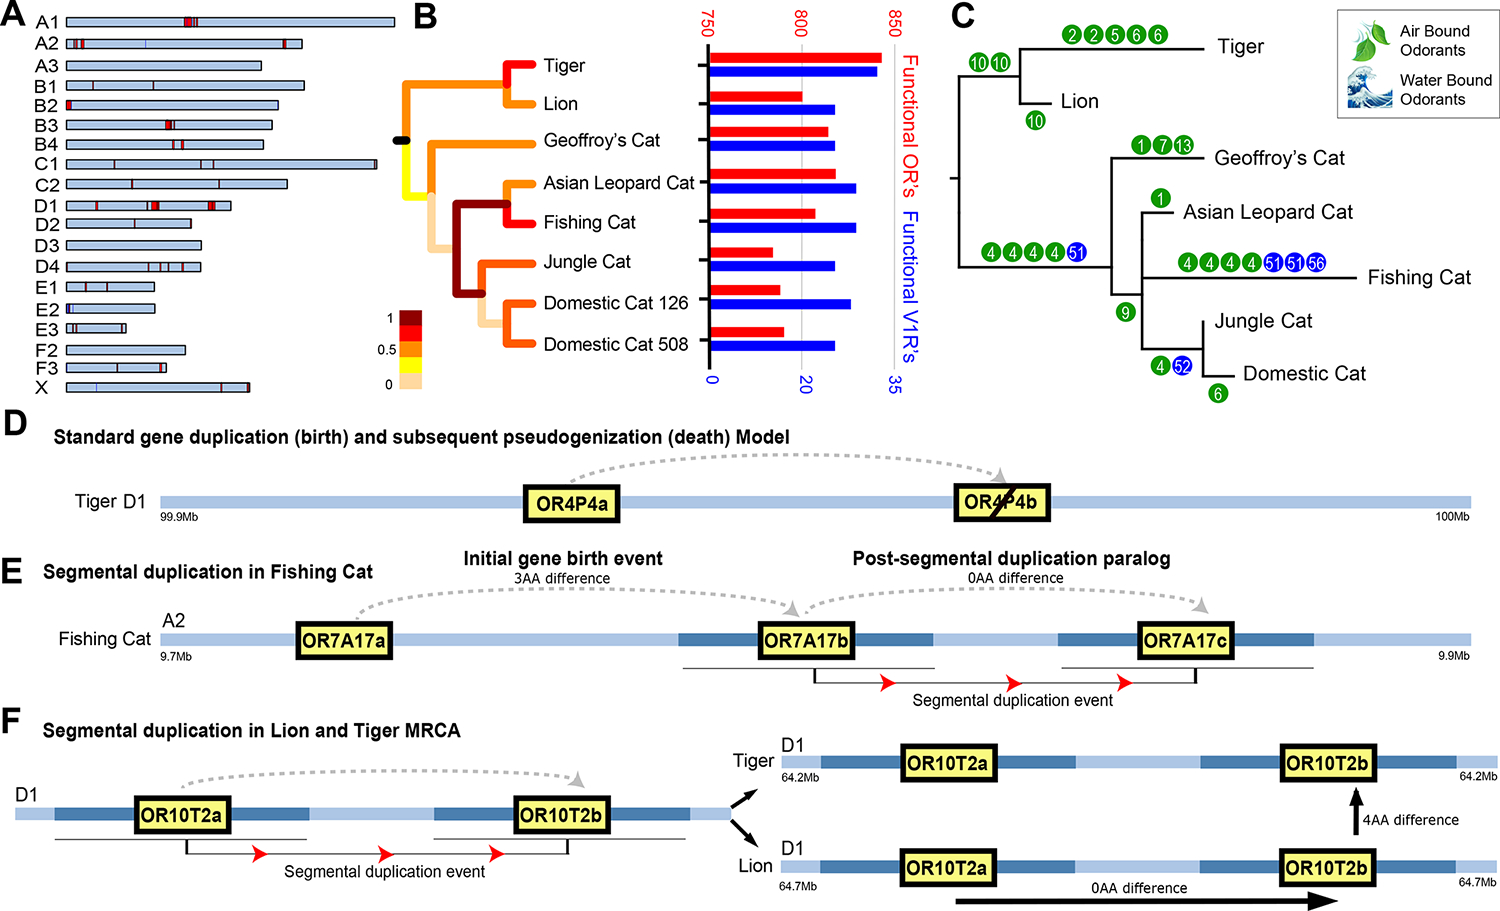
The role of structurally dynamic genomic regions in speciation is poorly understood due to challenges inherent in diploid genome assembly. Here we reconstructed the evolutionary dynamics of structural variation in five cat species by phasing the genomes of three interspecies F1 hybrids to generate near-gapless single-haplotype assemblies. We discerned that cat genomes have a paucity of segmental duplications relative to great apes, explaining their remarkable karyotypic stability. X chromosomes were hotspots of structural variation, including enrichment with inversions in a large recombination desert with characteristics of a supergene. The X-linked macrosatellite DXZ4 evolves more rapidly than 99.5% of the genome clarifying its role in felid hybrid incompatibility. Resolved sensory gene repertoires revealed functional copy number changes associated with ecomorphological adaptations, sociality and domestication. This study highlights the value of gapless genomes to reveal structural mechanisms underpinning karyotypic evolution, reproductive isolation and ecological niche adaptation.


Conflict of interest statement

Ethics declarations

Competing interests: The authors declare no competing interests.

Figures

Fig. 1.
Fig. 1.. Assembly and synteny comparisons among the genomes of five cat species.
(A) Phylogeny and timescale of the parent species of the three hybrid trios used for assembly and comparative analysis. Pie charts illustrate the phasing results (% of total reads) for the F1 PacBio CLR long reads. (B) Comparison of contig N50 statistics and number of assembly gaps against other highly contiguous mammalian reference genomes from domestic species. CatMax refers to the theoretical N50 maximum based on domestic cat chromosome sizes. (C) Contig alignments for the six felid single haplotype assemblies from chrsA3, B4, E2, and F2/C3 to the felCat9 diploid domestic cat long-read genome assembly, depicted on the bottom as a G-banded ideogram. Inferred centromere locations are indicated by red bars. The bars above each ideogram are colored by species and represent assembly contigs > 1 Mb. Breaks between contigs are indicated by a black line and a shift in color contrast. The full set of chromosome alignments is found in fig. S1. (D) Synteny plot illustrating extensive collinearity of the five species assemblies. Blue and purple alignment tracks highlight the only chromosome number change in Felidae, the Robertsonian fusion of chrF1 and chrF2 present in all felid genera, and the derived C3 chromosome observed in Geoffroy’s cat, and all species of the genus Leopardus. (E) Dot-plot alignment (left) of Geoffroy’s cat chrC3 and domestic cat chrF1 and chrF2 (illustrated with multicolor FISH in F). Note the orange alignment fragment indicating a small centromeric fragment of chrF2 that defines the (G) inversion breakpoint on the ancestral chrF2.
Fig. 2.
Fig. 2.. Felid structural variation.
(A) Comparison of fixed inversions (red numbers) plotted on branches of the phylogeny of felids (right) and great apes (left)(5). Note the similar divergence times between ape and felid species sampled. (B) Per chromosome inversion counts plotted against chromosome length. Autosomes are indicated with blue dots and chrX in red. (C) Comparison of inversion size between the autosomes and chrX for each branch of the phylogeny (colored dots) shown in (A) (except for the lion genome which is derived from the paternal haplotype of the male F1 Liger)(Supplementary Table 3). A one-sided Wilcoxon rank sum test determined significance. Domestic cat (n=40 autosomal inversions, n=11 X inversions, U=2.52, p=5.9e-03), Geoffroy’s cat (n=33 autosomal inversions, n=4 X inversions, U=2.15, p=1.6e-02), Asian leopard cat (n=40 autosomal inversions, n=6 X inversions, U=1.92, p=2.7e-02), domestic cat + Asian leopard cat (n= 17 autosomal inversions, n= 3 X inversions, U=2.59, p=4.8e-03), tiger (n=34 autosomal inversions, n=11 X inversions, U=2.54, p=5.6e-03), lion (n=34 autosomal inversions). Box plots show the interquartile range with the center line representing the median. Whiskers indicate the highest and lowest value within the upper and lower fences (upper fence = 75% quantile + 1.5*interquartile range, lower fence = 50% quantile − 1.5*interquartile range). (D) The physical distribution of fixed and polymorphic inversions (Supplementary Table 4) on chrX for each branch of the phylogeny relative to the tiger genome. The X chromosome genome sequences are otherwise collinear across species. A tiger recombination map estimated from population genomic data (Supplementary Fig. 30) is depicted at the bottom (see Methods) and is highly conserved with the recombination rate profile of the domestic cat X chromosome,. The shaded area refers to a large recombination cold spot shared with domestic cat, human, and pig,. CEN=centromere.
Fig. 3.
Fig. 3.. DXZ4 evolution in placental mammals.
(A) (left) X-linked lncRNAs from Dxz4, Xist, and Firre cooperatively interact in 3D space to anchor the inactive X chromosome to the nucleolus (figure modified from.) (right) Comparison of the human and domestic cat DXZ4 repeat structure and GC content shown in genomic context to flanking genes PLS3 and AGTR2. Felids possess two distinct repeat arrays, RA (blue) and RB (yellow), while human only possesses the RA type. (B) DXZ4 repeat unit size, CTCF binding site composition (purple arrows), and copy number in human (top) and sequenced cat species. The Jungle cat data is from a single haplotype chrX assembly (27). (C) StainedGlass (59) dot-plots showing DXZ4 repeat array divergence between the domestic cat (FCA-126) and other cat species (% identity of between species alignments is shown to the right), in increasing order of evolutionary divergence. Note higher conservation across the central and flanking regions adjacent to the RA and RB arrays. (D) Distribution of genomic divergence rates between tiger-Geoffroy’s cat and tiger-domestic cat across 28,312 5-kb alignment windows. Pairwise divergence values for DXZ4 RA and RB, and the internal spacer region are shown for comparison (E) Phylogeny of placental mammals with DXZ4 repeat array presence (blue=RA type, yellow=RB type, gray=ambiguous) inferred from each genome assembly.
Fig. 4.
Fig. 4.. Centromere annotation and evolution.
(A) StainedGlass dot-plot of domestic cat 126 chrE3 centromere region showing percent identity of self-alignments within the satellite repeat array (colored triangle, with % identity scale and distribution shown in the upper right). Below the chromosome are tracks for tandem repeat annotations (colors indicate different GRM-defined repeat units) and RepeatMasker annotations (key at bottom). (B) Geoffroy’s cat chrC3 centromere region. The bottom two panels display NCBI CpG and gene annotations and inferred homology to the domestic cat F1 and F2 centromeric regions. The top tracks show StainedGlass plots and repeat annotations (and fractions observed on y axis). The most probable centromeric repeat array is highlighted in yellow and supported by alignments in Supplementary Figure 21.
Fig. 5.
Fig. 5.. Olfactory (ORG) and Vomeronasal (V1R) receptor gene evolution in cats.
(A) Chromosomal distribution of ORG (red) and V1R (blue) genes within the domestic cat genome. (B) Phylogeny and rate of ORG family duplications (scale to lower left). Barplots to the right illustrate per/species ORG (navy blue) and V1R (purple) functional gene copy number. (C) Number of per-branch unique ORG retention, classified into class I (blue=“water-borne”) and class II (green=“airborne”) receptor types. Each circle represents a uniquely retained gene, with its subfamily classification depicted by the number. (D-E) Models of ORG birth and death with specific examples. (D) shows the standard birth and death (pseudogenization) model, illustrated by tiger chrD1 (OR4P4a and OR4P4b). (E) illustrates a gene birth followed by paralog birth via segmental duplication in the fishing cat. (F) illustrates a gene birth via segmental duplication in the Panthera ancestor preceding speciation of the lion and tiger lineages.

References

    1. Kronenberg ZN et al. High-resolution comparative analysis of great ape genomes. Science 360, (2018). - PMC - PubMed
    1. Rhie A et al. Towards complete and error-free genome assemblies of all vertebrate species. Nature 592, 737–746 (2021). - PMC - PubMed
    1. Nurk S et al. The complete sequence of a human genome. Science 376, 44–53 (2022). - PMC - PubMed
    1. Miga KH, et al. Telomere-to-telomere assembly of a complete human X chromosome. Nature 585, 79–84 (2020). - PMC - PubMed
    1. Logsdon GA et al. The structure, function and evolution of a complete human chromosome 8. Nature 593, 101–107 (2021). - PMC - PubMed

Publication types