. 2023 Dec;24(12):2068-2079.
doi: 10.1038/s41590-023-01661-4. Epub 2023 Nov 2.

SARS-CoV-2 viral persistence in lung alveolar macrophages is controlled by IFN-γ and NK cells

Affiliations

SARS-CoV-2 viral persistence in lung alveolar macrophages is controlled by IFN-γ and NK cells

Nicolas Huot et al. Nat Immunol. 2023 Dec.

Abstract

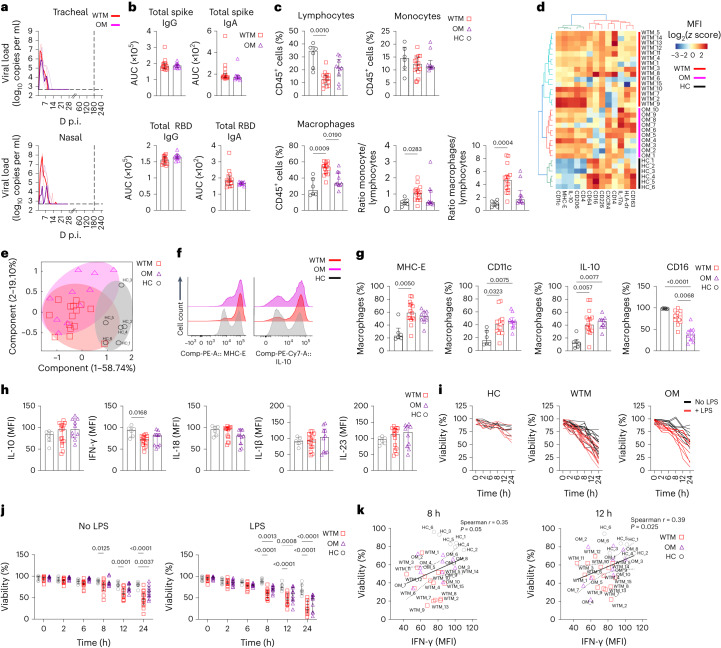
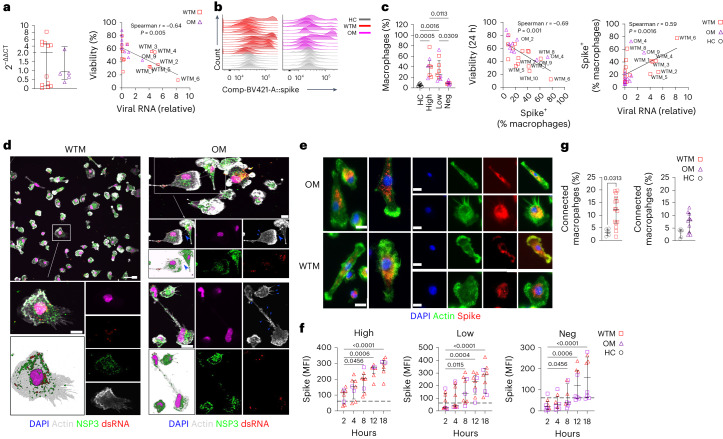
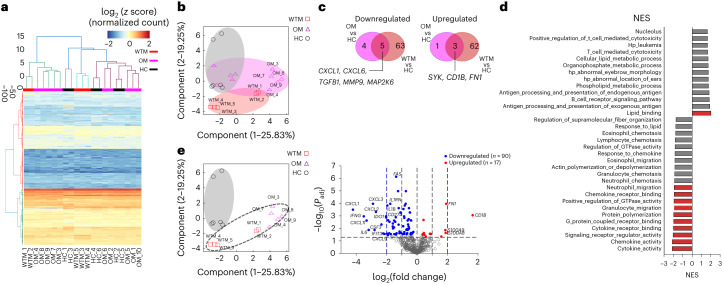
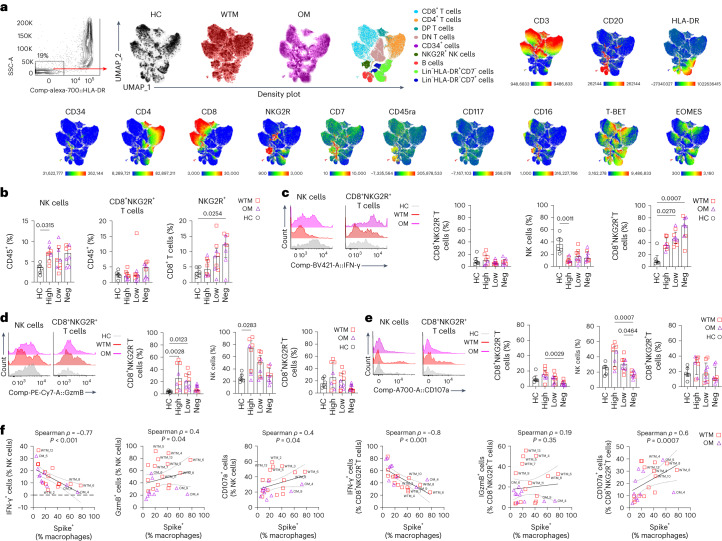
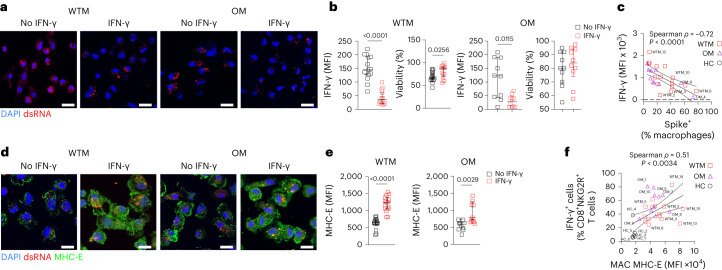
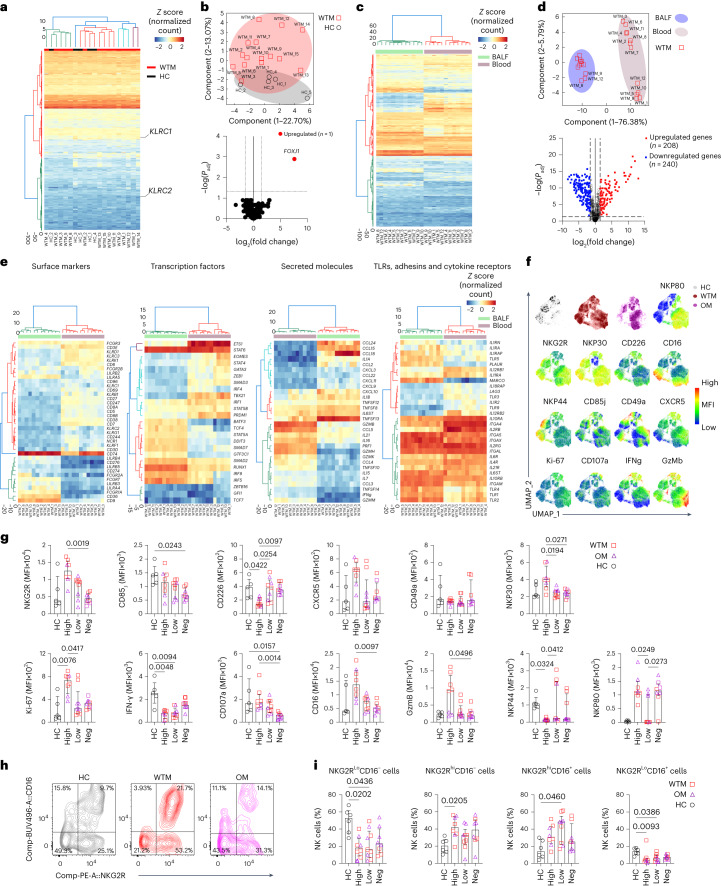
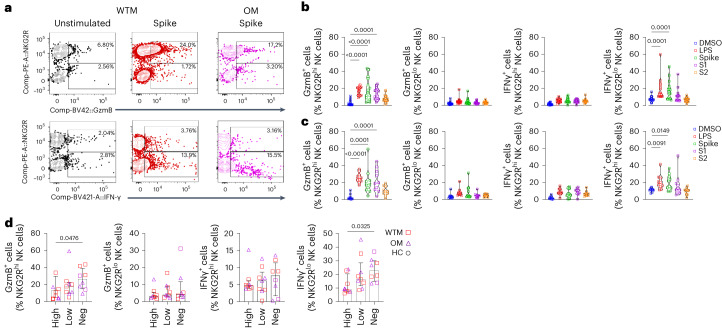
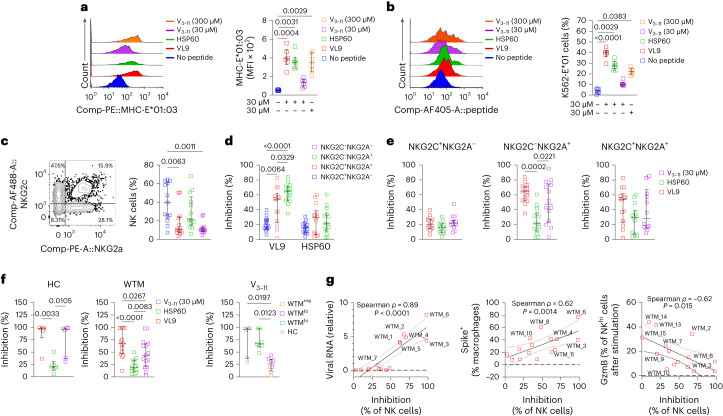
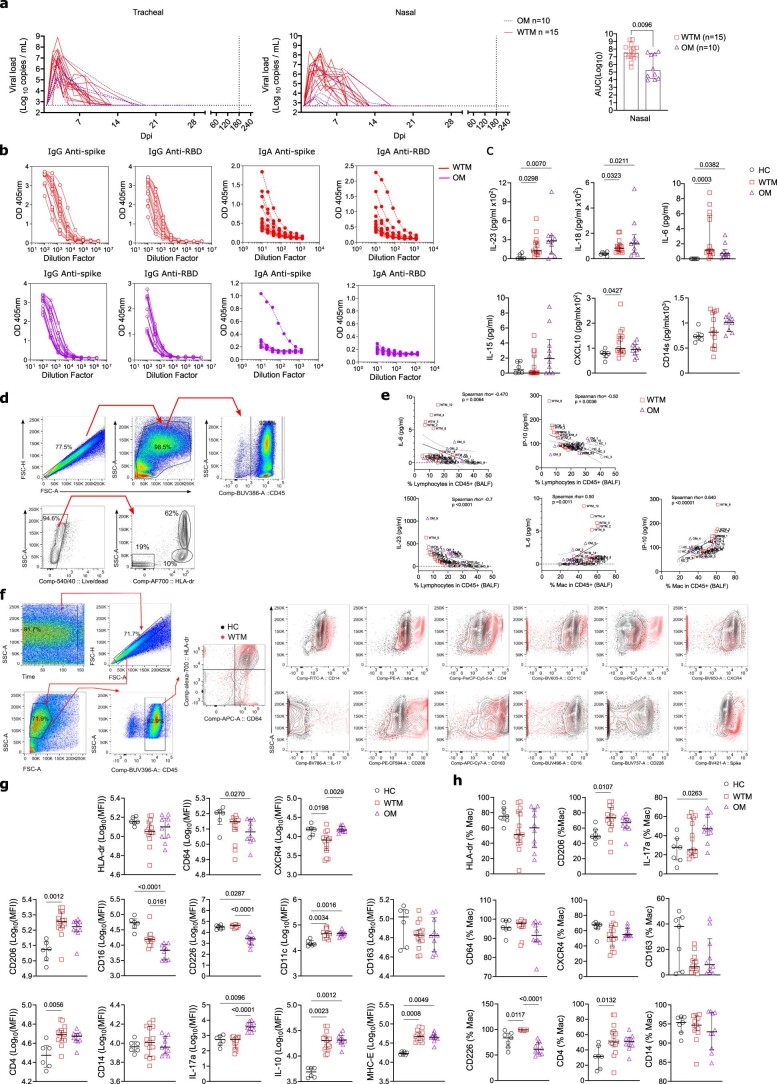
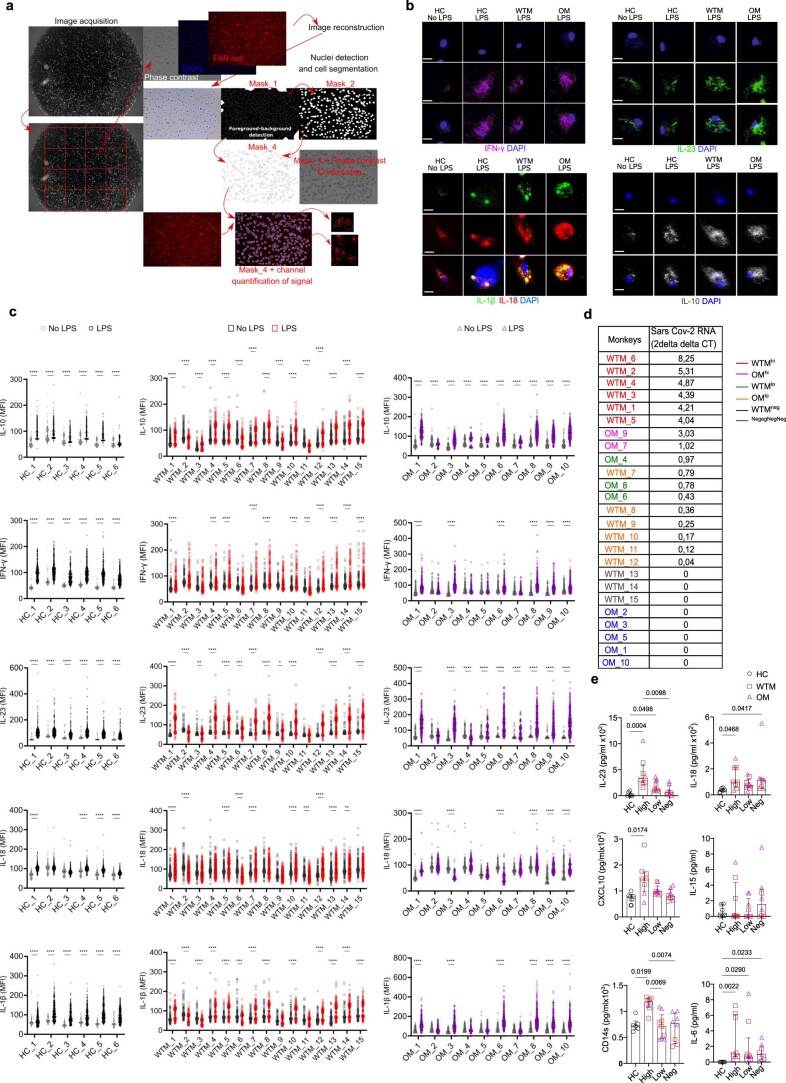
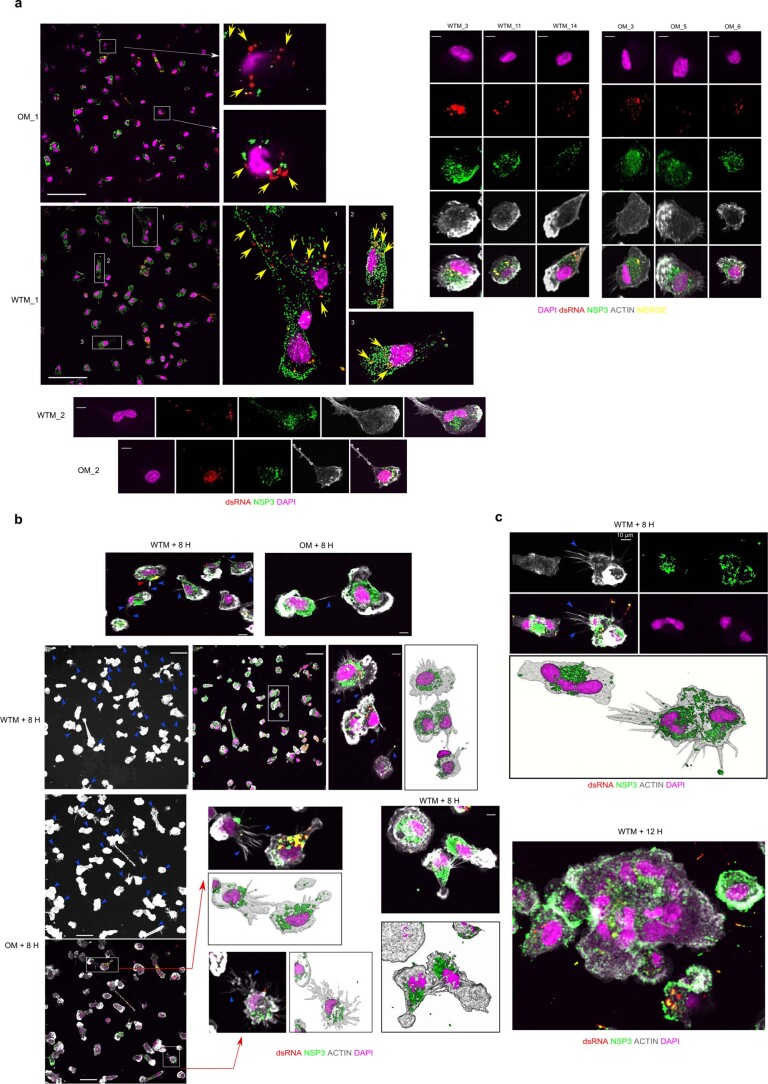
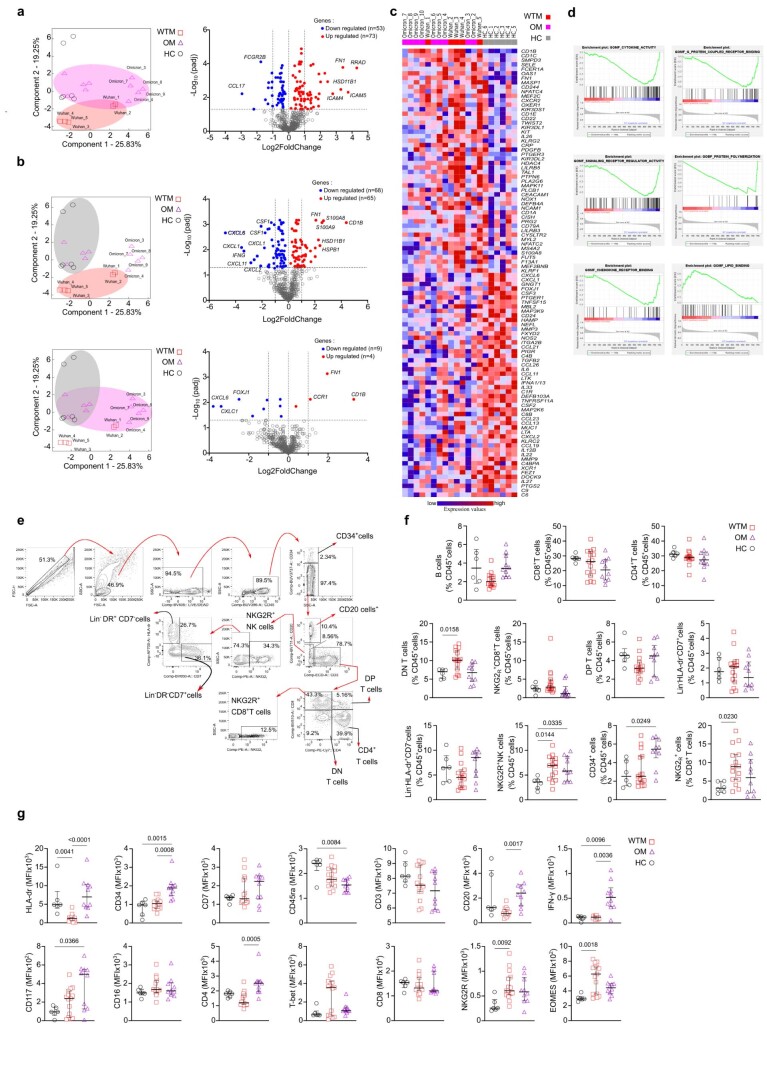
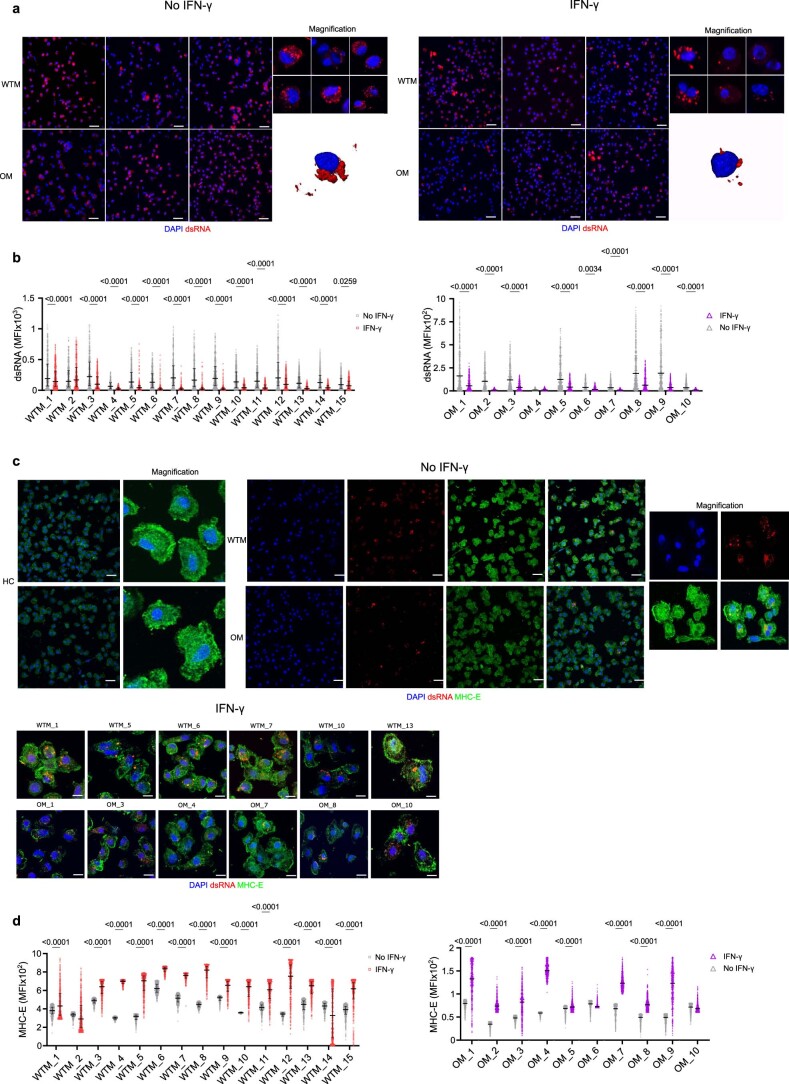
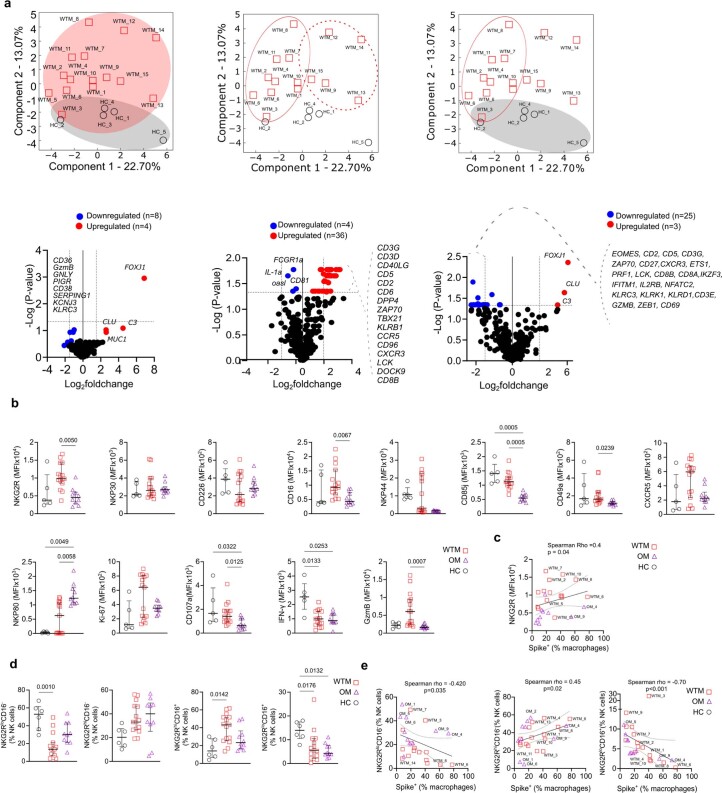
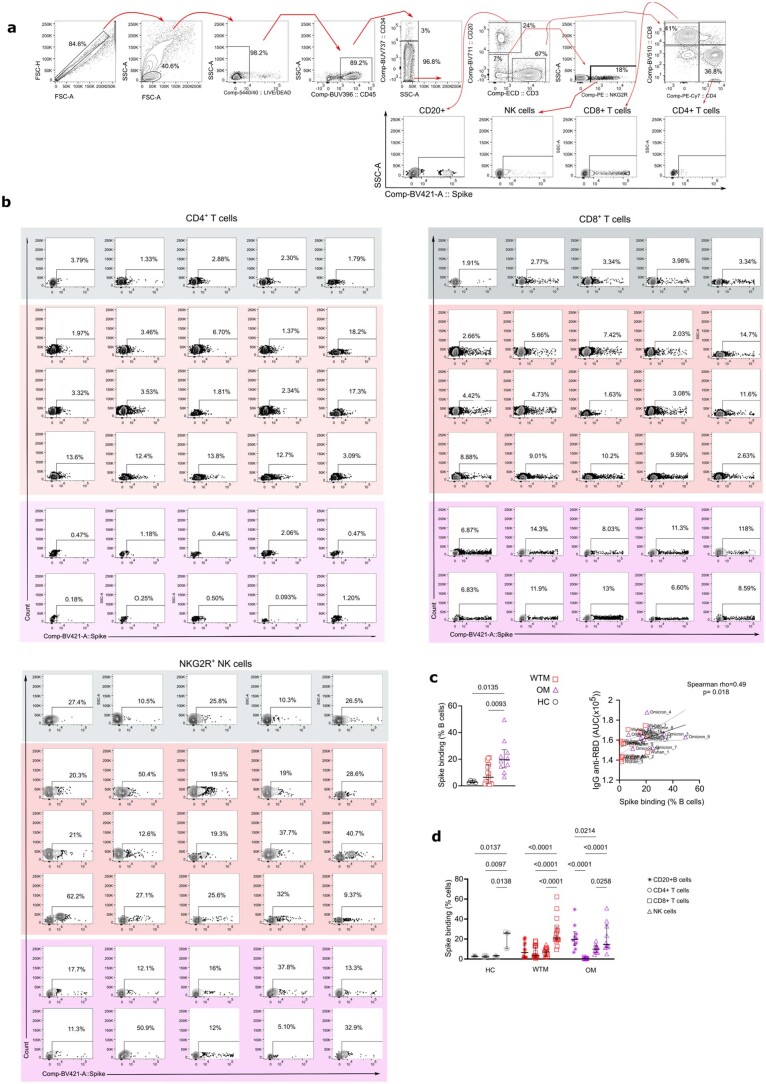
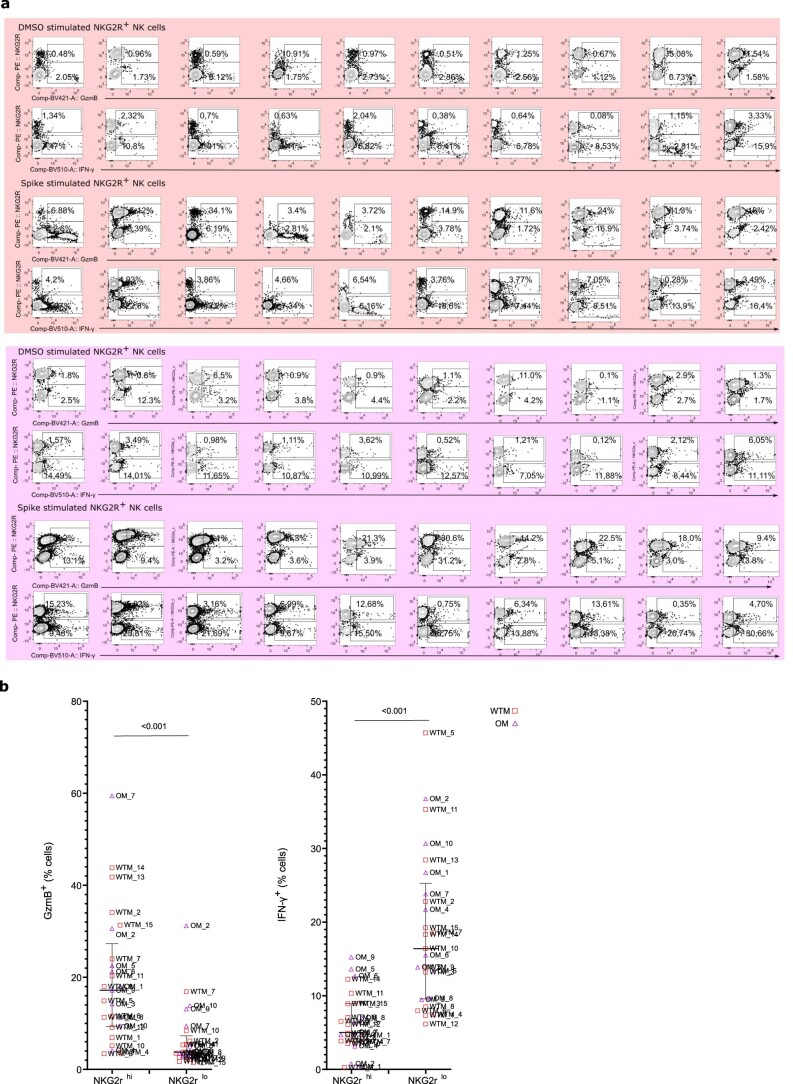
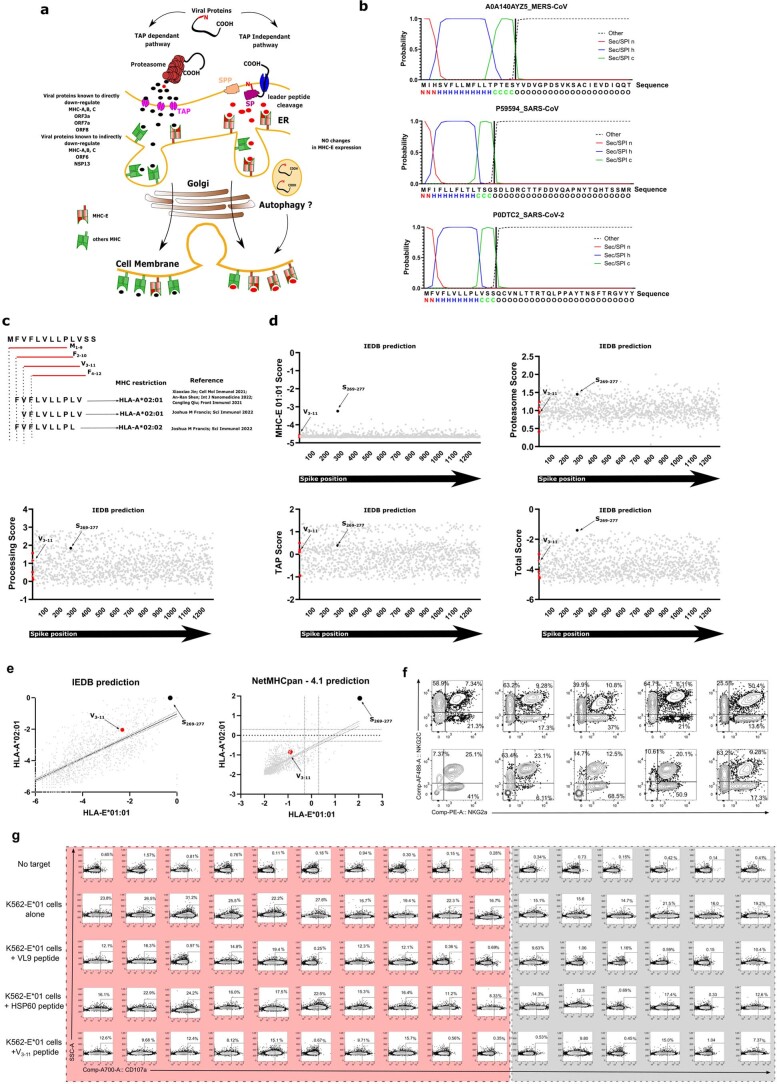
Severe acute respiratory syndrome coronavirus 2 (SARS-CoV-2) RNA generally becomes undetectable in upper airways after a few days or weeks postinfection. Here we used a model of viral infection in macaques to address whether SARS-CoV-2 persists in the body and which mechanisms regulate its persistence. Replication-competent virus was detected in bronchioalveolar lavage (BAL) macrophages beyond 6 months postinfection. Viral propagation in BAL macrophages occurred from cell to cell and was inhibited by interferon-γ (IFN-γ). IFN-γ production was strongest in BAL NKG2r+CD8+ T cells and NKG2Alo natural killer (NK) cells and was further increased in NKG2Alo NK cells after spike protein stimulation. However, IFN-γ production was impaired in NK cells from macaques with persisting virus. Moreover, IFN-γ also enhanced the expression of major histocompatibility complex (MHC)-E on BAL macrophages, possibly inhibiting NK cell-mediated killing. Macaques with less persisting virus mounted adaptive NK cells that escaped the MHC-E-dependent inhibition. Our findings reveal an interplay between NK cells and macrophages that regulated SARS-CoV-2 persistence in macrophages and was mediated by IFN-γ.


Conflict of interest statement

The authors declare no competing interests.

Figures

Fig. 1
Fig. 1. Increased expression of MHC-E and IL-10 in BALF Mac from SARS-CoV-2-infected macaques.
a, PCR quantification of tracheal and nasal swab viral loads in 25 cynomolgus macaques infected with wild-type SARS-CoV-2 (WTM, n = 15) or Omicron variants (OM, n = 10) at a median of 221 d p.i. b, Plasma titers of spike and RBD IgG and IgA in WTM and OM at 221 d p.i. (median). c, Percentage and ratio of lymphocytes, monocytes and macrophages in BALF from HC, WTM and OM at a median of 221 d p.i. d, Hierarchical clustering heatmaps displaying log2 z score expression of proteins in BALF Mac from HC, WTM and OM at a median at a median of 221 d p.i. e, PCA of protein expression in BALF Mac as in c depicting clustering patterns among macaques. f, Expression of MHC-E (top) and IL-10 (bottom) in BALF Mac as in c. g, Frequency of MHC-E, CD11c, IL-10 and CD16 in BALF Mac as in c. h, Median expression per cell of cytokines in BALF Mac after 8-h LPS stimulation isolated from infected macaques as in c. i,j, Viability of BALF Mac isolated as in c, and cultured with and without LPS stimulation. k, Spearman correlation analysis between intracellular IFN-γ expression and viability at 8 and 12 h post-LPS exposure in BALF Macs as in c. Each symbol represents an individual macaque. In all graphs, bars indicate medians and interquartile ranges are displayed. Statistical tests: Mann–Whitney (b), Kruskal–Wallis with Dunn’s post hoc test (c, g and h) and nonparametric Wilcoxon signed-rank test (k). Linear regression lines and confidence intervals are shown in correlation analyses. Source data
Fig. 2
Fig. 2. SARS-CoV-2 is expressed in BALF Mac from WTM and OM at more than 221 d p.i.
a, PCR analysis of SARS-CoV-2 RNA in total BALF cells from WTM (n = 15) and OM (n = 10) at a median of 221 d p.i. (left) and correlation between 24-h macrophage viability (as in Fig. 1i) and viral RNA expression (right). b, Intracellular spike SARS-CoV-2 expression in BALF Mac from WTM and OM as in a, assessed by flow cytometry. c, Frequency of Spike+ BALF Mac from WTM and OM as in a (left) and correlation between Spike+ Mac frequency and viability at 24 h (right). Background for spike staining set at 5.28% based on HC. d, Confocal microscopy images of BALF Mac isolated from WTM (n = 15) and OM (n = 10) ≥ 221 d p.i., cultured for 8 h, and stained with DAPI, actin-phalloidin, dsRNA and NSP3 Abs. Blue arrowheads indicate supposed tunneling nanotubes (TNT). Scale bars, 10 µm. e, Epifluorescence images of BALF Mac isolated from WTM (n = 15) and OM (n = 10) ≥ 221 d p.i., cultured for 12 h, and stained with DAPI, phalloidin, spike and NSP3 Abs. Scale bars, 10 µm. f, Spike protein MFI in BALF Mac isolated from HC (n = 6), WTM (n = 15) and OM (n = 10) ≥ 221 d p.i., measured at 2, 4, 8, 12 and 18 h of culture, with HC reference. g, Percentage of connected BALF Mac as in f measured 12 h postculture initiation. In all graphs, median and interquartile range are shown. Statistical analyses: Mann–Whitney test (a and g) and Kruskal–Wallis test with Dunn’s post hoc test (c and f). Linear regression is represented in Spearman correlation analyses. Symbols represent individual macaques. Source data
Fig. 3
Fig. 3. SARS-CoV-2 replication in Mac in vitro alters Mac transcriptomic profile.
a, Heatmap for mRNA expression in BALF CD64+ Mac isolated from 5 HC, 5 randomly chosen WTM and 10 OM > 221 d p.i., cultured for 8 h and profiled with the nanoString nCounter System. Cluster distance values were determined with the Euclidean method. b, PCA of gene expression in BALF macrophages as in a. c, Venn diagram showing the genes commonly downregulated and upregulated in BALF MAC (as in Fig. 2a) of WTM and OM compared to HC counterpart. d, GSEA hallmark analysis showing enriched gene sets based on the differentially regulated genes from Fig. 2a. Red bars indicate significant enrichment at FDR < 25%, gray bars represent gene sets with FDR > 25% and a nominal P value < 5%. A positive NES value indicates enrichment in WTM and OM, and a negative NES indicates enrichment in HC. e, PCA and volcano plots showing upregulated and downregulated genes for the indicated comparison. In each volcano plot, the horizontal dotted line represents a Padj = 0.05 and the vertical dotted line represents a log(fold change) >2 or <−2. NES, normalized enrichment score. Source data
Fig. 4
Fig. 4. Frequency of IFN-γ+ NKG2R+ cells negatively correlates with frequency of Spike+ Mac.
a, Unsupervised analysis by the UMAP dimension reduction algorithm of Singlet, live, CD45+CD14 lymphocytes isolated from BALF of WTM (n = 15), OM (n = 10) at >221 d p.i. and HC (n = 6). Cells were gated, downsampled to 3,000 cells per sample, barcoded and concatenated. CD45 was excluded from the list of UMAP running parameters. Density plot for each group of monkeys is shown. Manually gated lymphocyte populations shown on the UMAP plot with the corresponding color; intensities of each marker used in the analysis shown on the UMAP plots. b, Frequency of NKG2R+ lymphocyte in BALF cells of WTM, OM and HC at least 221 d p.i. ce, Histograms (left) and frequency (right) of IFN-γ (c), granzyme B (d) and CD107a (e) in NKG2R T cells, NKG2R+ NK cells and CD3+NKG2R+ T cells from the BALF of WTM, OM and HC as in a. f, Spearman correlation analysis of the frequencies of IFN-γ+, GzmB+, CD107a+ cells among NKG2R+ cells and frequencies of Spike+ Mac in BALF cells. In all graphs, the median and the interquartile range are shown. P values were determined using a Kruskal–Wallis test with Dunn’s post hoc test. In the correlation analyses, the black solid line represents linear regression, and the dotted lines represent the confidence interval (95%). Source data
Fig. 5
Fig. 5. IFN-γ inhibits SARS-CoV-2 replication and increases MHC-E expression.
a, Representative confocal image of BALF Mac from WTM (n = 15) and OM (n = 10) isolated at least 221 d p.i. and cultured with or without IFN-γ for 8 h, then stained with DAPI and dsRNA Abs. b, MFI of dsRNA per cell (left) and viability (right) of BALF Mac as in Fig. 2d. Fluorescence intensity of dsRNA in each cell measured after cell segmentations. Cell viability measured by Trypan blue exclusion. c, Spearman correlation analysis of frequency of IFN-γ+ NKG2R+ NK cells and Spike+ Mac in BALF of WTM and OM at the median of 221 d p.i. d, Representative confocal image of BALF Mac from WTM and OM isolated at least 221 d p.i. and cultured with or without IFN-γ for 8 h, then stained with DAPI, dsRNA and MHC-E Abs. e, MFI of MHC-E per cell of BALF Mac as in Fig. 2j. Fluorescence intensity of dsRNA in each cell measured after cell segmentations. f, Spearman correlation analysis of MHC-E MFI in BALF Mac measured as in Fig. 3k and frequency of IFN-γ+CD8+NKG2R+ T cells measured in BALF of WTM and OM. In all graphs, the median and the interquartile range are shown. P values were determined using a Kruskal–Wallis test. In all correlation analyses, not all animals are labeled, the black solid line represents linear regression and the dotted lines the confidence interval (95%). Source data
Fig. 6
Fig. 6. Expression of FoxJ1 is upregulated in BALF NKG2R+ NK cells.
a, Heatmap of gene expression profiles in NKG2R+ NK cells from BALF of 15 WTM and 5 HC at ≥461 d p.i., based on mRNA counts normalized z scores via the nanoString nCounter System. b, PCA (top) and volcano plot (bottom) showing differentially expressed genes in BALF NKG2R+ NK cells, as in Fig. 4a. Dotted lines indicate significance thresholds (Padj = 0.05; log(fold change) >1 or < −1). c, Heatmap of gene expression in BALF compared to blood NKGR+ NK cells from 12 paired WTM samples based on z scores as in Fig. 4a. d, PCA (top) and volcano plot (bottom) showing genes upregulated or downregulated between blood and BALF NKGR+ NK cells as in Fig. 4c. Dotted lines indicate significance thresholds. e, Heatmaps of significantly altered mRNAs for various markers and receptors in specific cell populations and tissues. f, UMAP analysis of CD45+CD14CD3CD20NKG2R+ lymphocytes from BALF of WTM, OM and HC. Manually gated lymphocyte populations are color-coded. g, MFI of surface markers and cytokines in BALF NKG2R+ NK cells from WTM, OM and HC at ≥461 d p.i. h,i Contour plots (h) and frequency (i) of distinct NKG2R/CD16 NK cell subpopulations in HC and WTM (as OM) at ≥461 d p.i. Cluster distance values are determined with the Euclidean method. For all graphs, symbols represent individual macaques; bars indicate medians. Interquartile ranges are shown. P values determined by Kruskal–Wallis test with Dunn’s post hoc test. Source data
Fig. 7
Fig. 7. NK cell IFN-γ production following spike stimulation.
a, Representative GzmB and IFN-γ expression plots in NKG2Rlo and NKG2Rhi NK cells from WTM (n = 15) and OM (n = 10), isolated ≥221 d p.i., cultured with or without spike protein. b,c, GzmB and IFN-γ expression in NKG2Rhi and NKG2Rlo NK cells from WTM (b) and OM (c), isolated ≥221 d p.i., cultured with DMSO, LPS, trimeric spike, spike domain S1 or spike domain S2. d, GzmB and IFN-γ expression in NKG2Rhi and NKG2Rlo NK cells from WTMneg, WTMlo, WTMhi, OMneg, OMlo and OMhi, isolated ≥221 d p.i., and cultured with spike protein for 24 h. Each symbol represents an individual; bars represent medians. Interquartile ranges are shown. In all graphs, P values were determined by Kruskal–Wallis test with Dunn’s post hoc test. Source data
Fig. 8
Fig. 8. Spike leader sequence peptide inhibits NK cell lysis.
a, Histogram showing the MFI of MHC-E in K562 cells transduced with MHC-E (MHC-E*01:03) after peptide loading (VL9, HSP60, V3–11) and culture for 12 h (left), and graph illustrating the expression of MHC-E in MHC-E*01:03 cells after peptide loading (with VL9, HSP60, and V3–11 peptides) compared to the control condition with no peptides, following a 12-h culture (right). b, Histogram displaying the MFI of biotinylated peptides (VL9, HSP60, V3–11) loaded into MHC-E*01 cells and revealed through conjugation with streptavidin, following a 12-h culture period (left) and expression of biotinylated peptides (VL9, HSP60, V3–11) in MHC-E*01:03 cells after peptide loading (with VL9, HSP60 and V3–11 peptides), in comparison to the control condition with no peptides, following a 12-h culture period (right). c, Dot plot illustrating the distribution of blood NK cells from 13 human PBMCs collected before 2019 based on NKG2A and NKG2C expression (left) and frequency of NKG2C+NKG2A, NKG2C+NKG2A+ and NKG2CNKG2A+ cell subsets in human PBMCs collected before 2019 (right). d, Inhibition of degranulation in human NKG2C+NKG2A, NKG2C+NKG2A+, NKG2CNKG2A+ and NKG2CNKG2A NK cell subsets exposed to K562-E-01 cells loaded with VL9 and HSP60 peptides during an 8-h coculture, as in c. e, Inhibition of degranulation in human NKG2C+NKG2A, NKG2CNKG2A+ and NKG2C+NKG2A+ NK subsets during 8-h coculture with VL9, HSP60 and the spike-derived peptide V3–11. f, Inhibition of degranulation in BALF NKG2R+ NK cells isolated ≥461 d p.i. from 15 WTM and incubated with V3–11 peptide-loaded K562-E-01 cells for 8 h. g, Spearman correlation analysis between V3–11 peptide-induced inhibition of NKG2R+ NK cell degranulation and viral load measured in Fig. 2a, Spike+ Mac frequency measured in Fig. 2c and GzmB expression in NKG2Rhi NK cells in total BALF cells of WTM after 24 h of spike stimulation, as measured in Fig. 7b. Each symbol represents an individual; bars represent medians. Interquartile ranges are shown. In all graphs, P values were determined by Kruskal–Wallis test with Dunn’s post hoc test. Source data
Extended Data Fig. 1
Extended Data Fig. 1. Viral and immunological parameters in convalescent monkeys.
(a) Viral loads in tracheal and nasal swabs of WTM and OM collected at various time points (2-265 days post-infection (p.i.)) and analyzed for viral genomic RNA (gRNA). The area under the curve (AUC) represents the total gRNA shed between 2 and 21 days p.i. (b) Antibody titers (IgG and IgA) measured by ELISA against the entire spike protein or RBD domain in plasma of WTM and OM collected at least 221 days p.i. (c) Luminex assay of cytokines (IL-23, -18, -6, and -15) and ELISA assay of cytokine IP-10 and sCD14 in plasma of HC, WTM, and OM collected at least 221 days p.i. (d) Flow cytometry analysis gating strategy for BALF Macs at least 221 days p.i., using size and granulometry parameters (FSC-A, FSC-H, SSC-A, SSC-H) and surface expression of CD45 and HLA-DR. (e) Spearman correlation between plasmatic cytokines (as in b) and the percentage of lymphocytes or Mac among BALF CD45+ cells at least 221 days p.i. (f) Gating strategy used to characterize BALF Mac. Representative dot plot for the indicated markers shown for HC and WTM. (g) Mean fluorescence intensity (MFI) of various markers in BALF Mac from HC, WTM, and OM at least 221 days p.i. (h) Frequency of markers measured in BALF Mac from HC, WTM, and OM at least 221 days p.i. In each panel, individual macaques are represented, and for Spearman correlations, black full lines represent linear regression, while dotted lines represent the confidence interval (95%). Each point is labeled with the corresponding monkey’s name. Symbols represent individual macaques, and bars indicate medians. Interquartile ranges are shown. p-Values determined by Kruskal-Wallis test with Dunn’s post-test, except for panel (a) (left), where a Mann-Whitney test was applied.
Extended Data Fig. 2
Extended Data Fig. 2. Mac components in WTM and OM compared to HC.
(a) A 2-D cell segmentation process using image analysis is outlined to quantify cellular and viral components. It involves three stages: (1) Sample preparation and image acquisition, (2) image preprocessing for improved edge detection accuracy, and (3) thresholding-based segmentation using ImageJ. Detailed methodology is in the Methods section. (b) High-magnification epifluorescent images show BALF CD64+ Mac isolated from WTM and OM at ≥221 days p.i., as well as HC control images, are shown. These cells were cultured with or without lipopolysaccharide (LPS) for 8 hours and stained for DAPI, IFN-γ, IL-23, IL-1β, IL-18, or IL-10. Scale bars represent 10 µm. (c) Cytokine mean fluorescence intensity (MFI) measurements for IL-10, IFN-γ, IL-23, IL-18, and IL-1β expression, as described in (a), in macrophages isolated from BALF of heathy HC, WTM, and OM at ≥221 days p.i. Macrophages were cultured for 8 hours with or without LPS. Individual cells are displayed in the graph. (d) A table summarizes viral load measurements in total BALF cells at ≥221 days p.i. for each animal. (e) Cytokine analysis using Luminex and ELISA assays classifies monkeys based on viral RNA levels in total BALF cells at ≥221 days p.i. Each monkey is represented in the graph. Median values with interquartile ranges are shown. Statistical significance was assessed using a 2-way ANOVA test with Šídák’s multiple comparisons test correction in panel c (***=p < 0.0001, **=p < 0.001, *=p < 0.01) and Kruskal-Wallis test with Dunn’s post-test in panel d. Source data
Extended Data Fig. 3
Extended Data Fig. 3. Viral compound detection in cultured BALF macrophages.
(a) Confocal microscopy images show the intracellular localization and accumulation of SARS-CoV-2 nonstructural protein 3 (NSP3) and double-stranded RNA (dsRNA) in BALF CD64+ Mac isolated from WTM and OM at ≥221 days p.i. After 8 hours of culture, cells were fixed with 4% formaldehyde. Immunostaining included DAPI (nucleus; purple), anti-dsRNA (red), and anti-NSP3 (green). Yellow arrows highlight dsRNA within the macrophages. (b) Similar to (a), these confocal microscopy images depict the intracellular localization of NSP3 and dsRNA in BALF CD64+ Macs, with the addition of Phalloidin (white) staining to highlight protrusions within the macrophages. Blue arrows indicate the presence of protrusions. Increased threshold on fields displaying only Actin was used to facilitate visualization of pseudopod- and TNT-like structures. (c) Confocal microscopy images as in (b) show syncytia observed in MAC culture. Scale bars in (a) = 45 µm, Scale bars in (b) and (c) = 35 µm. Some images use 3D rendering techniques to highlight the three-dimensional aspect of the visualization.
Extended Data Fig. 4
Extended Data Fig. 4. In-vitro transcriptome analyses of BALF macrophages.
CD64+ macrophages were isolated from BALF of 5 HC, 5 randomly selected WTM, and 10 OM at least 221 days p.i. After 8 hours of culture, they were profiled using the nanoString nCounter System. (a) Principal Component Analysis (PCA) shows clustering patterns of convalescent monkeys. OM samples are represented by purple triangles and WTM samples by red squares. Volcano plots highlight genes significantly up-regulated and down-regulated between WTM and OM. (b) Similar to (a), volcano plots highlight genes significantly up-regulated and down-regulated between WTM and HC (up) or between OM and HC (down). (c) Heat map displays the top 50 genes resulting from Gene Set Enrichment Analysis (GSEA) conducted on the Hallmark gene sets obtained in (a). (d) Enrichment plots show data sets enriched in GSEA Hallmark analysis of CD64+ Mac as in (a), displaying the running Enrichment Score (ES) and positions of gene set members on the rank-ordered list. (e) Gating strategy defines different lymphocyte populations in BALF of HC, WTM, and OM at least 221 days p.i. Populations are defined based on specific marker expression. (f) Comparison of various lymphocyte populations in BALF of HC, WTM, and OM. (g) Comparison of marker expression on BALF CD45+ lymphocytes as described in (e). In each graph, individual symbols represent individual monkeys, bars indicate medians, and interquartile ranges are shown. p-Values were determined using a Kruskal-Wallis test with Dunn’s post-test in (f) and (g). Source data
Extended Data Fig. 5
Extended Data Fig. 5. Impact of IFN-ɣ on SARS-CoV-2 replication in BALF macrophages.
(a) Confocal microscopy images show the intracellular accumulation of SARS-CoV-2 dsRNA in BALF CD64+ Mac from WTM and OM at ≥221 days p.i., cultured with or without IFN-γ. DAPI (nucleus) is in purple, and anti-dsRNA staining (SARS-CoV-2 dsRNA) is in red. (b) Measurement of SARS-CoV-2 dsRNA MFI in CD64+ Macs isolated from BALF of WTM, and OM at ≥221 days p.i., cultured with or without IFN-γ. (c) Confocal microscopy images depict MHC-E localization in BALF CD64+ Macs from WTM and OM at ≥221 days p.i., cultured with or without IFN-γ stimulation. DAPI (nucleus) is in blue, anti-dsRNA staining (SARS-CoV-2 dsRNA) is in red, and anti-MHC-E staining is in green. (d) Measurement of MHC-E MFI in CD64+ Macs isolated from BALF of WTM, and OM at ≥221 days p.i., cultured with or without IFN-γ. In each graph, median and interquartile range are shown. p-Values were determined using a 2-way ANOVA test with Šídák’s multiple comparisons test correction. Source data
Extended Data Fig. 6
Extended Data Fig. 6. Transcriptome analysis of BALF NKG2R+ NK cells.
(a) Top: PCA shows the clustering pattern of WTM and HC samples. Red circles represent WTM, and gray circles represent HC. Each PCA plot indicates the specific comparison performed. Bottom: Volcano plots highlight genes significantly up-regulated and down-regulated in various comparisons, using p-values instead of Padj. Horizontal lines represent p-value = 0.05, and vertical lines indicate log2 fold change > 1 or < -1. (b) Comparison of MFI for various markers on BALF NKG2R+ NK cells isolated from HC, WTM, and OM at least 221 days p.i. (c) Spearman correlation analysis between NKG2R MFI on BALF NKG2R+ NK cells from WTM and OM isolated at least 221 days p.i. and Spike+ Mac measured as in Fig. 2. (d) Comparison of NKG2RloCD16, NKG2RhiCD16, NKG2RhiCD16+, and NKG2RloCD16+ populations among bulk NK cells, measured on BALF NKG2R+ NK cells from HC, WTM, and OM isolated at least 221 days p.i. (e) Spearman correlation between the frequency of NKG2RhiCD16, NKG2RhiCD16+, and NKG2RloCD16+ populations among bulk NK cells (as in (d) and Spike+ Mac measured as in Fig. 2. For all Spearman correlations, the black solid line represents linear regression, and dotted lines indicate the confidence interval (95%). Symbols represent individual macaques, bars indicate medians, and interquartile ranges are shown. p-Values were determined by Kruskal-Wallis test with Dunn’s post-test. Source data
Extended Data Fig. 7
Extended Data Fig. 7. SARS-CoV-2 spike protein binding on lymphocytes.
(a) Representative flow cytometry plots showing the gating strategy for trimeric spike surface staining on total BALF cells from HC, WTM, and OM at ≥221 days p.i. Populations are defined based on specific marker expression. (b) Dot plot illustrating the percentage of surface trimeric spike staining on CD4+ T cells, CD8+ T cells, and NKG2R+ NK cells from HC, WTM, and OM. Dot plots are color-coded for clarity. (c) Left: graph displaying the percentage of CD20+ B cells positive for trimeric spike surface staining in total BALF cells from HC, WTM, and OM at ≥221 Days p.i. Right: positive Spearman correlation between the percentage of cells stained with trimeric spike among BALF CD20+ B cells and the amount of IgG anti-RBD measured in the plasma as in Fig. 1. (d) Graph showing the percentage of CD4+ T cells, CD8+ T cells, and NK cells positive for trimeric spike surface staining in BALF cells from HC, WTM, and OM at ≥221 Days p.i. In Spearman correlation, the black solid line represents linear regression, and the dotted line indicates the confidence interval (95%). Each point is labeled with the corresponding monkey’s name. In each graph, dots, squares, or triangles represent individual monkeys, bars indicate medians, and interquartile ranges are shown. p-Values were determined using a Kruskal-Wallis test with Dunn’s post-test. Source data
Extended Data Fig. 8
Extended Data Fig. 8. NK cell responses after exposure to SARS-CoV-2 spike protein.
(a) Representative dot plot illustrating the percentage of intracellular GzmB or IFN-ɣ in NK cells obtained from BALF of HC, WTM, and OM at ≥ 221 days p.i following 24 hours of culture exposed or non-exposed to trimeric spike protein. The red and purple light squares around the dot plot delineate the WTM (n = 10) and OM (n = 10) convalescent monkey groups, respectively. (b) Comparative analysis of intracellular GzmB or IFN-ɣ between NKG2Rhi and NKG2Rlo NK cells, following 24 hours of exposure to trimeric spike protein. Each symbol represents an individual monkey, and the median along with the interquartile range is depicted. The p-value was determined using the Wilcoxon matched-pairs signed rank test.
Extended Data Fig. 9
Extended Data Fig. 9. Identifying HLA-E Binding Potential in SARS-CoV-2 Signal Peptides.
(a) Literature-based scheme summarizing peptide processing via TAP-dependent and TAP-independent pathways. (b) In silico analysis predicting signal peptide presence in spike proteins and their cleavage sites, with SignalP 6.0 software suggesting cleavage by Signal peptidase (SP) and Signal peptide peptidase (SPP). Signal peptides comprise hydrophobic core (h region), polar C-terminal end (c region), and polar N-terminal region (n region). (c) Schematic displaying four overlapping nonamers in the 5’ region of SARS-CoV-2 signal peptide (P0DTC2), with V3-11 resembling the MHC-E binding motif. MHC restrictions and references provided. (d) In silico epitope predictions for HLA-E binding using the IEDB analysis resource, covering the entire spike sequence. Graphs exhibit HLA-E*01:01 binding scores, proteasomal cleavage, transport scores, and total scores combining HLA-E binding and processing. Red dots represent spike SP peptides from (c), and S269–277 corresponds to a previously described peptide. (e) Comparison of binding probabilities to HLA-E and HLA-A using NetMHCpan - 4.1, analyzing the entire SARS-CoV-2 spike protein. Multiple nonamers represented as black dots, with dot positions indicating predicted HLA-E binding capacity. Percentile ranks for HLA-E01:01 (y-axis) and HLA-E02:01 (x-axis) are provided. (f) Representative dot plot showcasing NKG2A+ and NKG2C+ human NK cell responses. (g) Dot plots displaying the percentage of CD107a+ NK cells isolated from HC and WTM at ≥ 221 days p.i. after co-culture with K562-E*01 cells loaded with peptides (VL9, HSP60, or V3-11) or no peptides. Light squares indicate wildtype infected convalescent monkeys, while light gray squares represent HC.

Update of

References

    1. Lamers MM, Haagmans BL. SARS-CoV-2 pathogenesis. Nat. Rev. Microbiol. 2022;20:270–284. doi: 10.1038/s41579-022-00713-0. - DOI - PubMed
    1. Choudhary S, Sharma K, Silakari O. The interplay between inflammatory pathways and COVID-19: a critical review on pathogenesis and therapeutic options. Microb. Pathog. 2021;150:104673. doi: 10.1016/j.micpath.2020.104673. - DOI - PMC - PubMed
    1. Patterson BK, et al. Persistence of SARS CoV-2 S1 protein in CD16+ monocytes in post-acute sequelae of COVID-19 (PASC) up to 15 months post-infection. Front. Immunol. 2021;12:746021. doi: 10.3389/fimmu.2021.746021. - DOI - PMC - PubMed
    1. Stein SR, et al. SARS-CoV-2 infection and persistence in the human body and brain at autopsy. Nature. 2022;612:758–763. doi: 10.1038/s41586-022-05542-y. - DOI - PMC - PubMed
    1. Merad M, Martin JC. Pathological inflammation in patients with COVID-19: a key role for monocytes and macrophages. Nat. Rev. Immunol. 2020;20:355–362. doi: 10.1038/s41577-020-0331-4. - DOI - PMC - PubMed

Substances