. 2024 Jan;38(1):109-125.
doi: 10.1038/s41375-023-02074-w. Epub 2023 Nov 2.

Single-cell analysis of immune recognition in chronic myeloid leukemia patients following tyrosine kinase inhibitor discontinuation

Affiliations

Single-cell analysis of immune recognition in chronic myeloid leukemia patients following tyrosine kinase inhibitor discontinuation

Jani Huuhtanen et al. Leukemia. 2024 Jan.

Abstract

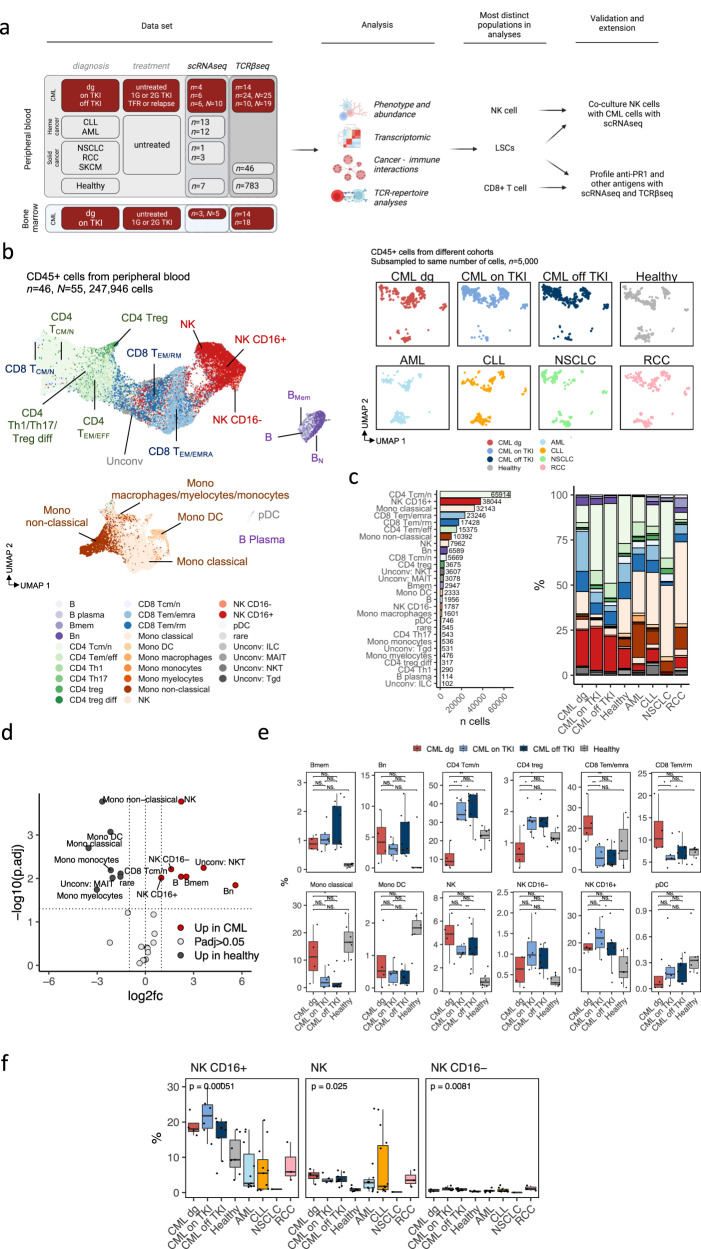
Immunological control of residual leukemia cells is thought to occur in patients with chronic myeloid leukemia (CML) that maintain treatment-free remission (TFR) following tyrosine kinase inhibitor (TKI) discontinuation. To study this, we analyzed 55 single-cell RNA and T cell receptor (TCR) sequenced samples (scRNA+TCRαβ-seq) from patients with CML (n = 13, N = 25), other cancers (n = 28), and healthy (n = 7). The high number and active phenotype of natural killer (NK) cells in CML separated them from healthy and other cancers. Most NK cells in CML belonged to the active CD56dim cluster with high expression of GZMA/B, PRF1, CCL3/4, and IFNG, with interactions with leukemic cells via inhibitory LGALS9-TIM3 and PVR-TIGIT interactions. Accordingly, upregulation of LGALS9 was observed in CML target cells and TIM3 in NK cells when co-cultured together. Additionally, we created a classifier to identify TCRs targeting leukemia-associated antigen PR1 and quantified anti-PR1 T cells in 90 CML and 786 healthy TCRβ-sequenced samples. Anti-PR1 T cells were more prevalent in CML, enriched in bone marrow samples, and enriched in the mature, cytotoxic CD8 + TEMRA cluster, especially in a patient maintaining TFR. Our results highlight the role of NK cells and anti-PR1 T cells in anti-leukemic immune responses in CML.


Conflict of interest statement

P.D. is currently employed by Nygen Analytics AB. M.I. is currently employed by Bristol Myers Squibb. U.O.S. has received honoraria from Incyte. H.H.H. has received honoraria from Novartis, Bristol Myers Squibb, and Incyte. A.B. has received honoraria from Novartis and MSD. G.K. is currently employed by Nygen Analytics AB. A.K. is currently employed by Bristol Myers Squibb. S.M. has received honoraria from Bristol Myers Squibb and DrenBio and research funding from BMS, Novartis, and Pfizer. All other authors declare no conflicts of interests.

Figures

Fig. 1
Fig. 1. CML patients have unique NK cell repertoire.
a Schematics showing the overview of data sets, analysis, and validation and extensions. Picture created with biorender.com. b Uniform Manifold Approximation and Projection (UMAP) representation of the pooled RNA profiles of 247,946 CD45+ single-cells including peripheral blood samples from patients with CML (diagnosis n = 4, on TKI n = 6, N = 6, off TKI n = 6, N = 10), patients with untreated hematological cancers (CLL n = 13, AML n = 11), patients with untreated solid cancer (RCC n = 3, NSCLC n = 1), and healthy controls (n = 7). Cells are colored based on the cluster-agnostic, reference-based method Celltypist. On the right, all different conditions are subsampled to 5,000 cells. c The number of predicted cell types and the median proportion of cells within each condition. Colors map to UMAP colors in b. d Differentially abundant scRNAseq populations (Padj < 0.05, Benjamini-Hochberg-corrected two-sided Mann-Whitney test) between patients with CML from different disease phases (n = 10) and healthy controls (n = 7). The horizontal line denotes Padj = 0.05 and the vertical lines log2 fold-change of 1 and −1. e ScRNAseq population abundances in patients with CML (diagnosis n = 4, on TKI n = 6, N = 6, off TKI n = 6, N = 10) and healthy controls (n = 7). P-values were calculated with a two-sided Mann-Whitney test. f ScRNAseq NK population abundances in patients with CML (diagnosis n = 4, on TKI n = 6, N = 6, off TKI n = 6, N = 10), healthy controls (n = 7), patients with untreated hematological cancers (CLL n = 13, AML n = 11), and patients with untreated solid cancer (RCC n = 3, NSCLC n = 1). P values were calculated with a Kruskal-Wallis test. CML=chronic myeloid leukemia, CLL=chronic lymphocytic leukemia, AML= acute myeloid leukemia, RCC=renal cell carcinoma, NSCLC=non-small cell lung carcinoma, TKI=tyrosine kinase inhibitor. n refers to the number of patients and N to the number of samples where it differs from n. *=P < 0.05, **=P < 0.01, ***=P < 0.001, ****=P < 0.0001.
Fig. 2
Fig. 2. NK cell phenotype changes to more mature during the TKI treatment.
a UMAP representation of the NK CD16 + , NK CD16-, and NK cells identified by Celltypist, colored by manually annotated clusters or scaled expression of genes used to annotate the phenotypes. b Scaled average expressions (avg exp) and proportion of cells expressing (pct.exp) the canonical markers used to define the clusters. Encircled dots are differentially expressed (Padj < 0.05, Bonferroni corrected t-test) in a given cluster in comparison to other clusters. c Top: The number of NK cells from each condition. Bottom: The median proportion of NK cell subtypes out of total NK cells within each condition. Colors in the lower panel map to UMAP colors in a. d ScRNAseq population abundances in patients with CML (diagnosis n = 4, on TKI n = 6, N = 6, off TKI n = 6, N = 10) and healthy controls (n = 7). P-values were calculated with a two-sided Mann-Whitney test. e Left: Differentially expressed genes (Padj < 0.05, Bonferroni corrected t-test) in active CD56dim NK cells (cluster 0) from before TKI cessation between patients who sustain treatment-free remission (TFR) and patients who had early relapse ( < 6 months) after cessation. Right: Cytotoxicity score of active CD56dim NK cells (cluster 0) in baseline in patients who sustain TFR and early relapse. Note that multiple genes upregulated in patients with early relapse were associated with cytotoxicity. f Left: Differentially expressed genes (Padj < 0.05, Bonferroni corrected t-test) in active CD56dim NK cells (cluster 0) from after and before TKI cessation, separately in TFR and early relapse. CML=chronic myeloid leukemia, CLL = chronic lymphocytic leukemia, AML= acute myeloid leukemia, RCC = renal cell carcinoma, NSCLC = non-small cell lung carcinoma, TKI = tyrosine kinase inhibitor. N refers to the number of patients and N to the number of samples where it differs from n. *=P < 0.05, **=P < 0.01, ***=P < 0.001, ****=P < 0.0001.
Fig. 3
Fig. 3. Immune interactions are more frequent against CD34+ cells that express high BCR-ABL1 pathway activity.
a UMAP representation of the pooled RNA profiles of patients with newly diagnosed CML (n = 3) CD34+ (N = 3) and CD34 + CD38- (N = 2) sorted single-cells from the bone-marrow, colored by manually annotated clusters or scaled expression of genes used to annotate the phenotypes or BCR-ABL1 activity score shown in five equal quantiles. BCR-ABL1 score was calculated with differentially expressed genes between BCR-ABL1 mutated and wild-type CML cells in Giustacchini et al. [37]. b The number of significant (P < 0.05, CellPhoneDB test) ligand-receptor interactions between CML cells and immune cells from patients with newly diagnosed CML. c Significant (P < 0.05, CellPhoneDB test) inhibitory ligand-receptor interactions between CML and NK cells. Ligands that are expressed on CML cells are highlighted in brown color and receptors that are expressed on immune cells are highlighted in blue color. Interactions are shown separately with different CML CD34+ cell clusters, where CML CD34+ clusters with high BCR-ABL1 score are highlighted in red and CD34+ with low BCR-ABL1 score are highlighted in blue. d Expression of inhibitory ligand-receptor genes and signature scores in CML LSCs (the same UMAP representation as in Fig. 3a) and NK cells (the same UMAP representation as in Fig. 2a). n refers to the number of patients and N to the number of samples where it differs from n.
Fig. 4
Fig. 4. Co-culture of expanded NK cells with CML cell lines show upregulated IFN-γ response in CML cells and active phenotype of NK cells.
a UMAP representation of K562 and LAMA84 cells cultured with and without expanded NK cells, colored by the presence of expanded NK cells. b Differentially expressed genes (Padj < 0.05, Bonferroni corrected t-test) between K562 and LAMA84 cells cultured with and without expanded NK cells. The genes related to IFN-γ response HALLMARK-category are highlighted in teal color. c Expression of selected co-inhibitory genes and IFN-γ response score in K562 and LAMA84 cells, calculated with the HALLMARK-category genes and shown in five equal quantiles. d UMAP representation of expanded NK cells cultured with and without K562 or LAMA84 cells, colored by the presence of tumor cells. e Differentially expressed genes (Padj < 0.05, Bonferroni corrected t-test) between expanded NK cells cultured with and without K562 or LAMA84 cells. f Expression of selected co-stimulatory genes in NK cells with and without co-culture of CML cells. g Expression of IFN-γ response score in primary CML LSCs. h Scaled average expressions (avg exp) and proportion of active NK cells expressing (pct.exp) some genes induced in the co-culture of NK cells, in patient samples. Encircled dots are differentially expressed (Padj < 0.05, Bonferroni corrected t-test) in a given patient group in comparison to other groups. i Proportion of expanded NK cells expressing IFN-γ after co-culture with CML cell lines LAMA84 or K562 with or without TIM3 blocking antibody in different concentrations. P-values were calculated with a paired t-test. *=P < 0.05, **=P < 0.01, ***=P < 0.001, ****=P < 0.0001.
Fig. 5
Fig. 5. Monitoring antigen-specific T-cell responses in CML show expansion of anti-PR1 T cells in CML, in bone marrow, and in dasatinib-treated patients.
a The same UMAP representation as in Fig. 3A of the pooled RNA profiles of patients with newly diagnosed CML (n = 3) CD34+ (N = 3) and CD34 + CD38- (N = 2) sorted single-cells from the bone-marrow, colored by PR1-expression score, which is a combination of PRTN3 and ELANE genes carrying the PR1 epitope. Clusters were divided into BCR-ABL1 high and low based on the clusters in Fig. 3A. P value was calculated with a two-sided Mann-Whitney. b Clonal structure of anti-PR1 T cell clonotype in individual samples. Each box within a facet is a unique clonotype, where its size corresponds to its proportion in the TCR repertoire. The same clonotypes are colored with the same color. c Network graph showing the similarity of the 231 anti-PR1 specific TCRs. Each node is a unique TCR and an edge between nodes denotes amino-acid-level similarity determined by GLIPH2. d AUROC plot showing the 10-fold cross-validation of the 231 anti-PR1 TCRs used as input for the TCRGP-classifier, where TPRS denotes true positive rates and FPRS denotes false positive rates. The mean of the AUROCs was 0.902. e The proportion of TCRGP predicted antigen-specific TCRs in CML (n = 48), healthy donors’ (n = 786), and in patients with melanoma (n = 46) peripheral blood samples. The samples were subsampled to the same sequencing depth. P-value was calculated with a two-sided Mann-Whitney test. f The proportion and number of TCRGP predicted antigen-specific TCRs in patients with CML in bone marrow (BM, n = 15) and peripheral blood (PB, n = 24). The samples were subsampled to the same sequencing depth. P-values were calculated with a two-sided Mann-Whitney test. g) The proportion of anti-PR1 T cells in patients with CML in diagnosis (n = 14), on TKI (n = 23), off TKI (n = 12), off TKI relapse (n = 7). P-values were calculated with a two-sided Mann-Whitney test. n refers to the number of patients and N to the number of samples where it differs from n. *=P < 0.05, **=P < 0.01, ***=P < 0.001, ****=P < 0.0001.
Fig. 6
Fig. 6. Phenotype of antigen-specific T cells show upregulated cytotoxicity and lesser exhaustion in anti-PR1 T cells in TFR in comparison to early relapse.
a The same UMAP representation as in Fig. 1A of the pooled RNA profiles of 247,946 CD45+ single-cells including peripheral blood samples from patients with CML (diagnosis n = 4, on TKI n = 6, N = 6, off TKI n = 6, N = 10), patients with untreated hematological cancers (CLL n = 13, AML n = 11), patients with untreated solid cancer (RCC n = 3, NSCLC n = 1), and healthy controls (n = 7), where T cells specific to PR1 are highlighted. The odds ratios (OR) of anti-PR1 T cells present in distinct clusters were calculated with the cell types shown in Fig. 1A. b ScRNAseq NK population abundances in patients with CML (diagnosis n = 4, on TKI n = 6, N = 6, off TKI n = 6, N = 10), healthy controls (n = 7), patients with untreated hematological cancers (CLL n = 13, AML n = 11), and patients with untreated solid cancer (RCC n = 3, NSCLC n = 1). P-value was calculated with a Kruskal-Wallis test. c UMAP representation of T cells with known anti-PR1 specificity from a patient with a treatment-free remission (N = 3 samples from 3 timepoints) and a patient with early relapse (N = 2 samples from two timepoints) following TKI discontinuation. Cells are colored based on manually annotated clusters (upper left UMAP), patients they were derived from (lower left UMAP), or scaled expressions of genes used to annotate the phenotypes (UMAPs on the right). d Differentially expressed genes (Padj < 0.05, Bonferroni corrected t-test) between cluster 1 and cluster 0 from Fig. 6C. e Scaled average expressions (avg exp) and proportion of antigen-specific T cells in two patients expressing (pct.exp) canonical T cell markers. Anti-PR1 T cells were defined with tetramer staining and the anti-viral T cells were predicted with TCRGP against CMV, EBV, HSV2, and Influenza A. CML=chronic myeloid leukemia, CLL=chronic lymphocytic leukemia, AML= acute myeloid leukemia, RCC=renal cell carcinoma, NSCLC=non-small cell lung carcinoma, TKI=tyrosine kinase inhibitor. n refers to the number of patients and N to the number of samples where it differs from n. *=P < 0.05, **=P < 0.01, ***=P < 0.001, ****=P < 0.0001.

References

    1. Mahon FX, Réa D, Guilhot J, Guilhot F, Huguet F, Nicolini F, et al. Discontinuation of imatinib in patients with chronic myeloid leukaemia who have maintained complete molecular remission for at least 2 years: the prospective, multicentre Stop Imatinib (STIM) trial. Lancet Oncol. 2010;11:1029–35. - PubMed
    1. Ross DM, Branford S, Seymour JF, Schwarer AP, Arthur C, Yeung DT, et al. Safety and efficacy of imatinib cessation for CML patients with stable undetectable minimal residual disease: results from the TWISTER study. Blood. 2013;122:515–22. - PubMed
    1. Saussele S, Richter J, Guilhot J, Gruber FX, Hjorth-Hansen H, Almeida A, et al. Discontinuation of tyrosine kinase inhibitor therapy in chronic myeloid leukaemia (EURO-SKI): a prespecified interim analysis of a prospective, multicentre, non-randomised, trial. Lancet Oncol. 2018;19:747–57. - PubMed
    1. Mori S, Vagge E, le Coutre P, Abruzzese E, Martino B, Pungolino E, et al. Age and dPCR can predict relapse in CML patients who discontinued imatinib: the ISAV study. Am J Hematol. 2015;90:910–4. - PubMed
    1. Nicolini FE, Dulucq S, Guilhot J, Etienne G, Mahon F-X. The Evaluation of Residual Disease By Digital PCR, and TKI Duration Are Critical Predictive Factors for Molecular Recurrence after for Stopping Imatinib First-Line in Chronic Phase CML Patients: Results of the STIM2 Study. Blood. 2018;132:462. - PubMed

Publication types

MeSH terms

Substances