Review
. 2023 Nov 2;21(1):777.
doi: 10.1186/s12967-023-04631-4.

Deciphering the molecular and cellular atlas of immune cells in septic patients with different bacterial infections

Affiliations
Review

Deciphering the molecular and cellular atlas of immune cells in septic patients with different bacterial infections

Ping Sun et al. J Transl Med. .

Abstract

Background: Sepsis is a life-threatening organ dysfunction caused by abnormal immune responses to various, predominantly bacterial, infections. Different bacterial infections lead to substantial variation in disease manifestation and therapeutic strategies. However, the underlying cellular heterogeneity and mechanisms involved remain poorly understood.

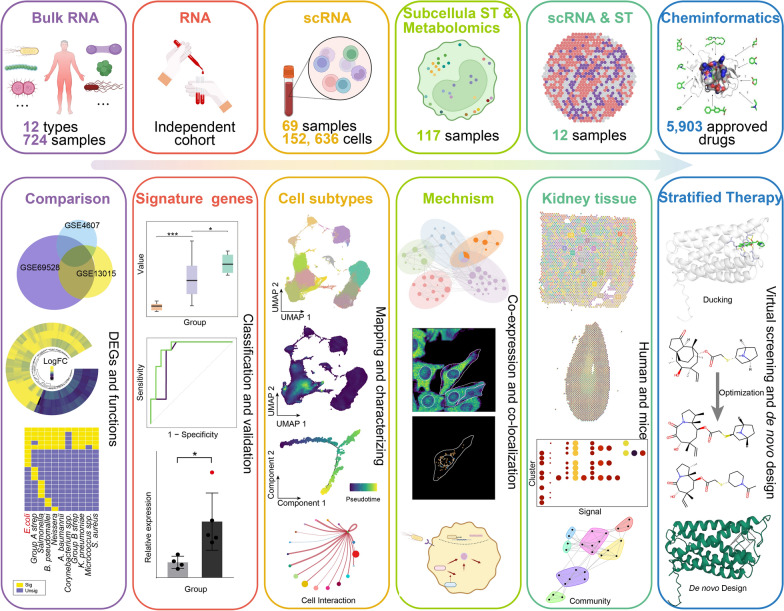
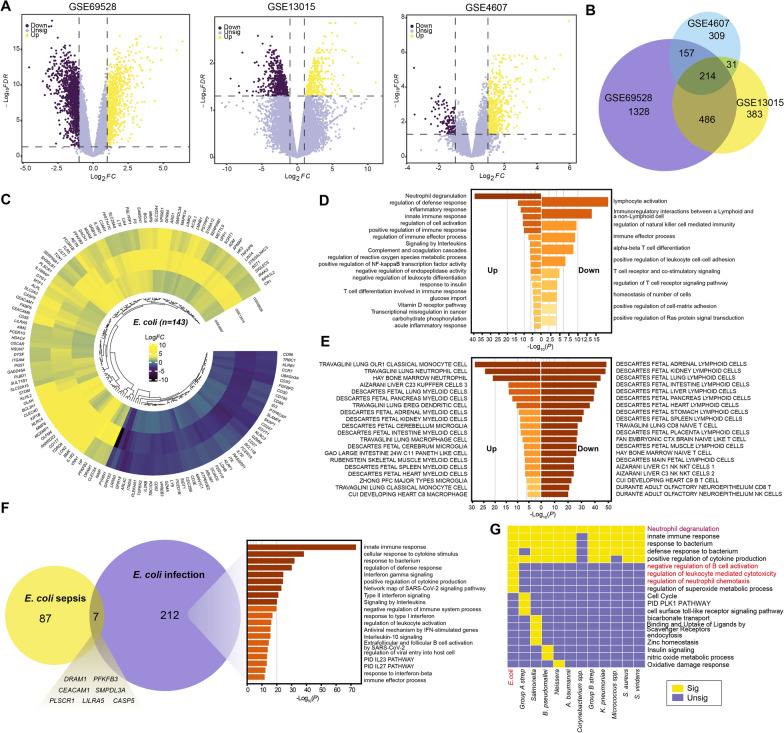
Methods: Multiple bulk transcriptome datasets from septic patients with 12 types of bacterial infections were integrated to identify signature genes for each infection. Signature genes were mapped onto an integrated large single-cell RNA (scRNA) dataset from septic patients, to identify subsets of cells associated with different sepsis types, and multiple omics datasets were combined to reveal the underlying molecular mechanisms. In addition, an scRNA dataset and spatial transcriptome data were used to identify signaling pathways in sepsis-related cells. Finally, molecular screening, optimization, and de novo design were conducted to identify potential targeted drugs and compounds.

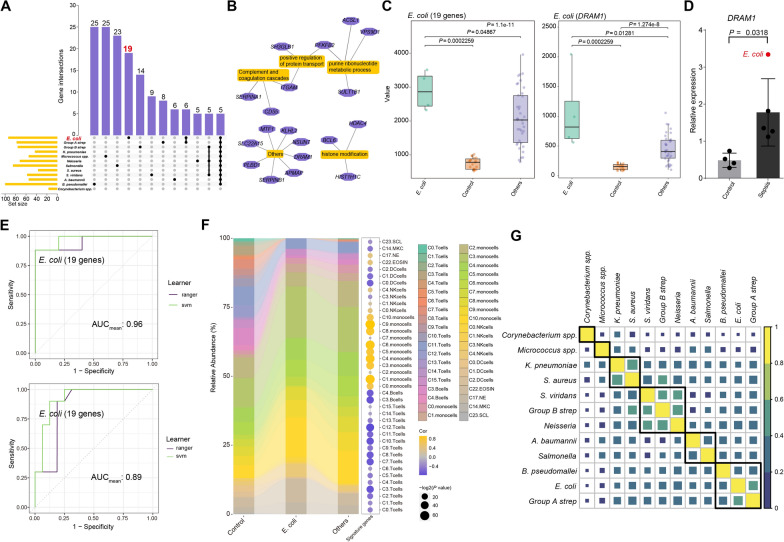
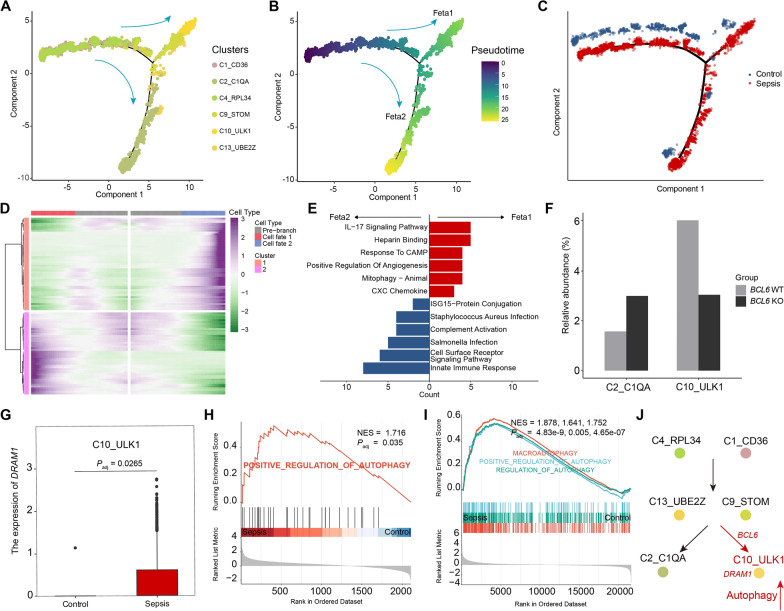
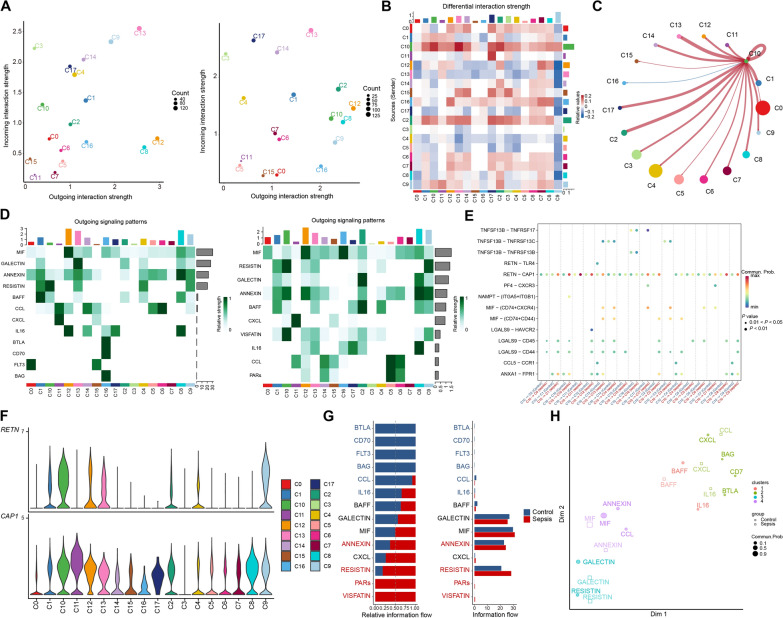
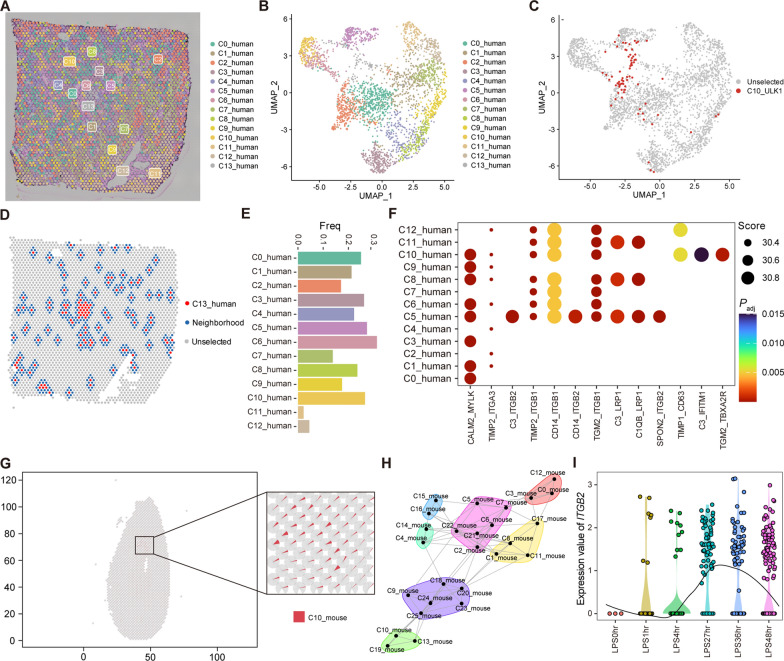
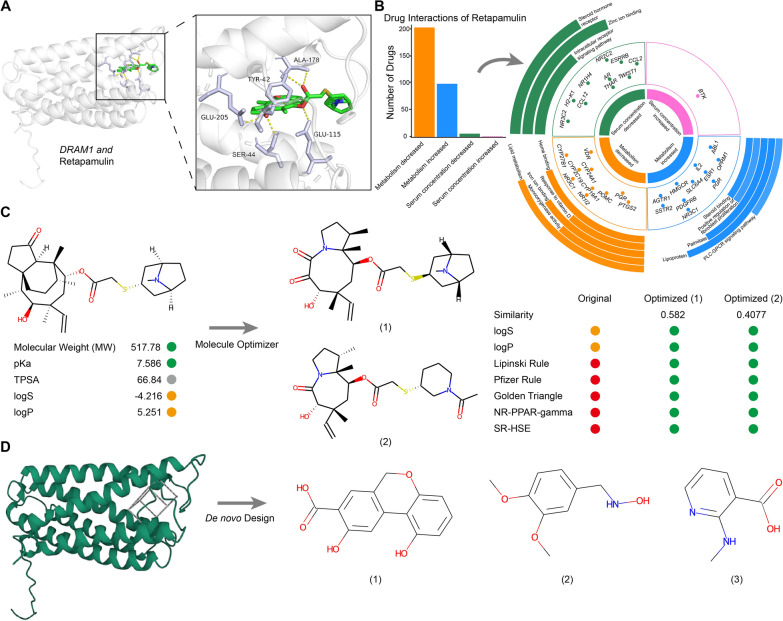
Results: We elucidated the cellular heterogeneity among septic patients with different bacterial infections. In Escherichia coli (E. coli) sepsis, 19 signature genes involved in epigenetic regulation and metabolism were identified, of which DRAM1 was demonstrated to promote autophagy and glycolysis in response to E. coli infection. DRAM1 upregulation was confirmed in an independent sepsis cohort. Further, we showed that DRAM1 could maintain survival of a pro-inflammatory monocyte subset, C10_ULK1, which induces systemic inflammation by interacting with other cell subsets via resistin and integrin signaling pathways in blood and kidney tissue, respectively. Finally, retapamulin was identified and optimized as a potential drug for treatment of E. coli sepsis targeting the signature gene, DRAM1, and inhibiting E. coli protein synthesis. Several other targeted drugs were also identified in other types of sepsis, including nystatin targeting C1QA in Neisseria sepsis and dalfopristin targeting CTSD in Streptococcus viridans sepsis.

Conclusion: Our study provides a comprehensive overview of the cellular heterogeneity and underlying mechanisms in septic patients with various bacterial infections, providing insights to inform development of stratified targeted therapies for sepsis.

Keywords: Cellular heterogeneity; Multi-omics; Sepsis; Stratified targeted therapies; Various bacterial infections.


Conflict of interest statement

The authors declare that they have no competing interests.

Figures

Fig. 1
Fig. 1
The experimental strategy is illustrated in a schematic map
Fig. 2
Fig. 2
Dysregulated features of E. coli sepsis. A Volcano plots depict the DEGs between E. coli sepsis and controls in each bulk dataset. B The venn diagram illustrates the relationship of DEGs from various datasets. C The circle heatmap displays the expression of 143 underlying key genes of E. coli sepsis in each dataset. D and E Bar graph of enriched terms in biological function D and cell type signatures E across the 143 genes, colored by Q values. F The venn diagram (left) depicts the relationship of DEGs from ex vivo whole blood infection with E. coli and E. coli sepsis, a bar graph (right) shows the enriched terms across 212 genes, colored by Q values. G The heatmap shows the common and specific function terms across all types
Fig. 3
Fig. 3
The signature genes of E. coli sepsis. A Upset plots show the unique and shared DEGs among different types of sepsis. B The signature genes of E. coli sepsis are identified. C The boxplot shows the average expression of signature genes and DRAM1. The P values are from a Wilcoxon test. D qRT-PCR analysis of DRAM1 expression in a cohort enrolled in this study (controls, n = 4; septic patients, n = 5). P value is determined by unpaired Welch's t-test. E Receiver operating curve for out-of-sample prediction of case–control state (up) and differentiation between E. coli sepsis and other types of sepsis (down) is trained on signature genes. F The Sankey plot (left) shows the cell abundance of each cluster (n = 40) across the 3 groups (controls, E. coli sepsis, and others). The heatmap (right) shows the correlation between signature genes and clusters. G The heatmap displays the similarity between different types of sepsis, with size and color indicating the similarity coefficient
Fig. 4
Fig. 4
The related cell clusters of E. coli sepsis. A The UMAP plot shows the clustering of 152,636 cells from 69 samples into 18 clusters. B Cell clusters are defined by a set of known marker genes. C The density scatter plot shows the expression levels of the E. coli sepsis signature. The color gradient represents the enrichment score, yellow indicates a higher score. D The density heatmap shows the expression and distribution of the E. coli sepsis signature in different cell subclusters. The color gradient represents the enrichment score, red indicates a higher score. E The heatmap shows the statistical significance of the E. coli sepsis signature in each cell subcluster as determined by the RRA method. The top bar graph shows the different cell subclusters, and the bottom bar graph shows the upregulation or downregulation of the signature gene set in each subcluster. F The marker genes of each monocyte cluster. G The bar chart shows the relative cell abundance of C1_CD36 and C10_ULK1 in controls and septic patients. P values are from a Wilcoxon test
Fig. 5
Fig. 5
Function of signature genes of E. coli sepsis in related cell clusters. A-C Pseudotime analysis of monocyte cell clusters. Trajectory of monocyte cell clusters is inferred using monocle2 and clusters are marked by colors A Pseudotime-ordered variables are inferred B Cells derived from case or control are displayed separately on the differentiation trajectory C Lines and arrows indicate inferred differentiation trajectory and direction. D Heatmap showing the expression of genes related cell fate decision. E Functional enrichment of genes related to two differentiation trajectories. F The bar chart shows the relative cell abundance of C2_C1QA (left) and C10_ULK1 (right) in WT and KO mice. G Expression of DRAM1 in C10_ULK1 between sepsis and controls. The P value is from a Wilcoxon test. H and I GSEA of autophagy-related genes in C10_ULK1 H and GSE4607 dataset I, comparing controls and septic patients. Nominal P value and the false-discovery rate (FDR) are indicated. J Schematic diagram of monocyte cluster differentiation
Fig. 6
Fig. 6
Function of DRAM1 in related cell clusters. A Functional annotation of DRAM1-related genes. B GSEA of glycolysis-related genes in C10_ULK1 comparing controls and septic patients. C Two-dimensional plots show the correlation between DRAM1 and GAPDH, glycolysis-related genes (from “HALLMARK_GLYCOLYSIS”). D The bar chart shows the expression level of LDHA in controls and E. coli septic patients. E Volcano plots depict the differential metabolites between bacterial sepsis and controls. F The 2D image displays the RNA density (left) and the distributions of DRAM1 and P4HB in cells (right). G The ridgeline plot shows the expression level of ELF1 in C10_ULK1 between controls and septic patients. H ELF1 ChIP-seq peaks at the promoter regions of DRAM1. I The schematic diagram shows the regulatory molecular mechanism of DRAM1 in C10_ULK1 in E. coli sepsis
Fig. 7
Fig. 7
The role of relevant cell clusters in sepsis PBMCs. A The strength of outgoing and incoming signals of cell clusters in controls (left) and septic patients (right). B Heatmap of differential interactions of clusters in the cell–cell communication network. The top bar indicates the sum of incoming signaling, and the right bar indicates the sum of outgoing signaling. C Differential interaction strength between C10_ULK1 (outgoing) and other cell clusters (incoming). D Heatmap showing the relative importance of outgoing signaling in each cell group in controls (left) and septic patients (right). E Comparison of significant ligand-receptor pairs between controls and septic patients. F The expressions of RETN (up) and CAP1 (down) in different cell clusters. G All the signaling pathways of controls and sepsis samples are presented in relative information flow (left) and overall information flow (right). H Two-dimensional manifold projection of signaling pathways based on their functional similarity
Fig. 8
Fig. 8
The role of relevant cell clusters in sepsis kidney tissue. A and B ST data from a human kidney tissue sample was processed and displayed with tissue sections A and UMAP plot B. Different colors represent different clusters. C The UMAP plot displays spots that were predicted to be C10_ULK1 in the spatial data. D The image depicts C13_human and its adjacent spots. E The image summarizes the proportions of different clusters present in the neighboring cells of C13_human. F The identified ligand-receptor pairs between C13_human and other clusters. G Localization of C10_mouse in kidney tissue. H Network community plot represents the communities of cells clusters from intrinsic view. I Expression of ITGB2 at different time points after LPS injection in C19_mouse
Fig. 9
Fig. 9
Identification of potential target drugs and molecules. A (Left) Protein–ligand docking complex of DRAM1 with Retapamulin. (Right) Zoomed-in views of the interaction contact region. B (Left) Bar graph showing the number of drugs interacting with Retapamulin. (Right) Multi-ring chart showing different interaction effects, interaction drug targets, and target-enriched pathways from inner to outer rings. C Optimized molecular structure of Retapamulin and the associated improved properties. D De novo molecular design based on DRAM1

References

    1. Cecconi M, Evans L, Levy M, Rhodes A. Sepsis and septic shock. Lancet. 2018;392:75–87. doi: 10.1016/S0140-6736(18)30696-2. - DOI - PubMed
    1. van der Poll T, van de Veerdonk FL, Scicluna BP, Netea MG. The immunopathology of sepsis and potential therapeutic targets. Nat Rev Immunol. 2017;17:407–420. doi: 10.1038/nri.2017.36. - DOI - PubMed
    1. Liu AC, Patel K, Vunikili RD, Johnson KW, Abdu F, Belman SK, et al. Sepsis in the era of data-driven medicine: personalizing risks, diagnoses, treatments and prognoses. Brief Bioinform. 2020;21:1182–1195. doi: 10.1093/bib/bbz059. - DOI - PMC - PubMed
    1. Holmes CL, Anderson MT, Mobley HLT, Bachman MA. Pathogenesis of gram-negative bacteremia. Clin Microbiol Rev. 2021;34(2):e00234-20. doi: 10.1128/CMR.00234-20. - DOI - PMC - PubMed
    1. Pankla R, Buddhisa S, Berry M, Blankenship DM, Bancroft GJ, Banchereau J, et al. Genomic transcriptional profiling identifies a candidate blood biomarker signature for the diagnosis of septicemic melioidosis. Genome Biol. 2009;10:R127. doi: 10.1186/gb-2009-10-11-r127. - DOI - PMC - PubMed

Publication types