. 2023 Nov 2;15(1):90.
doi: 10.1186/s13073-023-01239-7.

Multi-scale characterisation of homologous recombination deficiency in breast cancer

Affiliations

Multi-scale characterisation of homologous recombination deficiency in breast cancer

Daniel H Jacobson et al. Genome Med. .

Abstract

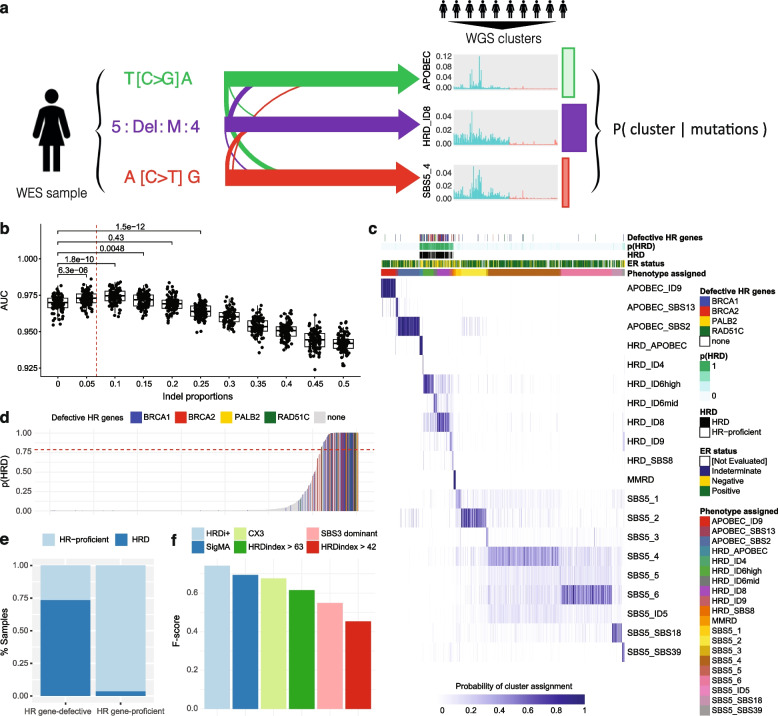
Background: Homologous recombination is a robust, broadly error-free mechanism of double-strand break repair, and deficiencies lead to PARP inhibitor sensitivity. Patients displaying homologous recombination deficiency can be identified using 'mutational signatures'. However, these patterns are difficult to reliably infer from exome sequencing. Additionally, as mutational signatures are a historical record of mutagenic processes, this limits their utility in describing the current status of a tumour.

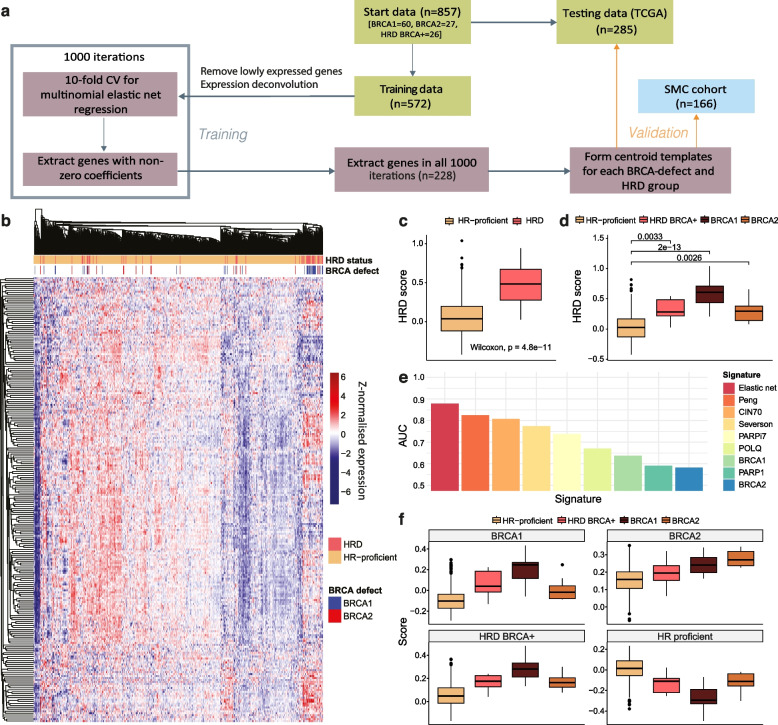
Methods: We apply two methods for characterising homologous recombination deficiency in breast cancer to explore the features and heterogeneity associated with this phenotype. We develop a likelihood-based method which leverages small insertions and deletions for high-confidence classification of homologous recombination deficiency for exome-sequenced breast cancers. We then use multinomial elastic net regression modelling to develop a transcriptional signature of heterogeneous homologous recombination deficiency. This signature is then applied to single-cell RNA-sequenced breast cancer cohorts enabling analysis of homologous recombination deficiency heterogeneity and differential patterns of tumour microenvironment interactivity.

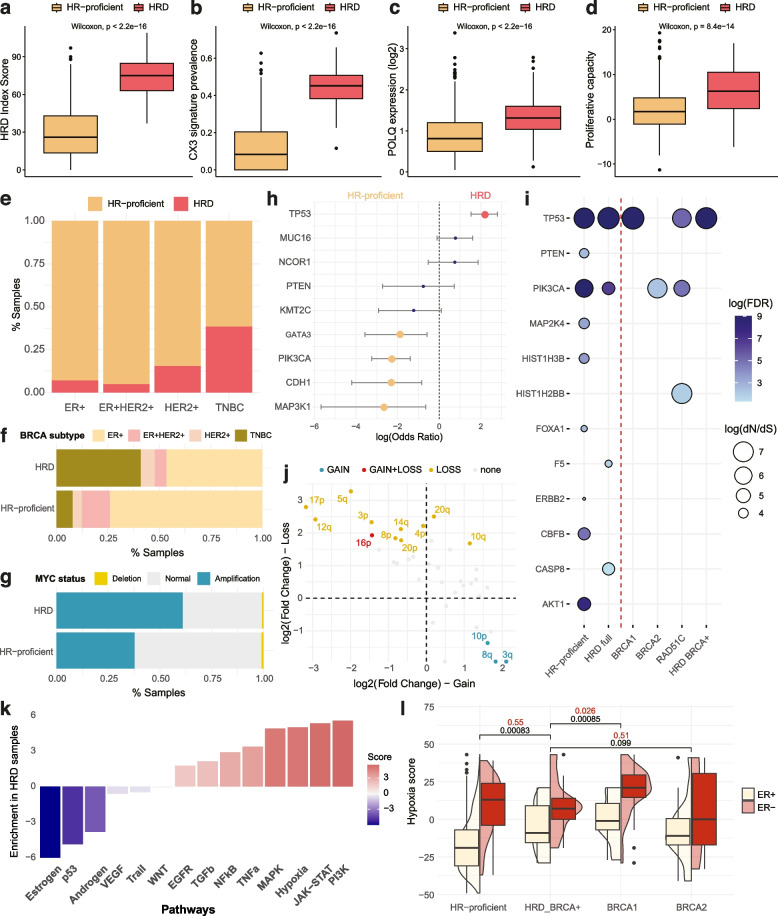
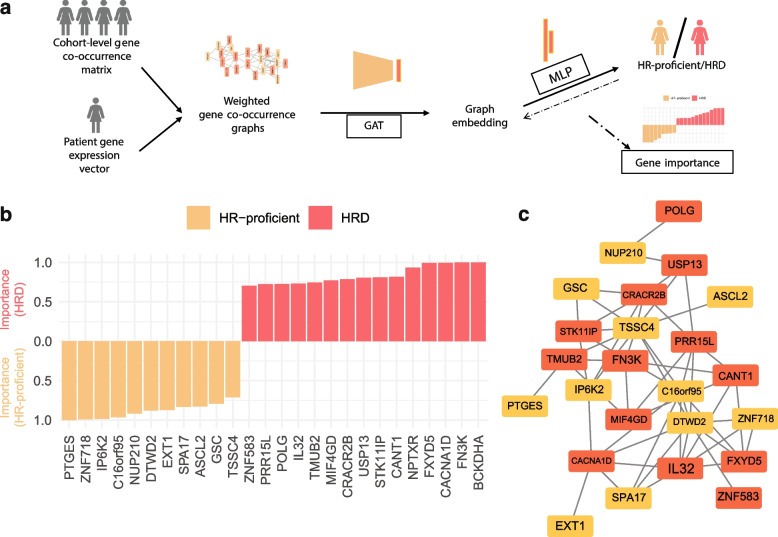
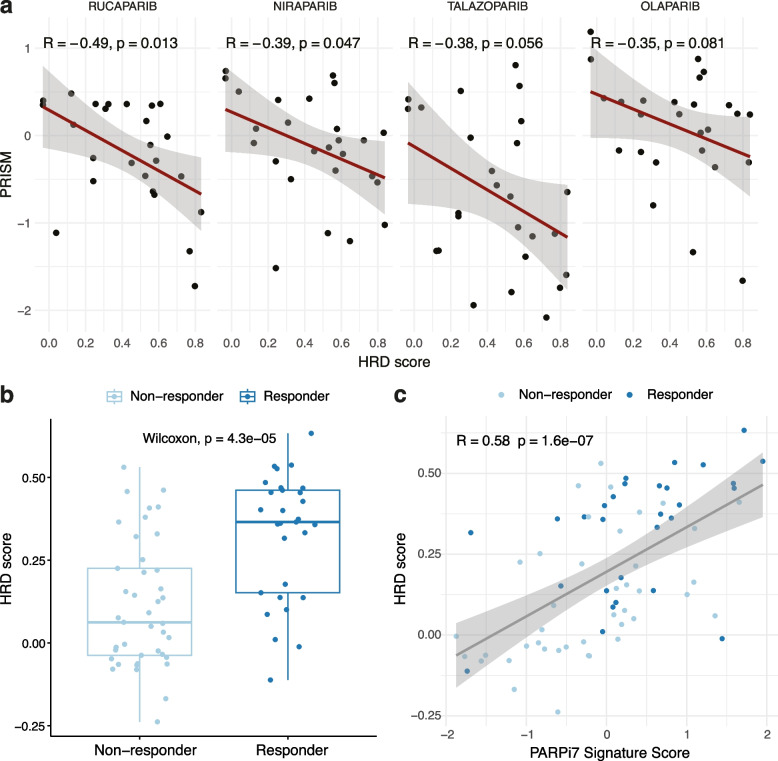
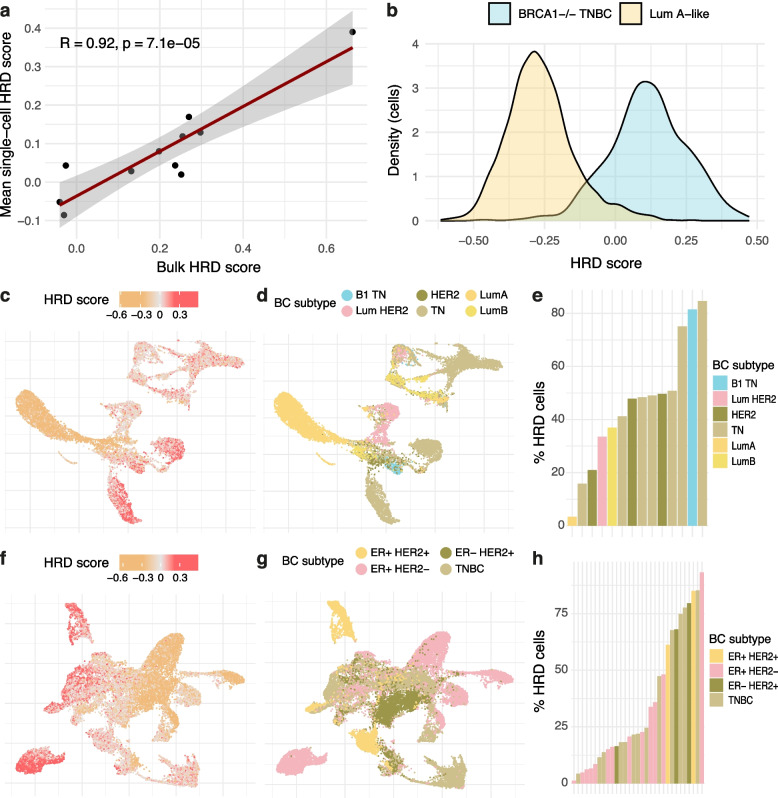
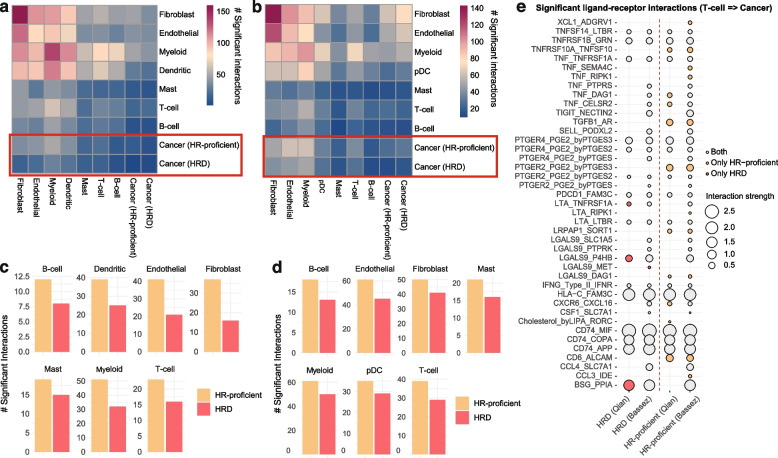
Results: We demonstrate that the inclusion of indel events, even at low levels, improves homologous recombination deficiency classification. Whilst BRCA-positive homologous recombination deficient samples display strong similarities to those harbouring BRCA1/2 defects, they appear to deviate in microenvironmental features such as hypoxic signalling. We then present a 228-gene transcriptional signature which simultaneously characterises homologous recombination deficiency and BRCA1/2-defect status, and is associated with PARP inhibitor response. Finally, we show that this signature is applicable to single-cell transcriptomics data and predict that these cells present a distinct milieu of interactions with their microenvironment compared to their homologous recombination proficient counterparts, typified by a decreased cancer cell response to TNFα signalling.

Conclusions: We apply multi-scale approaches to characterise homologous recombination deficiency in breast cancer through the development of mutational and transcriptional signatures. We demonstrate how indels can improve homologous recombination deficiency classification in exome-sequenced breast cancers. Additionally, we demonstrate the heterogeneity of homologous recombination deficiency, especially in relation to BRCA1/2-defect status, and show that indications of this feature can be captured at a single-cell level, enabling further investigations into interactions between DNA repair deficient cells and their tumour microenvironment.

Keywords: Breast cancer; Homologous recombination deficiency; Mutational signatures; PARP inhibition; Single cell; Transcriptional classifier; Tumour microenvironment.


Conflict of interest statement

The authors declare that they have no competing interests.

Figures

Fig. 1
Fig. 1
Evaluating HRD in exome-sequenced breast cancers. a Workflow for HRD classification of an exome-sequenced breast cancer sample. Each sample contains a profile of mutations, each of which has a probabilistic association with each of the 20 signature phenotypes, defined by a representative signature profile inferred from WGS data. The mutational profile is collated to calculate the probability of assignment of the respective sample to each of the 20 clusters. b Simulation analysis of SBS3-enrichment classification of ICGC samples downsampled to 50 mutational events constrained to varying indel proportions. Adding a small percentage of indels is sufficient to improve classification. AUC = area under the ROC curve for SBS3 enrichment classification. The dotted red line represents the mean proportion of indel events in the TCGA-BRCA cohort. c Classification of 968 exome-sequenced breast cancer samples from TCGA. The heat map indicates the probability of each sample (column) being assigned to each signature phenotype (rows). Samples are annotated by ER status and HR gene defects. The value p(HRD) is the sum of probabilities of assignment across the seven HRD-associated phenotypes. The label ‘Phenotype assigned’ refers to the phenotype to which the respective sample has the highest probability of assignment. d Summary of HRD cluster assignment probabilities across the TCGA-BRCA cohort. Samples with a total probability of HRD assignment greater than 0.79 (as shown by the dotted red line) would be assigned as HRD, whereas the rest would be deemed HR-proficient. e HRD classification of HR gene-defective and -positive samples in the TCGA-BRCA cohort. ‘HRD’ refers to samples with a probability of HRD assignment greater than 0.79. f F-score comparisons of HRD classifiers for exomes. ‘HRDi + ’ refers to the classifier developed in this study. The HRD index is presented using cutoffs of 42 and 63
Fig. 2
Fig. 2
Genomic and transcriptional hallmarks of HRD. Association between HRD status and a the Myriad HRD index score, b contribution of the CX3 copy number signature, c POLQ expression, and d a transcriptional measurement of proliferation/cell cycle arrest capacity. e Enrichment of HRD across breast cancer subtypes. f Enrichment of breast cancer subtypes across HRD status. g Association between HRD status and amplification of MYC. h Enrichment/depletion of somatic nonsynonymous mutations in key cancer genes in HRD and HR-proficient breast cancer samples. A positive log(odds ratio) indicates enrichment in HRD samples. i Positive selection of cancer genes in HR-proficient, all HRD, BRCA1-defective, BRCA2-defective, RAD51C-defective, and HRD BRCA + breast cancer samples. Circle size indicates the strength of positive selection according to the dN/dS ratio. j Comparison of chromosome arm loss and gain events between HRD and HR-proficient breast cancer samples. Positive values indicate enrichment in HRD against HR-proficient samples, whilst the x and y axes indicate enrichment for chromosome arm gains and losses respectively. k Results of differential pathway activity analysis between HRD and HR-proficient breast cancer samples across 14 signalling pathways ordered by the Normalised Enrichment Score (NES). Positive scores indicate pathway enrichment in HRD samples. l Comparison of hypoxia scores in the TCGA-BRCA cohort according to the Buffa transcriptional signature across HRD/BRCA-defect categories, split by ER status. P-values refer to Wilcoxon testing between each group and the HRD-BRCA + group, tested across all samples (black) and ER-negative samples only (red)
Fig. 3
Fig. 3
Development and validation of a BRCA-defect type-specific HRD transcriptional signature. a Workflow for transcriptional signature development. Data is split into training and testing cohorts. The training data undergoes expression deconvolution to extract a cancer cell-specific signal, using the Qian et al. single-cell RNA-seq cohort as a reference, and genes that are lowly expressed in this dataset are removed. Processed training data undergoes 1000 iterations of tenfold cross validation of elastic net regression, and a signature is formed from the 228 genes selected in every iteration. Centroid templates are formed for HRD/HR-proficient and BRCA-type HRD groups from the 228 genes across the training cohort, and scores for testing and validation cohorts are calculated by correlating the new sample against each template. b Summary of the 228-gene HRD transcriptional signature profiles across the TCGA training set. The HRD status assignment is annotated along with BRCA1/2 defects. c,d Comparison of HRD scores calculated using the transcriptional signature between c HRD vs HR-proficient and d HRD/BRCA-defect groups. e Comparison of HRD transcriptional signatures and gene expression markers for predicting HRD status in the TCGA testing set, measured by AUC. ‘Elastic net’ refers to the 228-gene transcriptional signature presented in this study. ‘Peng’, ‘CIN70’, ‘Severson’, and ‘PARPi7’ refer to alternative transcriptional signatures as described in the Methods. POLQ, BRCA1, PARP1, and BRCA2 are gene expression markers. f Comparison of HRD/BRCA-defect scores across HRD/BRCA-defect groups in the TCGA testing cohort. Each panel corresponds to a specific HRD/BRCA-defect signature, with the y-axis representing correlation with the respective centroid model. Each box refers to the samples within the respective group
Fig. 4
Fig. 4
Graph analysis to determine transcriptional signature drivers. a Workflow for graph attention network analysis to classify HRD/HR-proficient TCGA-BRCA patients and determine gene importance. Weighted gene co-expression graphs are built from the gene expression profiles of the TCGA-BRCA cohort, whilst taking into account the patient-level gene expression for the 228 genes in the transcriptional HRD signature. A graph attention network (GAT) is then trained to distinguish HRD and HR-proficient samples using the weighted co-expression graphs as inputs. The output highlights part of the graphs with greater weight in the classification and generates an importance score for each gene. b The top-ranked 26 genes in the HRD versus HR-proficiency classification with importance scores greater than 0.7. The colour indicates the phenotype (HRD/HR-proficient) for which the gene is predictive. c The co-expression graph of 24 of the 26 highly ranked genes for classification. Genes are connected only if they are co-expressed in the cohort, and genes with no connections have been removed. The colour of the nodes depicts the associated phenotype as in b
Fig. 5
Fig. 5
HRD transcriptional signature is linked with PARP inhibitor sensitivity in breast cancer cell lines and patients. a Correlation between the HRD transcriptional scores calculated using transcriptomes from breast cancer cell lines from CCLE and sensitivity to PARP inhibitors evaluated using the PRISM metric. b Comparison of HRD transcriptional scores between responders and non-responders to olaparib and durvalumab combination treatment in the I-SPY2 trial. c Correlation of HRD transcriptional scores against the PARPi7 signature score calculated by Pusztai et al. (38) in the I-SPY2 treatment arm patients. Responders are more frequently scoring high using our signature compared to PARPi7
Fig. 6
Fig. 6
Transcriptional profiling of HRD in single cell-sequenced breast cancer cells. a Correlation of mean HRD transcriptional score across individual cancer cells against matched bulk RNA sequencing from the Chung et al. cohort (47). b Distribution of HRD scores across tumour cells from a Stage III BRCA1-defective TNBC sample (sc5rJUQ033) and a Stage II Luminal A sample (sc5rJUQ064) from the Qian et al. cohort (48). c–e Profiling of HRD across tumour cells from the Qian et al. cohort as demonstrated by UMAP coordinates labelled by c HRD score and d breast cancer subtype. e The proportion of cells within each sample with HRD scores greater than zero in the Qian et al. cohort. The defined breast cancer subtypes include here are: ‘B1 TN’ = BRCA1-defective Triple negative, ‘Lum HER2’ = Luminal-HER2+ , ‘HER2’ = HER2 positive, ‘TN’ = Triple negative, ‘LumA’ = Luminal A-like, ‘LumB’ = Luminal B-like. f–h Profiling of HRD across tumour cells from the Bassez et al. cohort (49), similar to c–e
Fig. 7
Fig. 7
TME-cancer interactivity across HRD and HR-proficient cancer cells. a,b Number of significant ligand-receptor interactions established between cells in the a Qian et al. (48) and b Bassez et al. (49) cohorts according to CellphoneDB. Cancer cells are labelled as HRD if they have a positive HRD score, HR-proficient otherwise. The x-axis refers to cell types as sources, and the y-axis refers to cell types as targets. c,d The number of significant interactions between TME cell types as sources and cancer cells as targets, separated by HR status, across the c Qian et al. and d Bassez et al. cohorts. e Specific ligand-receptor interactions between T-cells and cancer cells, with cancer cells as the targets, across the Qian et al. and Bassez et al. cohorts. The red circles indicate interactions unique to HRD cells within a given cohort, and the yellow circles indicate interactions unique to HR-proficient cells within a given cohort. Grey circles represent common interactions

References

    1. Ciccia A, Elledge SJ. The DNA Damage Response: Making It Safe to Play with Knives. Molecular Cell. 2010;40:179–204. doi: 10.1016/j.molcel.2010.09.019. - DOI - PMC - PubMed
    1. Lord CJ, Ashworth A. The DNA damage response and cancer therapy. Nature. 2012;481:287–94. doi: 10.1038/nature10760. - DOI - PubMed
    1. Ceccaldi R, Liu JC, Amunugama R, Hajdu I, Primack B, Petalcorin MIR, et al. Homologous-recombination-deficient tumours are dependent on Polθ -mediated repair. Nature. 2015;518(7538):258–262. doi: 10.1038/nature14184. - DOI - PMC - PubMed
    1. O’Connor MJ. Targeting the DNA Damage Response in Cancer. Molecular Cell. 2015;60:547–60. doi: 10.1016/j.molcel.2015.10.040. - DOI - PubMed
    1. Fong PC, Boss DS, Yap TA, Tutt A, Wu P, Mergui-Roelvink M, et al. Inhibition of Poly(ADP-Ribose) Polymerase in Tumors from BRCA Mutation Carriers. N Engl J Med. 2009;361(2):123–134. doi: 10.1056/NEJMoa0900212. - DOI - PubMed

Publication types