Observational Study
. 2023 Nov 2;27(1):424.
doi: 10.1186/s13054-023-04716-y.

Diagnostic, prognostic and clinical value of left ventricular radial strain to identify paradoxical septal motion in ventilated patients with the acute respiratory distress syndrome: an observational prospective multicenter study

Affiliations
Observational Study

Diagnostic, prognostic and clinical value of left ventricular radial strain to identify paradoxical septal motion in ventilated patients with the acute respiratory distress syndrome: an observational prospective multicenter study

Bruno Evrard et al. Crit Care. .

Abstract

Background: Acute cor pulmonale (ACP) is prognostic in patients with acute respiratory distress syndrome (ARDS). Identification of paradoxical septal motion (PSM) using two-dimensional echocardiography is highly subjective. We sought to describe feature-engineered metrics derived from LV radial strain changes related to PSM in ARDS patients with ACP of various severity and to illustrate potential diagnostic and prognostic yield.

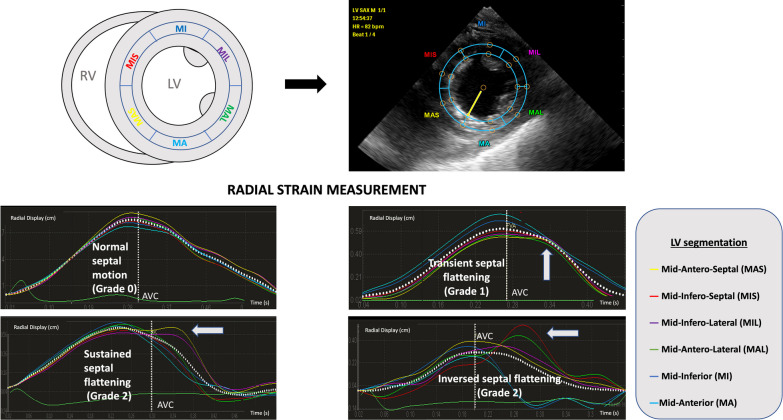
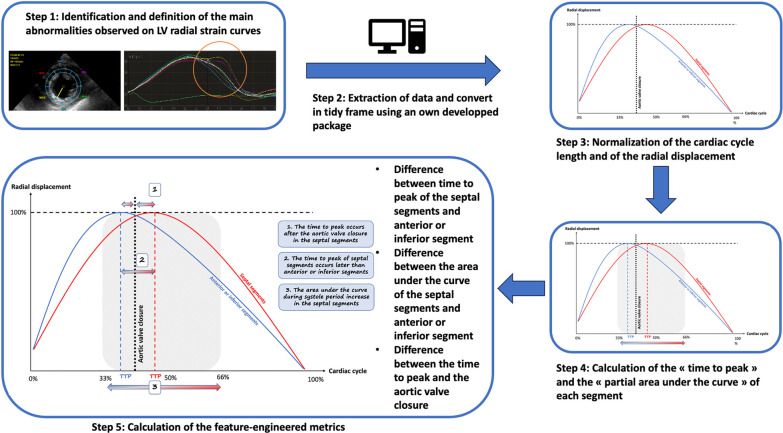
Methods: This prospective bicentric study included patients under protective ventilation for ARDS related to COVID-19 who were assessed using transesophageal echocardiography (TEE). Transgastric short-axis view at mid-papillary level was used to visually grade septal motion, using two-dimensional imaging, solely and combined with LV radial strain: normal (grade 0), transient end-systolic septal flattening (grade 1), prolonged end-systolic septal flattening or reversed septal curvature (grade 2). Inter-observer variability was calculated. Feature engineering was performed to calculate the time-to-peak and area under the strain curve in 6 LV segments. In the subset of patients with serial TEE examinations, a multivariate Cox model analysis accounting for new-onset of PSM as a time-dependent variable was used to identify parameters associated with ICU mortality.

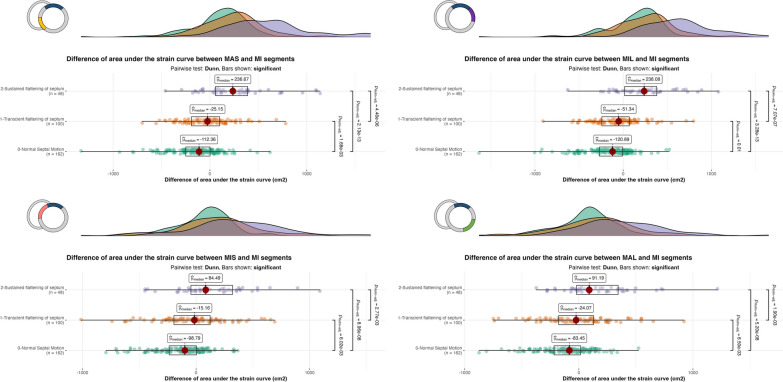
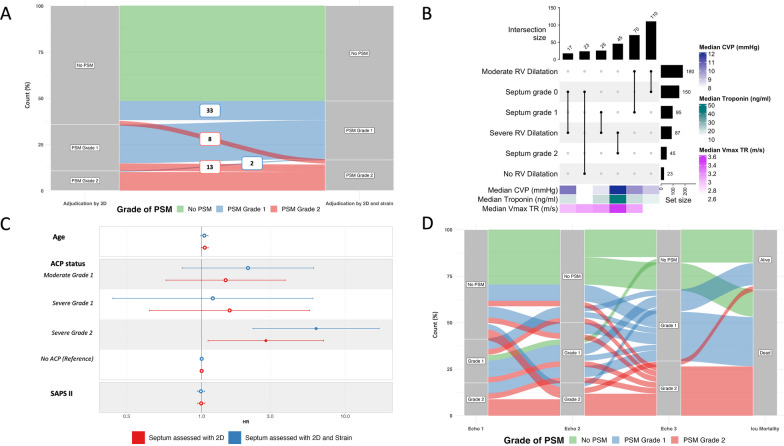
Results: Overall, 310 TEE examinations performed in 182 patients were analyzed (age: 67 [60-72] years; men: 66%; SAPSII: 35 [29-40]). Two-dimensional assessment identified a grade 1 and grade 2 PSM in 100 (32%) and 48 (15%) examinations, respectively. Inter-rater reliability was weak using two-dimensional imaging alone (kappa = 0.49; 95% CI 0.40-0.58; p < 0.001) and increased with associated LV radial strain (kappa = 0.84, 95% CI 0.79-0.90, p < 0.001). The time-to-peak of mid-septal and mid-lateral segments occurred significantly later in systole and increased with the grade of PSM. Similarly, the area under the strain curve of these segments increased significantly with the grade of PSM, compared with mid-anterior or mid-inferior segments. Severe acute cor pulmonale with a grade 2 PSM was significantly associated with mortality. Requalification in an upper PSM grade using LV radial strain allowed to better identify patients at risk of death (HR: 6.27 [95% CI 2.28-17.2] vs. 2.80 [95% CI 1.11-7.09]).

Conclusions: In objectively depicting PSM and quantitatively assessing its severity, TEE LV radial strain appears as a valuable adjunct to conventional two-dimensional imaging.

Keywords: Critical care; Pulmonary heart disease; Respiratory distress syndrome; Transesophageal echocardiography.


Conflict of interest statement

The authors declare that they have no competing interests.

Figures

Fig. 1
Fig. 1
Schematic representation of left ventricular segmentation for strain analysis in the transgastric short-axis view of the heart at the mid-papillary level (upper left panel), with the overimposition of the segmental matrix on the frozen two-dimensional image (upper right panel). Each LV segment strain curve is color-encoded and the mean strain curve is displayed as a white dotted curve over-imposed on individual LV segment curves, with the time of aortic valve closure (AVC) indicated by the white vertical dotted line (lower panels). Illustrative examples of a normal septal pattern of contraction (grade 0, mid left panel) and of increasing severity of paradoxical septal motion, such as transient septal flattening (grade 1, mid right panel), sustained septal flattening (grade 2, lower left panel) or inversed septal bulging (grade 2, lower right panel) with abnormal left ventricular segmental strain curve patterns are shown (white arrows). In the presence of a normal septal motion, left ventricular segmental strain curves exhibited a uniform pattern consistent with a homogeneous regional contraction, and the peak of radial strain occurred before the aortic valve closure (mid left panel). In contrast, patients with acute cor pulmonale presented with abnormal left ventricular strain curve patterns (lower panels, white arrows). A change in the pattern of the mid-antero-septal (yellow) and/or mid-infero-septal (red) strain curves was observed: the peak was delayed (i.e., time-to-peak increased) and occurred typically after aortic valve closure. In addition, the amplitude of the delayed peak appeared related to the severity of the paradoxical septal motion when semi-quantitatively assessed using two-dimensional imaging (septal flattening vs inversed septal bulging, lower panels). Of note, the mid-infero-lateral (purple) and mid-antero-lateral (green) strain curves mirrored the abnormal pattern of left ventricular mid-antero-septal and mid-infero-septal myocardial segment, respectively (lower panels). AVC: aortic valve closure; LV: left ventricle; RV: right ventricle; MIS, mid-infero-septal segment; MAS, mid-antero-septal segment; MA; mid-anterior segment; MAL, mid-antero-lateral segment; MIL, mid-infero-lateral segment; MI, mid-inferior segment
Fig. 2
Fig. 2
Summary of the process for data engineering. A schematic representation of the quantitative parameters calculated from left ventricular segmental strain curves is provided in the lower left panel. Both the radial displacement and time have been normalized by the maximal displacement and the duration of cardiac cycle, respectively
Fig. 3
Fig. 3
Boxplots with density plots showing the difference of area under the strain curves between the MIS and MA segments between 33 and 66% of the cardiac cycle according to the grade of septal motion (grade 0: green; grade 1: orange; grade 2: purple). In each panel, a schematic representation of LV segmentation used for the comparisons is indicated upper left. When compared to the LV MI segment, both the MAS and MIS segments exhibited increased area under the strain curve, according to the severity of paradoxical septal motion. The MIL and MAL strain curves mirrored the abnormal pattern of LV MAS and MIS segmental strain curve, respectively. P value is provided only when significant and adjusted with Benjamini–Hochberg method to take account of the multiplicity of test. LV: left ventricular; MAS: Mid-anteroseptal; MIL: Mid-inferolateral; MA: Mid-anterior; MIS: Mid-infero-septal; MAL: Mid-anterolateral; MI: Mid-inferior
Fig. 4
Fig. 4
A. Alluvial plot depicting the variation of classification for the grade of paradoxical septal motion according to the visual diagnostic approach used (isolated conventional two-dimensional imaging vs. additional left ventricular radial strain; n = 310). Number in boxes correspond to the number of patients who transitioned from grade 0 or 2 to a grade 1 paradoxical septal motion (in blue) or from grade 0 or 1 to a grade 2 paradoxical septal motion (in red). B. Repartition of patients according to the severity of right ventricular dilatation and grade of paradoxical septal motion. Horizontal bars display the number of patients (total of 290 patients, 20 having missing values for RV dilatation assessment) with each of abnormal finding of interest, while the vertical bars depict the different combinations of RV dilatation and grade of septal motion (vertical lines connecting points). Heatmaps show median values of troponin, central venous pressure and maximal velocity of tricuspid regurgitation. C. Forrest plot comparing the multivariate time-dependent Cox model according to the diagnostic approach used (conventional two-dimensional assessment alone or in association with visual left ventricular radial strain interpretation). “Moderate” and “Severe” refer to the severity of right ventricular dilatation, whereas grade 1 or 2 refers to the degree of paradoxical septal motion. D. Alluvial plot obtained in a subset of patients (n = 36) who underwent a least three TEE assessments which allowed to determine the evolution of septal motion during ICU stay and outcome. PSM: paradoxical septal motion; 2D: two-dimensional imaging; TEE: transesophageal echocardiography; RV: right ventricle; CVP: central venous pressure; Vmax TR: maximal velocity of tricuspid regurgitation; ACP: acute cor pulmonale; SAPS II: simplified acute physiology score 2

Similar articles

Cited by

References

    1. Zapol WM, Jones R. Vascular components of ARDS. Clinical pulmonary hemodynamics and morphology. Am Rev Respir Dis. 1987;136:471–474. doi: 10.1164/ajrccm/136.2.471. - DOI - PubMed
    1. Jardin F, Dubourg O, Bourdarias JP. Echocardiographic pattern of acute cor pulmonale. Chest. 1997;111:209–217. doi: 10.1378/chest.111.1.209. - DOI - PubMed
    1. Mekontso Dessap A, Boissier F, Charron C, Bégot E, Repessé X, Legras A, et al. Acute cor pulmonale during protective ventilation for acute respiratory distress syndrome: prevalence, predictors, and clinical impact. Intensive Care Med. 2016;42:862–870. doi: 10.1007/s00134-015-4141-2. - DOI - PubMed
    1. Sato R, Dugar S, Cheungpasitporn W, Schleicher M, Collier P, Vallabhajosyula S, et al. The impact of right ventricular injury on the mortality in patients with acute respiratory distress syndrome: a systematic review and meta-analysis. Crit Care. 2021;25:172. doi: 10.1186/s13054-021-03591-9. - DOI - PMC - PubMed
    1. Evrard B, Goudelin M, Giraudeau B, François B, Vignon P. Right ventricular failure is strongly associated with mortality in patients with moderate-to-severe COVID-19-related ARDS and appears related to respiratory worsening. Intensive Care Med. 2022;48:765–767. doi: 10.1007/s00134-022-06730-0. - DOI - PMC - PubMed

Publication types