. 2023 Nov 2;11(1):174.
doi: 10.1186/s40478-023-01654-2.

MYC overexpression and SMARCA4 loss cooperate to drive medulloblastoma formation in mice

Affiliations

MYC overexpression and SMARCA4 loss cooperate to drive medulloblastoma formation in mice

Carolin Göbel et al. Acta Neuropathol Commun. .

Abstract

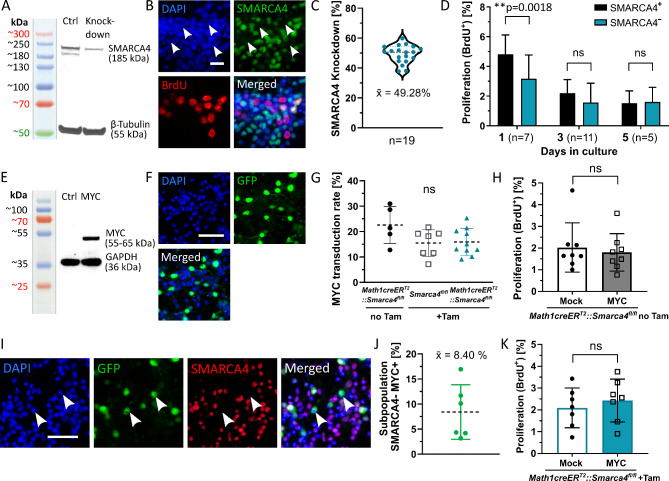
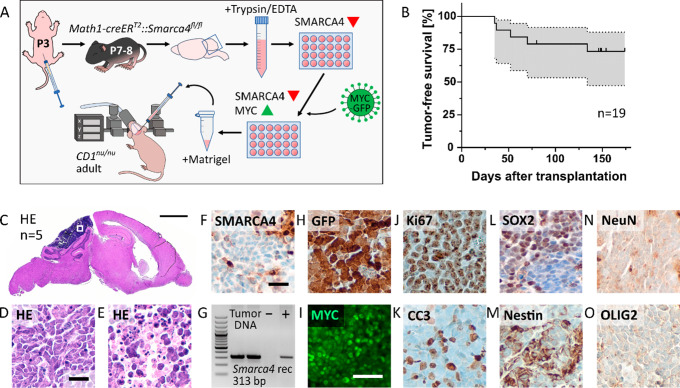
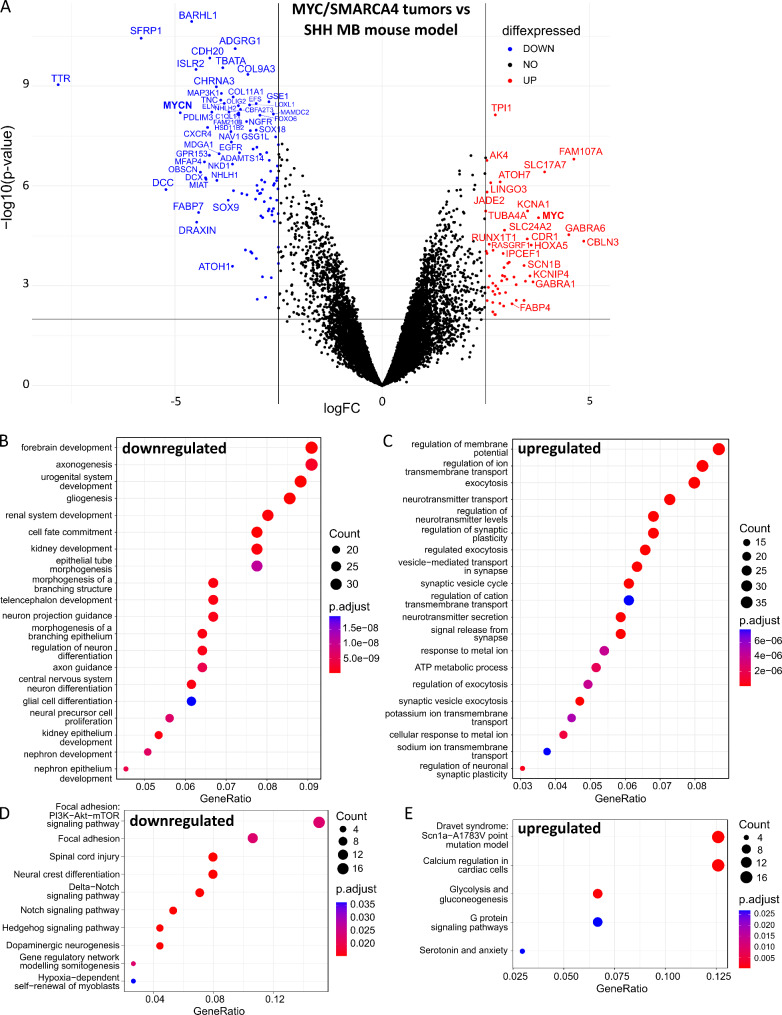
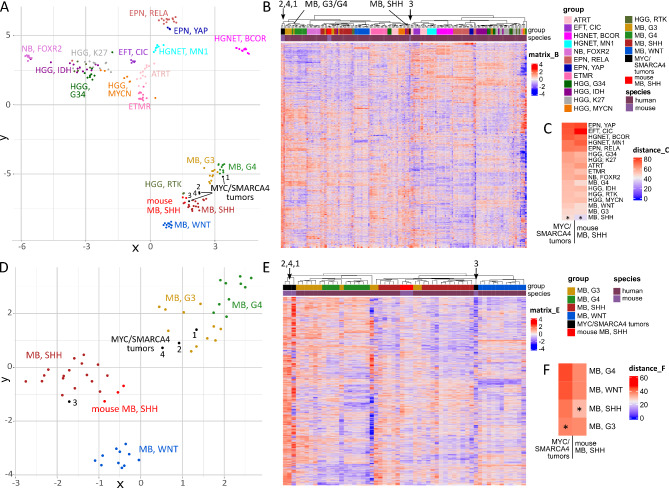
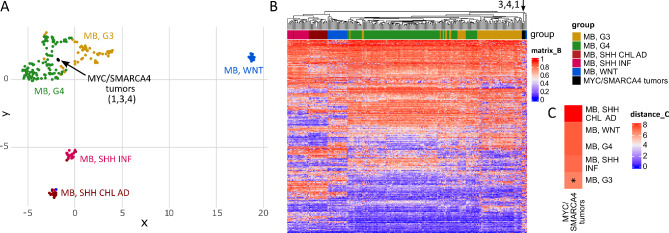
Group 3 medulloblastoma is one of the most aggressive types of childhood brain tumors. Roughly 30% of cases carry genetic alterations in MYC, SMARCA4, or both genes combined. While overexpression of MYC has previously been shown to drive medulloblastoma formation in mice, the functional significance of SMARCA4 mutations and their suitability as a therapeutic target remain largely unclear. To address this issue, we combined overexpression of MYC with a loss of SMARCA4 in granule cell precursors. Both alterations did not increase proliferation of granule cell precursors in vitro. However, combined MYC overexpression and SMARCA4 loss successfully induced tumor formation in vivo after orthotopic transplantation in recipient mice. Resulting tumors displayed anaplastic histology and exclusively consisted of SMARCA4-negative cells although a mixture of recombined and non-recombined cells was injected. These observations provide first evidence for a tumor-promoting role of a SMARCA4 deficiency in the development of medulloblastoma. In comparing the transcriptome of tumors to the cells of origin and an established Sonic Hedgehog medulloblastoma model, we gathered first hints on deregulated gene expression that could be specifically involved in SMARCA4/MYC driven tumorigenesis. Finally, an integration of RNA sequencing and DNA methylation data of murine tumors with human samples revealed a high resemblance to human Group 3 medulloblastoma on the molecular level. Altogether, the development of SMARCA4-deficient medulloblastomas in mice paves the way to deciphering the role of frequently occurring SMARCA4 alterations in Group 3 medulloblastoma with the perspective to explore targeted therapeutic options.

Keywords: BAF complex; BRG1; Chromatin remodeling; Group 3 medulloblastoma; MYC.


Conflict of interest statement

The authors declare that they have no competing interests.

Figures

Fig. 1
Fig. 1
Loss of SMARCA4 or MYC overexpression does not increase proliferation of GCPs in vitro. (A) Tamoxifen-induced knockdown of SMARCA4 is evident in Western Blot of P7/8 Math1creERT2::Smarca4fl/fl GCPs compared to controls (Smarca4fl/fl) after tamoxifen injection at P3. Two SMARCA4 bands are detected as seen in previously published studies [19, 46]. (B) IF staining of knockdown GCPs at day 3 in culture shows loss of SMARCA4 protein and proliferation indicated by BrdU incorporation. White arrowheads mark SMARCA4-negative areas. (C) Evaluation of SMARCA4 knockdown in IF on day 3 in culture of 19 independent GCP cultures. (D) Proliferation as measured by BrdU incorporation in IF on day 1, 3, and 5 in culture, separately counted for SMARCA4-positive and -negative GCPs in knockdown cultures. Two-tailed paired t-tests were applied. (E) MYC expression is evident in Western Blot of wild-type P7/8 GCPs 72 h after transduction. (F) IF staining shows GFP signal 72 h after transduction of GCPs. (G) MYC transduction rates were evaluated in IF stainings of GCPs 72 h after transduction. The three groups include GCPs without tamoxifen (Tam) induction and GCPs of cre-negative (Smarca4fl/fl) and cre-positive (Math1-creERT2::Smarca4fl/fl) genotype after tamoxifen induction at P3. Tukey’s multiple comparisons test was applied. (H) Overall proliferation as measured by BrdU incorporation in IF of Math1creERT2::Smarca4fl/fl GCPs without tamoxifen induction 72 h after transduction with Mock or MYC constructs. Paired two-tailed t-test was applied. (I, J) IF staining of tamoxifen-induced Math1creERT2::Smarca4fl/fl GCPs 72 h after transduction with MYC virus. The subpopulation with SMARCA4 protein loss and GFP signal (white arrowheads) constitutes around 8.4% of the whole cell culture. (K) Overall proliferation of tamoxifen-induced Math1creERT2::Smarca4fl/fl GCPs 72 h after transduction with Mock or MYC constructs. Paired two-tailed t-test was applied. Scale bar in B corresponds to 20 μm, scale bars in F + I correspond to 50 μm
Fig. 2
Fig. 2
Loss of SMARCA4 and MYC overexpression cooperate to drive brain tumor formation in vivo. (A) Schematic overview of the cell culture and transplantation protocol for the generation of SMARCA4-deficient MYC-overexpressing tumors. (B) Tumor-free survival of transplanted CD1nu/nu mice; grey area represents the 95% confidence interval. Censored mouse at day 80 had to be sacrificed due to illness unrelated to tumor development. (C) Representative HE staining of tumors in the brains of n = 5 transplanted mice in sagittal brain section. (D,E) High-power HE stainings of distinct areas within the tumors showing (D) anaplastic or (E) apoptotic features. (F) Tumors show complete loss of SMARCA4 in IHC interspersed with SMARCA4-positive blood vessels. (G) PCR using DNA isolated from tumor biopsies confirms Smarca4 recombination on a genetic level. (H-I) Tumors stain positive for (H) GFP and (I) MYC, confirming transduction with the MYC-GFP construct. (J) Tumors are highly proliferative as indicated by Ki67 stainings; (K) with a high degree of apoptosis according to Cleaved Caspase-3 (CC3) signals. (L-O) Tumors show scattered expression of (L) SOX2 and (M) Nestin but no signal for (N) NeuN or (O) OLIG2. Scale bar corresponds to 2 mm in C, to 25 μm in D + F (also applicable to E, H, J-O), and to 50 μm in I
Fig. 3
Fig. 3
Differential gene expression of MYC/SMARCA4 tumors compared to an established mouse SHH MB mouse model. (A) Volcano plot depicting differential gene expression between our MYC/SMARCA4 tumor model (n = 4) and the Math1-cre::Smofl/wt SHH MB mouse model (n = 3) as assessed by RNA sequencing analysis. Only genes orthologous in mice and humans were visualized, and differential expression with logFC ≥ 2.5 and p ≤ 0.01 was considered significant (blue/red coloring) after Benjamini-Hochberg correction. A detailed list of differentially expressed genes is included in Additional File 2, Table S2. (B,C) Gene set enrichment analysis was performed based on significantly differentially expressed genes considering all mouse genes with logFC ≥ 1.5 and p ≤ 0.01. (D,E) Deregulated wiki pathways considering differentially expressed genes across all mouse genes with logFC ≥ 1.5 and p ≤ 0.01
Fig. 4
Fig. 4
MYC/SMARCA4 tumors show similarities to Group 3 MB in gene expression analysis. (A) UMAP clustering of mouse tumors profiled by RNA sequencing and published expression data of pediatric brain tumors (Sturm et al. 2016 [61]). Out of the 14,151 orthologous genes identified between both datasets, the 6,000 most differentially expressed genes within the human dataset were used for clustering. Mouse SHH MB show resemblance to their human counterpart, whereas MYC/SMARCA4 tumors display similarity to both SHH MB and Group 3/4 MB. (B) Hierarchical clustering according to differentially expressed genes shows proximity of MYC/SMARCA4 tumors to the Group 3/4 MB cluster for three samples, whereas tumor 3 clusters with a subset of SHH MB (black arrows). (C) Distance plot shows closest resemblance of both mouse tumor models to SHH MB. Asterisks mark shortest distance. (D) UMAP clustering of mouse tumors and human MB subgroups only (Sturm et al. 2016) according to the 5,000 most differentially expressed genes within the human MB dataset out of 14,151 orthologous genes. MYC/SMARCA4 tumors appear closest to Group 3 MB. (E) Hierarchical clustering confirms proximity of MYC/SMARCA4 tumors to the Group 3/4 MB cluster with exception of tumor 3 (black arrows). (F) Distance plot shows closest resemblance of MYC/SMARCA4 tumors to Group 3 MB. EFT, CIC = Ewing sarcoma family tumor with CIC alteration; HGNET, BCOR = High-grade neuroepithelial tumor with BCOR alteration; NB, FOXR2 = Neuroblastoma with FOXR2 activation; EPN, RELA = Ependymoma with RELA fusion; EPN, YAP = Ependymoma with YAP fusion; ETMR = Embryonal tumor with multilayered rosettes; HGG, G34 = H3F3A G34 mutant high-grade glioma; HGG, IDH = IDH mutant high-grade glioma; HGG, K27 = H3F3A K27 mutant diffuse midline glioma; HGG, MYCN = MYCN-amplified high-grade glioma; HGG, RTK = IDH/H3F3A wild-type high-grade glioma of the receptor tyrosine kinase (RTK) subtype; MB, G3 = MB, Group 3; MB, G4 = MB, Group 4
Fig. 5
Fig. 5
MYC/SMARCA4 tumors show similarities to Group 3/4 MB in DNA methylation analysis. (A) UMAP clustering according to DNA methylation of mouse tumors (Mouse Methylation BeadChip) and human MB (Capper et al. 2018 [9], Sharma et al. 2019 [59], and in-house analyzed samples, n = 228) using 491 orthologous CpG sites out of the 15,000 most differentially methylated CpG sites within the human dataset. Mouse MYC/SMARCA4 tumors (n = 3) show most similarity to MB, Group 3/4. (B) Heatmap clustering according to DNA methylation of the same samples and CpG sites similarly shows proximity of the MYC/SMARCA4 tumors to MB, Group 3/4 (black arrow). (C) Distance Plot using the mean methylation values summarized for every subgroup shows lowest distance of MYC/SMARCA4 tumors to MB, Group 3. MB, G3 = MB, Group 3; MB, G4 = MB, Group 4; MB, SHH CHL AD = Medulloblastoma SHH-activated (children and adults); MB, SHH INF = Medulloblastoma SHH-activated (infants)

References

    1. Afgan E, Baker D, Batut B, van den Beek M, Bouvier D, Cech M, Chilton J, Clements D, Coraor N, Grüning BA. The Galaxy platform for accessible, reproducible and collaborative biomedical analyses: 2018 update. Nucleic Acids Res. 2018;46:537–544. doi: 10.1093/nar/gky379. - DOI - PMC - PubMed
    1. Alfert A, Moreno N, Kerl K. The BAF complex in development and disease. Epigenetics Chromatin. 2019;12:19. doi: 10.1186/s13072-019-0264-y. - DOI - PMC - PubMed
    1. Aryee MJ, Jaffe AE, Corrada-Bravo H, Ladd-Acosta C, Feinberg AP, Hansen KD, Irizarry RA. Minfi: a flexible and comprehensive Bioconductor package for the analysis of Infinium DNA methylation microarrays. Bioinformatics. 2014;30:1363–1369. doi: 10.1093/bioinformatics/btu049. - DOI - PMC - PubMed
    1. Ayrault O, Zhao H, Zindy F, Qu C, Sherr CJ, Roussel MF. Atoh1 inhibits neuronal differentiation and collaborates with Gli1 to generate medulloblastoma-initiating cells. Cancer Res. 2010;70:5618–5627. doi: 10.1158/0008-5472.Can-09-3740. - DOI - PMC - PubMed
    1. Ballabio C, Anderle M, Gianesello M, Lago C, Miele E, Cardano M, Aiello G, Piazza S, Caron D, Gianno Fet al et al. Modeling medulloblastoma in vivo and with human cerebellar organoids. Nat Commun. 2020;11:583. doi: 10.1038/s41467-019-13989-3. - DOI - PMC - PubMed

Publication types