. 2023 Oct 18:14:1270081.
doi: 10.3389/fimmu.2023.1270081. eCollection 2023.

The purinergic receptor P2X7 and the NLRP3 inflammasome are druggable host factors required for SARS-CoV-2 infection

Affiliations

The purinergic receptor P2X7 and the NLRP3 inflammasome are druggable host factors required for SARS-CoV-2 infection

Déborah Lécuyer et al. Front Immunol. .

Abstract

Purinergic receptors and NOD-like receptor protein 3 (NLRP3) inflammasome regulate inflammation and viral infection, but their effects on severe acute respiratory syndrome coronavirus 2 (SARS-CoV-2) infection remain poorly understood. Here, we report that the purinergic receptor P2X7 and NLRP3 inflammasome are cellular host factors required for SARS-CoV-2 infection. Lung autopsies from patients with severe coronavirus disease 2019 (COVID-19) reveal that NLRP3 expression is increased in host cellular targets of SARS-CoV-2 including alveolar macrophages, type II pneumocytes and syncytia arising from the fusion of infected macrophages, thus suggesting a potential role of NLRP3 and associated signaling pathways to both inflammation and viral replication. In vitro studies demonstrate that NLRP3-dependent inflammasome activation is detected upon macrophage abortive infection. More importantly, a weak activation of NLRP3 inflammasome is also detected during the early steps of SARS-CoV-2 infection of epithelial cells and promotes the viral replication in these cells. Interestingly, the purinergic receptor P2X7, which is known to control NLRP3 inflammasome activation, also favors the replication of D614G and alpha SARS-CoV-2 variants. Altogether, our results reveal an unexpected relationship between the purinergic receptor P2X7, the NLRP3 inflammasome and the permissiveness to SARS-CoV-2 infection that offers novel opportunities for COVID-19 treatment.

Keywords: COVID-19; NLRP3; P2X7; SARS-CoV-2; inflammasome.


Conflict of interest statement

DT and AA were employed by NH TherAguix SAS. Authors DL, DT, AA, FS, OD and J-LP are listed as co-inventors on a patent application related to SARS-CoV-2 therapy. AP and J-LP are founding members of Findimmune SAS, an Immuno-Oncology Biotech company. J-LP disclosed research funding not related to this work from NH TherAguix and Wonna Therapeutics. NC disclosed research funding not related to this work from GlaxoSmithKline, Roche, Cytune pharma and Sanofi. The remaining authors declare that the research was conducted in the absence of any commercial or financial relationships that could be construed as a potential conflict of interest. The author(s) declared that they were an editorial board member of Frontiers, at the time of submission. This had no impact on the peer review process and the final decision.

Figures

Figure 1
Figure 1
Pathological changes and NLRP3 expression in the lungs of COVID-19 patients with severe disease. (A) Parenchymal damage (with inflammation and fibrous proliferative phase) and hyperplasic amphophilic type II pneumocytes are detected in COVID-19 patients as compared to non-COVID-19 patients (insert). Hematoxylin and eosin staining is shown (bars, 22 µm and 50 µm). (B) NLRP3 expression is detected into alveolar septa and lumen in both COVID-19 and non-COVID-19 patients (bars, 45 µm and 50 µm). (C) Type II pneumocytes with cytoplasmic NLRP3 expression (bar, 3 µm). (D) NLRP3 positive alveolar macrophage in lumen (bar, 3 µm). (E-G) Syncytium detected on COVID-19 patients express macrophage marker CD68 (E) (bars, 8 µm and 3 µm), NLRP3 (F) (bars, 8 µm and 3 µm) and cytoplasmic double strand RNA, indicative of viral infection (G) (bars, 12 µm and 4 µm). Positive stainings (brown) for NLRP3, CD68 or double strand RNA are shown in (B-G). Magnifications are shown in (E-G) .
Figure 2
Figure 2
SARS-CoV-2 infection induces NLRP3 inflammasome activation independently of P2X7 in macrophages. (A-F) PMA-differentiated THP1 cells were infected with SARS-CoV-2 for 24 hours at indicated multiplicity of infection (MOI) (A) or during indicated hours post-infection (Hpi) (MOI = 0.2) (B) and evaluated for Spike (S), NLRP3 and β-actin expression (A, B) or IL-1β secretion (E, F). Representative images (C) and percentages (D) of control or PMA-differentiated THP1 cells infected for 24 hours (MOI = 0.2), with ASC speck formation (ASC+) are shown. Arrow indicates ASC+ speck. DNA is detected using Hoechst 33342 (bar, 10 µm). (G-J) PMA-differentiated THP1 cells that were incubated with the NLRP3 inflammasome inhibitor, MCC950 (20 µM) (G, I), and PMA-differentiated, control (CrCo.) or NLRP3-depleted (CrNLRP3) THP1 cells (H, J) were infected with SARS-CoV-2 for 24 hours (MOI = 0.2) and evaluated for NLRP3 and β-actin expression (G, H) or IL-1β secretion (I, J). (K, L) PMA-differentiated THP1 cells were infected with SARS-CoV-2 (MOI = 0.2) for 24 hours, in presence of control vehicle, the P2X7 inhibitor OxATP, or the P2X7 activator BzATP, and evaluated for NLRP3 and β-actin expression (K) or IL-1β secretion (L). In (A), the asterisk (*) is indicating a non-specific band. Data are presented as means ± SEM from at least 3 independent experiments. p values (*p < 0.05, **p < 0.01, ***p < 0.001 and ****p < 0.0001) were determined using unpaired t-test (D) and one-way ANOVA Tukey’s multiple comparisons test (E, F, I, J, L).
Figure 3
Figure 3
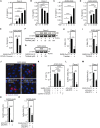
NLRP3 inflammasome activation dictates permissiveness of epithelial cells to SARS-CoV-2 infection. (A-D) Caco-2 (A, B) or ACE2-A549 (C, D) cells were infected with SARS-CoV-2 for 48 hours at indicated MOI (A, C) or during indicated hours post-infection (hpi) (MOI = 4) (B, D) and IL-1β secretion was monitored. E ACE2-A549 cells were infected during 48 hours with SARS-CoV-2 or with SARS-CoV-2 neutralized with convalescent COVID-19 patient serum. IL-1β secretion was then monitored. (F, G) Caco-2 (F) and ACE2-A549 (G) cells were infected (or not) with SARS-CoV-2 (MOI = 2) during 48 hours in presence of indicated concentrations of Tranilast and evaluated for Spike (S) and β-actin expressions. (H, I) Caco-2 (H) or ACE2-A549 (I) cells were infected for 48 hours with SARS-CoV-2 (MOI = 0.2) in presence of 100 µM Tranilast, and analyzed for SARS-CoV-2 E RNA expression using quantitative RT-PCR. Fold changes (FC) are indicated. (J, K) ACE2-A549 cells were infected for 48 hours with SARS-CoV-2 (MOI = 2) in presence of 20 µM MCC950, 100 µM Tranilast or with SARS-CoV-2 neutralized with convalescent COVID-19 patient serum and analyzed for spike (S) expression by fluorescence microscopy. Representative images (bar, 20 µm) (J) and percentages of spike (S)-positive (S+) cells (K) are shown. DNA is detected using Hoechst 33342. (L-O) Caco-2 (L, M) or ACE2-A549 (N, O) cells were subjected to siRNA against NLRP3 for 48 hours and analyzed for NLRP3 mRNA expression (L, N) or infected with SARS-CoV-2 for 48 hours and evaluated for SARS-CoV-2 RdRp RNA expression, by quantitative RT-PCR (M, O). RT-PCR samples were first normalized by β-actin mRNA level in each sample, and then normalized to the control condition. The data are presented as means ± SEM from at least 3 independent experiments. p values (*p < 0.05, **p < 0.01, ***p < 0.001 and ****p < 0.0001) were determined using one-way ANOVA Tukey’s multiple comparisons test (A-E, K) and unpaired t-test (H, I, L-O).
Figure 4
Figure 4
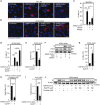
Caspase-1 activity regulates SARS-CoV-2 replication. (A-D) Caco-2 (A, C) or ACE2-A549 (B, D) were infected with SARS-CoV-2 (MOI = 2) in presence of 50 µM of caspase-1 inhibitor, Ac-YVAD-cmk (YVAD), for 48 hours and analyzed for spike (S) expression by fluorescence microscopy. Representative images (bar, 20 µm) (A, B) and percentages of spike (S)-positive (S+) cells (C, D) are shown. DNA is detected using Hoechst 33342. (E-H) Caco-2 (E, F) and ACE2-A549 (G, H) were treated with siRNA against caspase-1 (CASP-1) for 48 hours and analyzed for CASP-1 mRNA quantification by RT-PCR (E, G), or infected with SARS-CoV-2 at MOI = 0.2 (F) or MOI = 2 (H) during 48 hours, and analyzed for SARS-CoV-2 RdRp RNA expression by quantitative RT-PCR (F) or for spike (S) and β-actin expressions (H). The data are presented as means ± SEM from at least 3 independent experiments. p values (*p < 0.05, **p < 0.01, ***p < 0.001 and ****p < 0.0001) were determined using one-way ANOVA Tukey’s multiple comparisons test (C, D) and unpaired t-test (E-G).
Figure 5
Figure 5
Purinergic receptor P2X7 modulates SARS-CoV-2 replication through NLRP3 inflammasome activation. (A-D) Vero E6 (A, C) or ACE2-A549 (B, D) cells were infected with SARS-CoV-2 at MOI = 0.1 for 24 hours (A, C) or at MOI = 2 for 48 hours (B, D), with 10 µM OxATP and 50 µM PPADS (A, C) or with 100 µM OxATP and 100 µM BzATP (B, D) and analyzed for spike (S) expression by fluorescence microscopy. Representative images (bar, 20 µm) (A, B) and percentages of spike (S)-positive (S+) cells (C, D) are shown. DNA is detected using Hoechst 33342. (E) ACE2-A549 cells were infected with SARS-CoV-2 (MOI = 0.2) for 48 hours in presence of 100 µM OxATP and analyzed for SARS-CoV-2 E RNA expression by quantitative RT-PCR. (F) ACE2-A549 cells were treated with siRNA against P2X7 for 48 hours and analyzed for spike (S), P2X7 and β-actin expression. (G) ACE2-A549 cells were infected with SARS-CoV-2 (MOI = 0.2) for 48 hours in presence of 100 µM BzATP and analyzed for SARS-CoV-2 E RNA expression by quantitative RT-PCR. (H) Primary salivary gland epithelial cells were infected with SARS-CoV-2 (MOI = 0.5) for 48 hours in presence of 100 µM OxATP and analyzed for SARS-CoV-2 RdRp RNA expression by quantitative RT-PCR. (I) Huh7 cells were infected with SARS-CoV-2 Alpha variant in presence of 100 µM OxATP for 48 hours. Then, the viral yielding was determined by detecting RdRp RNA expression by quantitative RT-PCR in the supernatant (SN) of control and SARS-CoV-2 Alpha variant infected Huh7 cells. Fold changes (FC) are indicated in (E, G-I). (J) ACE2-A549 cells were infected with SARS-CoV-2 during 48 hours (MOI = 2) in presence of control, 50 or 100 µM BzATP, 100 µM Tranilast, or the combination of either 50 µM BzATP and 100 µM Tranilast or 100 µM BzATP and 100 µM Tranilast, and analyzed for spike (S) and β-actin expression. All experiments are representative of at least 3 independent experiments. The data are presented as means ± SEM from at least 3 independent experiments. p values (*p < 0.05, **p < 0.01, ***p < 0.001 and ****p < 0.0001) were determined using one-way ANOVA Tukey’s multiple comparisons test (C, D) and unpaired t-test (E, G-I).
Figure 6
Figure 6
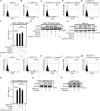
Purinergic receptor P2X7 and NLRP3 inflammasome control SARS-CoV-2 replication without affecting viral entry. (A-H) ACE2-TMPRSS2-A549 (A-G) or Vero E6 (H) cells were incubated during 4 hours with control (A, B), 100 µM OxATP (C), 100 µM BzATP (D), and infected for 48 hours (B-F) or 4 hours (G, H) with green fluorescent protein (GFP)-tagged HIV-1NL4-3 Δ Env variant (defective in viral envelope) pseudotyped with the SARS-CoV-2 spike (S) envelope (S-GFP-LV) or convalescent COVID-19 serum neutralized S-GFP-LV (E-H), and analyzed for GFP fluorescence by flow cytometry (A-F) or for intracellular HIV-1 CAp24 capsid and β-actin expression (G, H). Representative flow cytometry analysis (A-E) and percentages of GFP+ cells (F) are shown. I-P ACE2-TMPRSS2-A549 (I-O) or ACE2-A549 (P) cells were incubated during 4 hours with control (I, J), 100 µM Tranilast (K) or 100 µM YVAD (L) and infected for 48 hours (J-L) or 4 hours (O, P) with S-GFP-LV (J-L, N-P) or with convalescent COVID-19 serum neutralized S-GFP-LV (M, N). Then, cells were analyzed for GFP fluorescence by flow cytometry (I-N) or for intracellular HIV-1 CAp24 capsid and β-actin expression (O, P). Representative flow cytometry analysis (I-M) and percentages of GFP+ cells (N) are shown. In (P), the asterisk (*) is indicating a non-specific band. The data are presented as means ± SEM from at least 3 independent experiments. p values (****p < 0.0001) were determined using one-way ANOVA Tukey’s multiple comparisons test (F, N).

References

    1. Baden LR, El Sahly HM, Essink B, Kotloff K, Frey S, Novak R, et al. Efficacy and safety of the mRNA-1273 SARS-CoV-2 vaccine. N Engl J Med (2021) 384(5):403–16. doi: 10.1056/NEJMoa2035389 - DOI - PMC - PubMed
    1. Polack FP, Thomas SJ, Kitchin N, Absalon J, Gurtman A, Lockhart S, et al. Safety and efficacy of the BNT162b2 mRNA covid-19 vaccine. N Engl J Med (2020) 383(27):2603–15. doi: 10.1056/NEJMoa2034577 - DOI - PMC - PubMed
    1. Sadoff J, Gray G, Vandebosch A, Cardenas V, Shukarev G, Grinsztejn B, et al. Safety and efficacy of single-dose ad26.COV2.S vaccine against covid-19. N Engl J Med (2021) 384(23):2187–201. doi: 10.1056/NEJMoa2101544 - DOI - PMC - PubMed
    1. Chen P, Nirula A, Heller B, Gottlieb RL, Boscia J, Morris J, et al. SARS-coV-2 neutralizing antibody LY-coV555 in outpatients with covid-19. N Engl J Med (2021) 384(3):229–37. doi: 10.1056/NEJMoa2029849 - DOI - PMC - PubMed
    1. Gupta A, Gonzalez-Rojas Y, Juarez E, Crespo Casal M, Moya J, Falci DR, et al. Early treatment for covid-19 with SARS-coV-2 neutralizing antibody sotrovimab. N Engl J Med (2021) 385(21):1941–50. doi: 10.1056/NEJMoa2107934 - DOI - PubMed

Publication types

Supplementary concepts