. 2023 Nov 1;13(11):e10670.
doi: 10.1002/ece3.10670. eCollection 2023 Nov.

Calm after the storm? Similar patterns of genetic variation in a riverine foundation species before and after severe disturbance

Affiliations

Calm after the storm? Similar patterns of genetic variation in a riverine foundation species before and after severe disturbance

Magdalene N Ngeve et al. Ecol Evol. .

Abstract

In summer 2011, Tropical storms Lee and Irene caused an estimated 90% decline of the submersed aquatic plant Vallisneria americana Michx. (Hydrocharitaceae) in the Hudson River of New York (USA). To understand the genetic impact of such large-scale demographic losses, we compared diversity at 10 microsatellite loci in 135 samples collected from five sites just before the storms with 239 shoots collected from nine sites 4 years after. Although 80% of beds sampled in 2011 lacked V. americana in 2015, we found similar genotypic and genetic diversity and effective population sizes in pre-storm versus post-storm sites. These similarities suggest that despite local extirpations concentrated at the upstream end of the sampling area, V. americana was regionally resistant to genetic losses. Similar geographically based structure among sites in both sampling periods suggested that cryptic local refugia at previously occupied sites facilitated re-expansion after the storms. However, this apparent resistance to disturbance may lead to a false sense of security. Low effective population sizes and high clonality in both time periods suggest that V. americana beds were already small and had high frequency of asexual reproduction before the storms. Dispersal was not sufficient to recolonize more isolated sites that had been extirpated. Chronic low diversity and reliance on asexual reproduction for persistence can be risky when more frequent and intense storms are paired with ongoing anthropogenic stressors. Monitoring genetic diversity along with extent and abundance of V. americana will give a more complete picture of long-term potential for resilience.

Keywords: conservation genetics; disturbance effects; ecological disturbance; genetic bottleneck; genotypic diversity; resilience; submersed aquatic vegetation.


Conflict of interest statement

The authors declare we have no competing interests.

Figures

FIGURE 1
FIGURE 1
(a) Locations of 14 sampled sites (abbreviations as in Table 1). The proportions of inferred clusters per site (Q‐values) from the program Structure (K = 2) are represented as pie charts at their respective locations. The structure of genetic variation in samples obtained before and after the storm aligned more with geographical location than with year of sample collection. (b) Dense bed of Vallisneria americana in the Hudson River with leaves laying at the water surface at low tide. (c) Female flowers laying among leaves below the water surface.
FIGURE 2
FIGURE 2
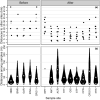
(a) Pairwise distance (km) through water from each site to all other sites sampled in the same time period (black dots) with the mean distance to all other sites (upward facing gray triangles). Within each time, period sites are ordered upstream to downstream. (b) Pairwise Euclidean distances (m) among all samples within sites. Sites are arranged from upstream to downstream within sample year. Upward facing triangles represent mean distances among all sample pairs within sites. Downward facing triangles represent mean distances between each sample and its closest neighbor sample.
FIGURE 3
FIGURE 3
Overall genotypic diversity (GD) for both time periods calculated using three indices: all multilocus genotypes (MLG's), effective Shannon's and effective Simpson's indices. Comparing the three measures shows that abundances of multilocus genotypes were uneven in both time periods and became slightly more uneven after the storms.
FIGURE 4
FIGURE 4
(a) Percent of multilocus genotypes at each site that were sampled once versus multiple times. (b) Number of stems for each multi‐stemmed individual. Open triangles indicate MLGs found in both time periods. (c) Distances between instances of the same MLG showing MLGs shared within and across time periods.
FIGURE 5
FIGURE 5
(a) Percent of MLGs with single versus multiple stems within sites. (b) Number of stems within each site for each multi‐stemmed individual. (c) Distances between instances of the same MLG, showing MLGs shared within and across sites and within and across time periods. Open triangles denote MLGs found in both time periods.
FIGURE 6
FIGURE 6
Allele accumulation curves for samples collected before versus after the storms generated using the rarefaction option in the specaccum function in the R package vegan. Error bars are ±2 SD based on 10,000 permutations. Numbers of samples were thinned to improve visualization. Every number of samples between 1 and 20 is shown; between 20 and the maximum number of samples for each year, only every fourth sample is shown.
FIGURE 7
FIGURE 7
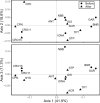
Principal coordinate analysis (PCoA) based on Nei's genetic distances among 13 Vallisneria americana sampling sites in the lower Hudson River Estuary. The first two axes accounted for 59.6% of explained variation (41.9% for the first axis and 18.6% for the second). The third axis accounted for an additional 11.3% of the explained variation, making a total cumulative percentage of explained variation of 71%. PCoA generally separated sites reflecting their geographical proximity rather than sampling year.

References

    1. Adamack, A. T. , & Gruber, B. (2014). PopGenReport: Simplifying basic population genetic analyses in R. Methods in Ecology and Evolution, 5, 384–387. 10.1111/2041-210X.12158 - DOI
    1. Alcoverro, T. , Manzanera, M. , & Romero, J. (2001). Annual metabolic carbon balance of the seagrass Posidonia oceanica: The importance of carbohydrate reserves. Marine Ecology Progress Series, 211, 105–116. 10.3354/meps211105 - DOI
    1. Alcoverro, T. , Zimmerman, R. C. , Kohrs, D. G. , & Alberte, R. S. (1999). Resource allocation and sucrose mobilization in light‐limited eelgrass Zostera marina . Marine Ecology Progress Series, 187, 121–131. 10.3354/meps187121 - DOI
    1. Amos, W. , & Balmford, A. (2001). When does conservation genetics matter? Heredity, 87, 257–265. 10.1046/j.1365-2540.2001.00940.x - DOI - PubMed
    1. Arnaud‐Haond, S. , Duarte, C. M. , Alberto, F. , & Serrão, E. A. (2007). Standardizing methods to address clonality in population studies. Molecular Ecology, 16, 5115–5139. 10.1111/j.1365-294X.2007.03535.x - DOI - PubMed

LinkOut - more resources