. 2023 Nov 15;136(22):jcs260989.
doi: 10.1242/jcs.260989. Epub 2023 Nov 30.

The antiproliferative effect of FGF2 in K-Ras-driven tumor cells involves modulation of rRNA and the nucleolus

Affiliations

The antiproliferative effect of FGF2 in K-Ras-driven tumor cells involves modulation of rRNA and the nucleolus

Francisca N de Luna Vitorino et al. J Cell Sci. .

Abstract

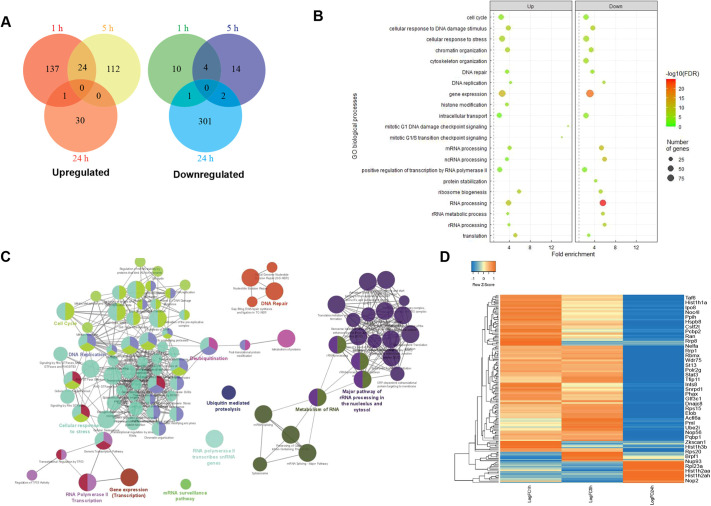
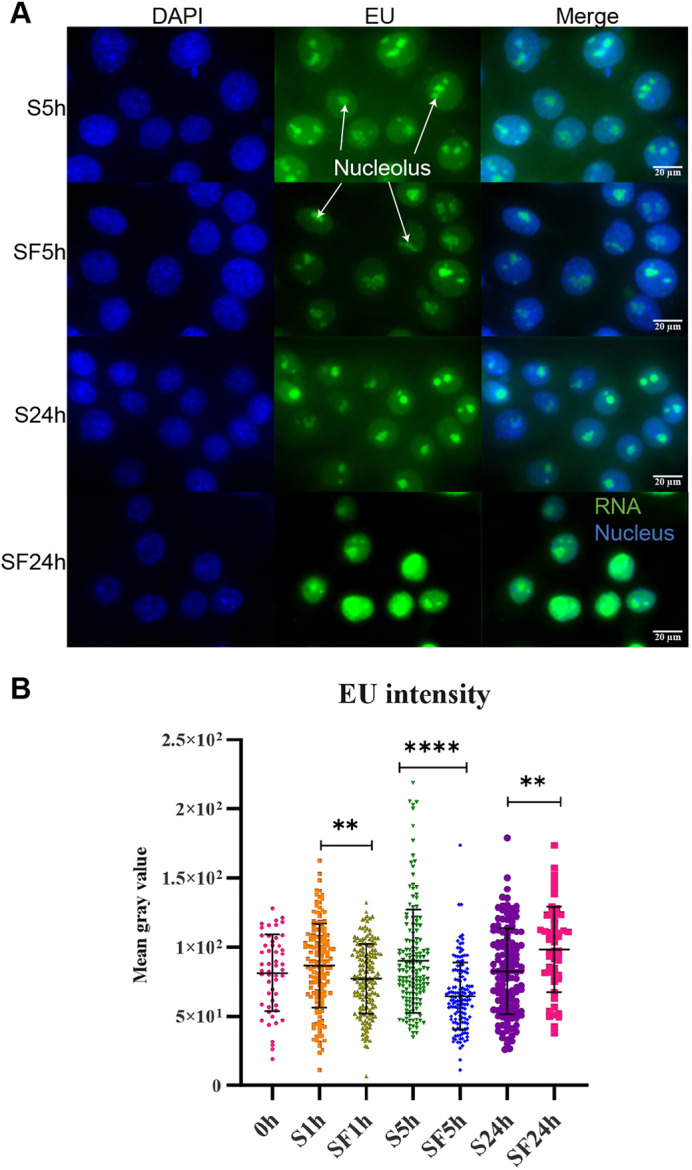
The nucleolus is sensitive to stress and can orchestrate a chain of cellular events in response to stress signals. Despite being a growth factor, FGF2 has antiproliferative and tumor-suppressive functions in some cellular contexts. In this work, we investigated how the antiproliferative effect of FGF2 modulates chromatin-, nucleolus- and rDNA-associated proteins. The chromatin and nucleolar proteome indicated that FGF2 stimulation modulates proteins related to transcription, rRNA expression and chromatin-remodeling proteins. The global transcriptional rate and nucleolus area increased along with nucleolar disorganization upon 24 h of FGF2 stimulation. FGF2 stimulation induced immature rRNA accumulation by increasing rRNA transcription. The rDNA-associated protein analysis reinforced that FGF2 stimulus interferes with transcription and rRNA processing. RNA Pol I inhibition partially reversed the growth arrest induced by FGF2, indicating that changes in rRNA expression might be crucial for triggering the antiproliferative effect. Taken together, we demonstrate that the antiproliferative FGF2 stimulus triggers significant transcriptional changes and modulates the main cell transcription site, the nucleolus.

Keywords: Chromatin; FGF2; Nucleolus; Proteomics; Transcription.


Conflict of interest statement

Competing interests The authors declare no competing or financial interests.

Figures

Fig. 1.
Fig. 1.
Effect of FGF2 stimulation on chromatin-associated proteins. (A) Statistical analysis of protein levels measured in FBS+FGF2 samples (SF 1 h, SF 5 h and SF 24 h) compared to FBS-only samples (S 1 h, S 5 h and S 24 h) identified 669 abundant proteins (636 non-redundant proteins) after FGF2 stimulation (FC≥±2, FDR≤0.05, unpaired two-tailed t-test, n=4 biological replicates). Most upregulated proteins were identified in the early incubation times (1 and 5 h), whereas most proteins were downregulated in the 24 h incubation period dataset. (B) Enrichment of GO terms for the up- and down-regulated proteins are represented in a bubble plot. (C) A functionally grouped network was generated with the statistically significant proteins using the ClueGO plugin (V2.5) for Cytoscape (V3.4.0). Each node represents a biological GO process, and the colors represent the GO groups. Twelve GO groups are present within the network. (D) Based on ClueGO classification (Cytoscape software), proteins related to transcription and rRNA processes were subjected to hierarchical clustering using log fold change (SF/S) values ​​for each time point (1, 5 and 24 h). See Fig. S1 and Table S1 for more details on this dataset.
Fig. 2.
Fig. 2.
Effect of FGF2 stimulation on global transcription levels. (A) EU incorporation of Y1 cells after FBS or FBS+FGF2 (FS) stimulation at the indicated times. The uridine analog was labeled with a fluorophore (Alexa Fluor 488) and analyzed by fluorescence microscopy. The green color corresponds to the RNA (EU) and the blue color to DNA (DAPI). The experiment was performed with three biological replicates. Scale bar: 20 µm. (B) Quantification of EU labeling was obtained using ImageJ (mean gray value) and analyzed using GraphPad Prisma v.5. Results show mean±s.e.m. (n=3). *P<0.05, **P<0.01, ****P<0.0001 (unpaired two-tailed t-test). See Fig. S1 for nucleus and nucleolus size measurements.
Fig. 3.
Fig. 3.
Effect of FGF2 stimulation on nucleolar proteins. (A) Statistical analysis of changes in protein levels measuring the 1, 5 and 24 h FGF2-treated datasets compared to FBS-only controls represented as volcano plots. Downregulated proteins are highlighted in green, and upregulated proteins are highlighted in red (unpaired two-tailed t-test, P≤0.05, n=4 biological replicates). (B) Bubble plot for the significantly enriched GO terms represented by modulated proteins at the time points. See Fig. S2 and Table S2 for more details on this dataset.
Fig. 4.
Fig. 4.
Effect of FGF2 stimulation on nucleolar organization. (A) Y1 cells were stimulated with FBS (S) or FBS+FGF2 (SF) for 24 h and subsequently labeled with anti-fibrillarin antibody (red) and DAPI (blue). The experiment was performed with three biological replicates. Scale bar: 20 µm. (B) Fibrillarin extranucleolar (mean gray value×area) and nuclear (mean gray value) intensity values were obtained by analysis of multiple images obtained at different time points of FBS or FBS+FGF2 treatment as described in A. Results show mean±s.e.m. (n=3). (C) Analysis of chromatin structure by transmission electron microscopy. Y1 cells were treated with FBS or FBS+FGF2 for different periods. FC, fibrillar center; DFC, dense fibrillar center; GC: granular center. Arrows indicate an increased area of the DFC after FGF2 stimulus. See Fig. S1G for additional cell line.
Fig. 5.
Fig. 5.
Effect of FGF2 stimulation on pre-rRNA transcripts. (A) Analysis of immature rRNA transcripts for no treatment (0 h), FBS+FGF2 samples (SF 1 h, SF 5 h and SF 24 h) and FBS-only samples (S 1 h, S 5 h and S 24 h) using probes targeting the 5′ETS region, which corresponds to the 47S rRNA, performed by northern blotting and quantified using ImageJ v1.52 software. Statistical analysis was performed with GraphPad Prisma v.5 software. Results show mean±s.e.m. (n=3). (B) RNA capture assay. The recently synthesized RNAs were incorporated with EU, extracted, biotinylated, captured and submitted to RT-qPCR analysis using primers for the pre-rRNA region (47S). The results were analyzed using GraphPad Prisma v.5. Results show mean±s.e.m. (n=3). (C) Inhibition of RNA Pol I partially rescues cells from the antiproliferative effect caused by FGF2. Left panel: clonogenic assay images, cell colonies stained with crystal violet. Cells were stimulated with FBS or FBS+FGF2 for 1 h and 0.03 μg/ml actinomycin D or 0.2 µM CX5461 was added. Right panel: Quantification of the clonogenic assay images. Values of the FBS+FGF2/FBS ratios of the average of the total area occupied by colonies on plates were used. Results show mean±s.e.m. (n=3). See Fig. S3 for ribosome profile analysis and additional cell lines. *P<0.05; **P<0.01; ***P<0.001 (unpaired two-tailed t-test, n=3 biological replicates).
Fig. 6.
Fig. 6.
Effect of FGF2 stimulation on rDNA-associated proteins. (A) CLASP protocol. (1) Cells are treated with formaldehyde to cross-link proteins with DNA, lysed, and the DNA is fragmented. (2) The FLAG–dCas9+guide RNA complex was added to the extract, and the pulldown of the regions of interest was performed by adding the anti-FLAG antibody. (3) The extract enriched with the regions of interest can be treated with Proteinase K or nuclease to obtain DNA or proteins. (B) Design of guide RNAs. Regions targeted by the guide RNAs are highlighted with red arrows. Regions of the transcriptional block were chosen (18S and 28S). Figures created with BioRender.com. (C) Volcano plot highlighting statistically significant proteins after FGF2 stimulation for 24 h. Eight downregulated and 19 upregulated proteins were found after stimulation (FC≥±2, FDR≤0.05, unpaired two-tailed t-test, n=4 biological replicates). Orange arrows point to Nolc1 and Tcof1 proteins. See Fig. S4 and Table S3 for more details on this dataset.
Fig. 7.
Fig. 7.
Multilayered effects of FGF2 stimulation on Y1 cells. The FGF2 stimulation effects described previously and in this work. The left and right panels highlight the early (1 and 5 h) and late (24 h) effects of the FGF2 stimulus.

Similar articles

Cited by

References

    1. Ahmad, Y., Boisvert, F.-M., Gregor, P., Cobley, A. and Lamond, A. I. (2009). NOPdb: Nucleolar Proteome Database--2008 update. Nucleic Acids Res. 37, D181-D184. 10.1093/nar/gkn804 - DOI - PMC - PubMed
    1. Armistead, J., Hemming, R., Patel, N. and Triggs-Raine, B. (2014). Mutation of EMG1 causing Bowen-Conradi syndrome results in reduced cell proliferation rates concomitant with G2/M arrest and 18S rRNA processing delay. BBA Clin. 1, 33-43. 10.1016/j.bbacli.2014.05.002 - DOI - PMC - PubMed
    1. Basier, C. and Nurse, P. (2023). The cell cycle and cell size influence the rates of global cellular translation and transcription in fission yeast. EMBO J. 42, e113333. 10.15252/embj.2022113333 - DOI - PMC - PubMed
    1. Bindea, G., Mlecnik, B., Hackl, H., Charoentong, P., Tosolini, M., Kirilovsky, A., Fridman, W.-H., Pagès, F., Trajanoski, Z. and Galon, J. (2009). ClueGO: a Cytoscape plug-in to decipher functionally grouped gene ontology and pathway annotation networks. Bioinformatics (Oxford, England) 25, 1091-1093. 10.1093/bioinformatics/btp101 - DOI - PMC - PubMed
    1. Birch, J. L. and Zomerdijk, J. C. B. M. (2008). Structure and function of ribosomal RNA gene chromatin. Biochem. Soc. Trans. 36, 619-624. 10.1042/BST0360619 - DOI - PMC - PubMed

Publication types

MeSH terms

LinkOut - more resources