

A quantitative evaluation of aerosol generation during cardiopulmonary resuscitation
- PMID: 37921438
- PMCID: PMC10952244
- DOI: 10.1111/anae.16162
A quantitative evaluation of aerosol generation during cardiopulmonary resuscitation
Abstract
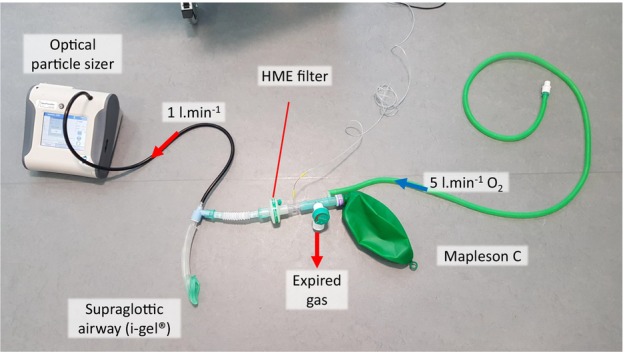
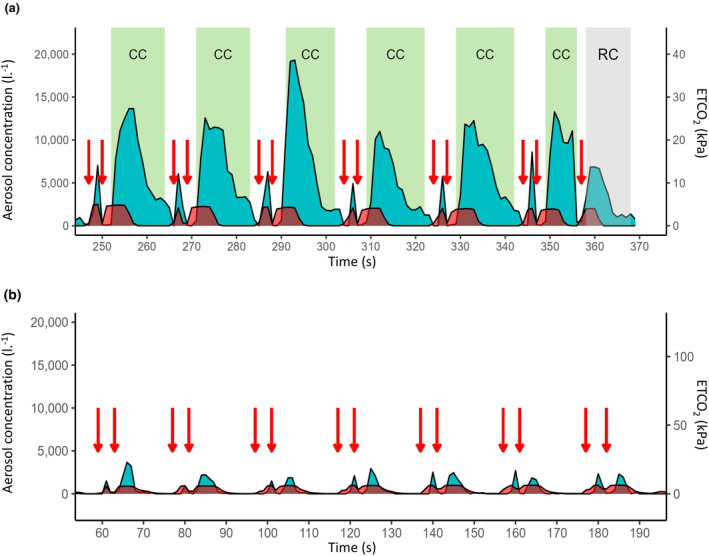
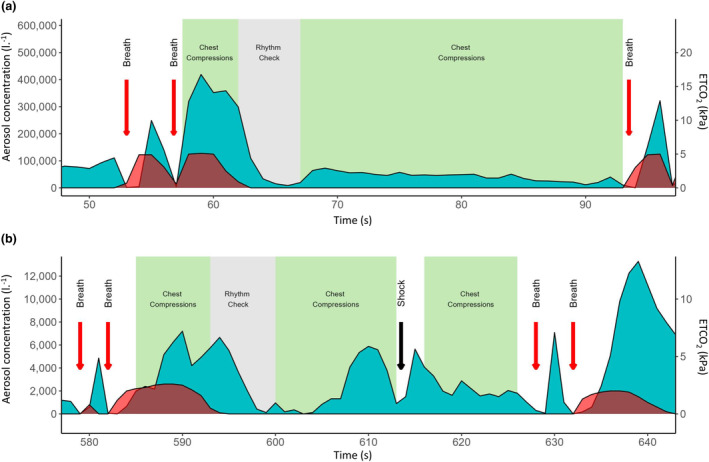
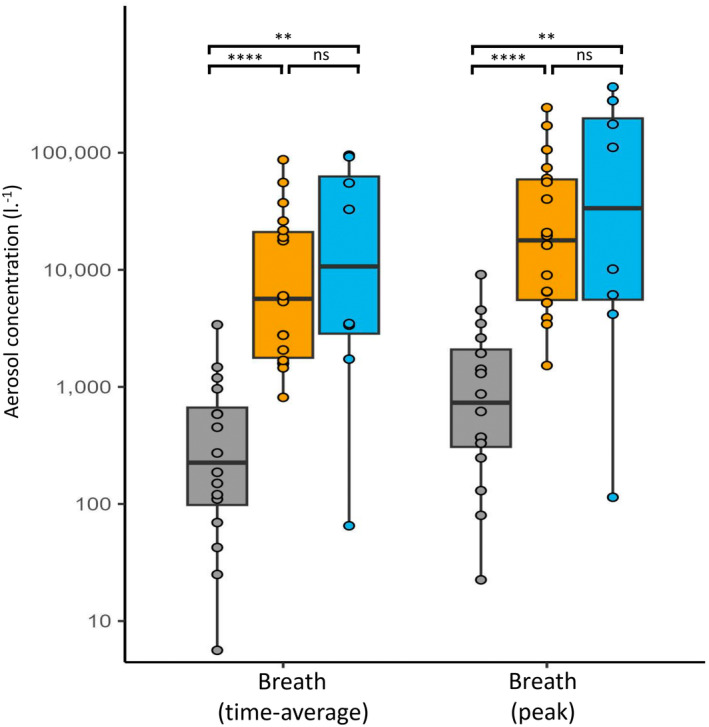
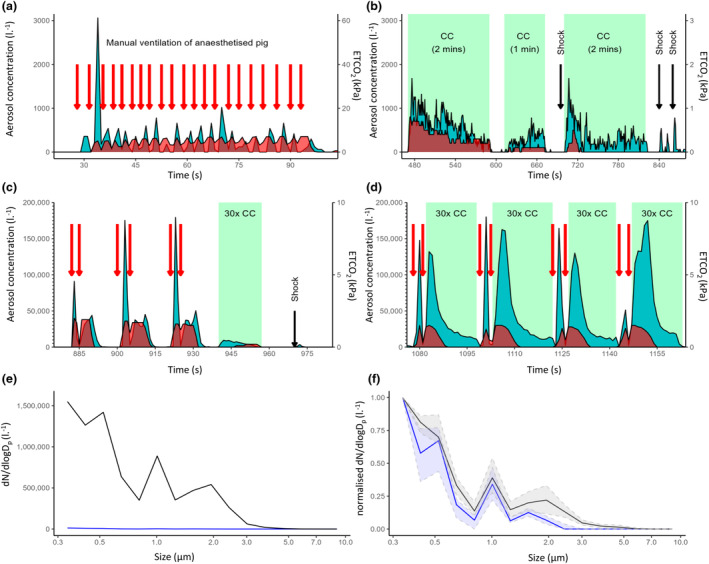
It is unclear if cardiopulmonary resuscitation is an aerosol-generating procedure and whether this poses a risk of airborne disease transmission to healthcare workers and bystanders. Use of airborne transmission precautions during cardiopulmonary resuscitation may confer rescuer protection but risks patient harm due to delays in commencing treatment. To quantify the risk of respiratory aerosol generation during cardiopulmonary resuscitation in humans, we conducted an aerosol monitoring study during out-of-hospital cardiac arrests. Exhaled aerosol was recorded using an optical particle sizer spectrometer connected to the breathing system. Aerosol produced during resuscitation was compared with that produced by control participants under general anaesthesia ventilated with an equivalent respiratory pattern to cardiopulmonary resuscitation. A porcine cardiac arrest model was used to determine the independent contributions of ventilatory breaths, chest compressions and external cardiac defibrillation to aerosol generation. Time-series analysis of participants with cardiac arrest (n = 18) demonstrated a repeating waveform of respiratory aerosol that mapped to specific components of resuscitation. Very high peak aerosol concentrations were generated during ventilation of participants with cardiac arrest with median (IQR [range]) 17,926 (5546-59,209 [1523-242,648]) particles.l-1 , which were 24-fold greater than in control participants under general anaesthesia (744 (309-2106 [23-9099]) particles.l-1 , p < 0.001, n = 16). A substantial rise in aerosol also occurred with cardiac defibrillation and chest compressions. In a complimentary porcine model of cardiac arrest, aerosol recordings showed a strikingly similar profile to the human data. Time-averaged aerosol concentrations during ventilation were approximately 270-fold higher than before cardiac arrest (19,410 (2307-41,017 [104-136,025]) vs. 72 (41-136 [23-268]) particles.l-1 , p = 0.008). The porcine model also confirmed that both defibrillation and chest compressions generate high concentrations of aerosol independent of, but synergistic with, ventilation. In conclusion, multiple components of cardiopulmonary resuscitation generate high concentrations of respiratory aerosol. We recommend that airborne transmission precautions are warranted in the setting of high-risk pathogens, until the airway is secured with an airway device and breathing system with a filter.
Keywords: CPR; aerosol-generating procedure; cardiopulmonary resuscitation; out-of-hospital cardiac arrest.
© 2023 The Authors. Anaesthesia published by John Wiley & Sons Ltd on behalf of Association of Anaesthetists.
Figures
Similar articles
-
Aerosol generation during chest compression and defibrillation in a swine cardiac arrest model.Resuscitation. 2021 Feb;159:28-34. doi: 10.1016/j.resuscitation.2020.12.004. Epub 2020 Dec 15. Resuscitation. 2021. PMID: 33338570 Free PMC article.
-
[Ventilation during cardiopulmonary resuscitation (CPR). A literature study and analysis of ventilation strategies].Anaesthesist. 1997 Feb;46(2):133-41. doi: 10.1007/s001010050383. Anaesthesist. 1997. PMID: 9133175 Review. German.
-
Do manual chest compressions provide substantial ventilation during prehospital cardiopulmonary resuscitation?Am J Emerg Med. 2021 Jan;39:129-131. doi: 10.1016/j.ajem.2020.09.037. Epub 2020 Sep 18. Am J Emerg Med. 2021. PMID: 33039236
-
Quantification of ventilation volumes produced by compressions during emergency department cardiopulmonary resuscitation.Am J Emerg Med. 2018 Sep;36(9):1640-1644. doi: 10.1016/j.ajem.2018.06.057. Epub 2018 Jun 30. Am J Emerg Med. 2018. PMID: 30017691
-
Adult Basic Life Support: 2020 International Consensus on Cardiopulmonary Resuscitation and Emergency Cardiovascular Care Science With Treatment Recommendations.Circulation. 2020 Oct 20;142(16_suppl_1):S41-S91. doi: 10.1161/CIR.0000000000000892. Epub 2020 Oct 21. Circulation. 2020. PMID: 33084391 Review.
Cited by
-
Enhancing Safety and Quality of Cardiopulmonary Resuscitation During Coronavirus Pandemic.J Clin Med. 2025 Jun 11;14(12):4145. doi: 10.3390/jcm14124145. J Clin Med. 2025. PMID: 40565889 Free PMC article. Review.
-
A Deep-Learning-Based CPR Action Standardization Method.Sensors (Basel). 2024 Jul 24;24(15):4813. doi: 10.3390/s24154813. Sensors (Basel). 2024. PMID: 39123860 Free PMC article.
References
-
- Resuscitation Council UK . Guidance: COVID‐19. 2022. https://www.resus.org.uk/library/additional‐guidance/guidance‐covid‐19 (accessed 04/08/2023).
MeSH terms
Grants and funding
LinkOut - more resources
Full Text Sources
Medical
