

Erythroid Differentiation Enhances RNA Mis-Splicing in SF3B1-Mutant Myelodysplastic Syndromes with Ring Sideroblasts
- PMID: 37921711
- PMCID: PMC10790130
- DOI: 10.1158/0008-5472.CAN-23-3038
Erythroid Differentiation Enhances RNA Mis-Splicing in SF3B1-Mutant Myelodysplastic Syndromes with Ring Sideroblasts
Abstract
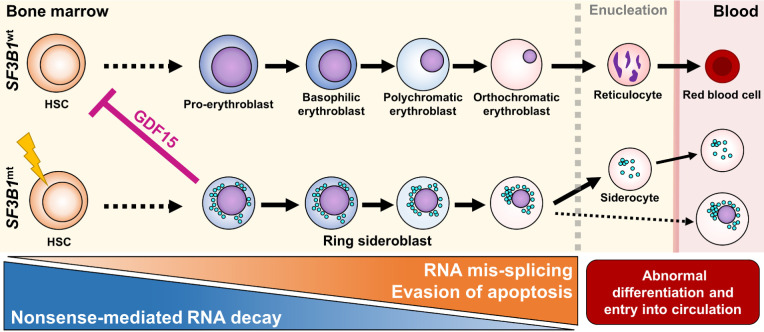
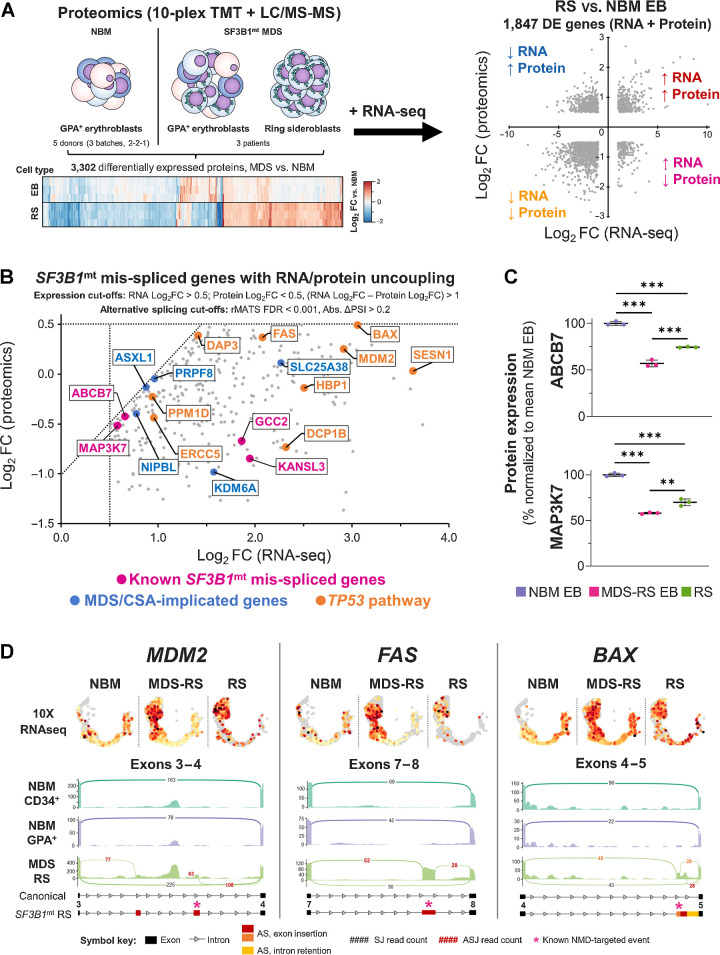
Myelodysplastic syndromes with ring sideroblasts (MDS-RS) commonly develop from hematopoietic stem cells (HSC) bearing mutations in the splicing factor SF3B1 (SF3B1mt). Direct studies into MDS-RS pathobiology have been limited by a lack of model systems that fully recapitulate erythroid biology and RS development and the inability to isolate viable human RS. Here, we combined successful direct RS isolation from patient samples, high-throughput multiomics analysis of cells encompassing the SF3B1mt stem-erythroid continuum, and functional assays to investigate the impact of SF3B1mt on erythropoiesis and RS accumulation. The isolated RS differentiated, egressed into the blood, escaped traditional nonsense-mediated decay (NMD) mechanisms, and leveraged stress-survival pathways that hinder wild-type hematopoiesis through pathogenic GDF15 overexpression. Importantly, RS constituted a contaminant of magnetically enriched CD34+ cells, skewing bulk transcriptomic data. Mis-splicing in SF3B1mt cells was intensified by erythroid differentiation through accelerated RNA splicing and decreased NMD activity, and SF3B1mt led to truncations in several MDS-implicated genes. Finally, RNA mis-splicing induced an uncoupling of RNA and protein expression, leading to critical abnormalities in proapoptotic p53 pathway genes. Overall, this characterization of erythropoiesis in SF3B1mt RS provides a resource for studying MDS-RS and uncovers insights into the unexpectedly active biology of the "dead-end" RS.
Significance: Ring sideroblast isolation combined with state-of-the-art multiomics identifies survival mechanisms underlying SF3B1-mutant erythropoiesis and establishes an active role for erythroid differentiation and ring sideroblasts themselves in SF3B1-mutant myelodysplastic syndrome pathogenesis.
©2023 The Authors; Published by the American Association for Cancer Research.
Figures
![Figure 1. Erythroid differentiation and enucleation remain active in SF3B1mt MDS-RS erythroblasts. A, Flow cytometry strategy for staging of erythroblast populations from BM MNC of patients with MDS-RS. Gating steps identify live and terminally differentiating erythroid cells (Lin−7AAD−GPA+), from which erythroblasts (EB) are staged according to Band 3 and integrin α4 expression (26). Integrin α4–negative cells are excluded from quantification to avoid skewing by anucleate cells. B, Mean (±SEM) cell population frequencies within flow cytometry parent populations (singlets > terminally differentiating erythroid > erythroblast subsets), quantified in NBM donors (nNBM = 4) and patients with MDS-RS (nMDS-RS = 6). Erythroid cells are quantified within the singlet population. Erythroblast subsets are quantified within the GPA+ population. C, Mean (±SEM) RS frequencies per sorted erythroblast subset and compared with frequencies in matched diagnostic BM smears (nMDS-RS = 6). D, Gating and quantification [mean (±SEM)] of DNA content (Draq-5) and intracellular Ki-67 abundance in GPA+ magnetically sorted cells (nNBM = 3; nMDS-RS = 6). E, Mean (±SEM) RS frequencies per sorted Ki67-expressing subset and compared with frequencies in matched diagnostic BM smears (nMDS-RS = 6). F, Mean (±SEM) CD71 (transferrin receptor, TFRC) median fluorescence indices per erythroblast subset (nNBM = 4; nMDS-RS = 6). G, Mean (±SEM) enucleation frequencies after 28-day 3D culture of MDS-RS BM MNCs (nMDS-RS = 4) and separated by iron granule visibility upon morphological analysis. Statistical comparison was performed by paired t test analysis. *, P < 0.05; **, P < 0.01; ***, P < 0.001; ns, nonstatistically significant.](https://cdn.ncbi.nlm.nih.gov/pmc/blobs/b1af/10790130/50d6076a9fe2/211fig1.jpg)
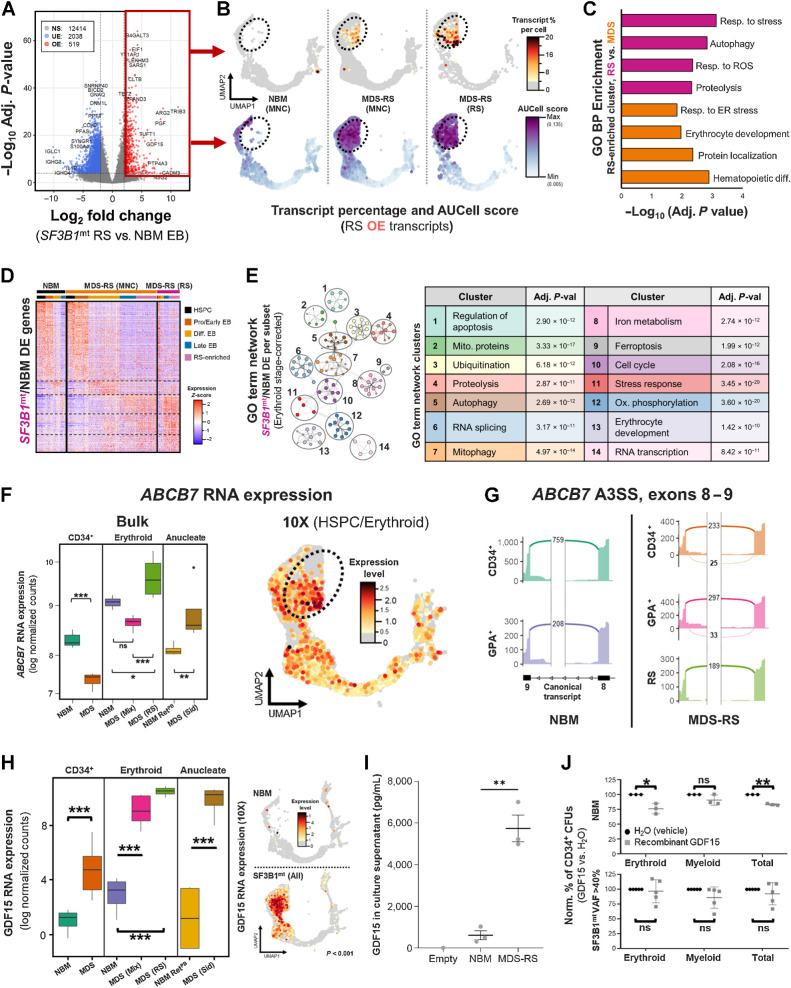
![Figure 4. SF3B1 mutations have limited impact on the gene expression of true MDS-RS HSPC. A, Principal component analysis (PCA) plots of a full-length bulk RNA-seq experiment encompassing sorted cell populations from NBM donors (nCD34 = 7, nGPA = 4, nRet = 4) and SF3B1mt MDS-RS patients (nCD34 = 6, nGPA = 5, nRS = 4, nSid = 4). Sample distribution along PC1 is visualized against PC2/PC3. B, Global overview of two integrated 10x Genomics scRNA-seq experiments encompassing sorted cell populations from NBM donors and SF3B1mt patients with MDS-RS (nNBM = 3, nMDS-RS = 5, nRS = 1). A UMAP-based bidimensional projection is displayed and separated per sample group, where each cell is visualized as one point. The dotted circle indicates the RS-enriched cell subset, which is absent in NBM. Cell types were annotated according to gene expression signatures per cluster set. Sample and cell type composition in the total dataset are shown below the UMAP plots. C, Volcano plot (left) displaying differentially expressed genes (DEG) in CD34+ MACS-enriched BM cells comparing SF3B1mt MDS-RS versus NBM. Cut-offs for significance were log2 FC > 0.5, adjusted P value <0.01. Genes were overexpressed (OE; red), underexpressed (UE; blue), or not significantly different (NS; gray). Gene set enrichment analysis (GSEA) of overexpressed genes (middle) was performed with the Enrichr Human Gene Atlas. The right UMAP heatmap displays expression of bulk OE genes in scRNA-seq. The dotted rectangle highlights the HSPC transcriptomic cluster. D, AUCell erythroid score [based on erythroid markers from An et al. (30)] mapped in the UMAP overlays and separated by mutational background. The erythroid score is similarly displayed in violin plots (gray, NBM; orange, SF3B1mt) and grouped per cell population (excluding cell subsets unrelated to erythroid development, e.g., macrophages). E, Representative CD34 and GPA FACS plots from CD34+ MACS-separated BM MNCs isolated from an patient with SF3B1mt MDS-RS and from a patient with non-SF3B1mt non-RS MDS. Lin−CD34−GPA+ cells are gated in blue and connected to representative micrographs. Scale bars, 10 μm. F, Mean (±SEM) percentage of Lin−CD34−GPA+ cells in CD34+-enriched cells (n = 3 per group). G, Mean (±SEM) cell frequencies based on morphologic analysis of Lin−CD34−GPA+ in MACS-purified CD34+ MDS-RS samples. H, UMAP projection of CD34 RNA-positive HSPCs in the scRNA-seq dataset. I, Mean (±SEM) frequencies of transcriptomically identifiable HSPC subsets as set out in H and compared between NBM and MDS-RS samples. J, Gene set enrichment analysis results for Gene Ontology biological process (GO BP) enrichment of differentially expressed genes identified in the HSPC cluster between MDS-RS and NBM cells (nNBM = 432, mean 144 cells/donor; nMDS-RS = 510, mean 102 cells/donor). ***, P < 0.001; ns, nonstatistically significant.](https://cdn.ncbi.nlm.nih.gov/pmc/blobs/b1af/10790130/d2740beaff97/211fig4.jpg)
![Figure 6. Distinct RNA dynamics in erythroid differentiation intensify SF3B1mt mis-splicing. A, Proportional Venn diagram of genes undergoing statistically significant AS [FDR < 0.001, absolute difference in percentage spliced in levels (Abs. ΔPSI) > 0.2] in the HSPC (green; MDS-RS CD34+ vs. NBM CD34+), nucleated erythroid [red; MDS-RS RS vs. NBM EB, Erythroid (N)] and anucleate erythroid [blue; MDS-RS Siderocytes vs. NBM RetPB, Erythroid (A)] populations. B, Gene Ontology biological process (GO BP) enrichment analysis results comprising genes mis-spliced in both the HSPC and erythroid (N) populations are shown in the top bar chart. The Human Gene Atlas enrichment results with the lowest adjusted P value are shown in the bottom table. C, Frequency of AS events split by rMATS category in each sample group comparison. SE, skipped exon; RI, retained intron; MXE, mutual exon exclusion; A5SS, alternative 5′ splice site; A3SS, alternative 3′ splice site. Statistical comparisons of A3SS+RI frequencies were performed with Fisher exact test. D, Box plots of percent spliced-in (PSI) values of literature-validated SF3B1mt-induced A3SS events in MDS-RS samples, separated by sample type (CD34, GPA, RS). Known targeting by NMD is indicated with a red circle; in-frame events without a PTC are indicated by a blue circle. E, Box plots of PSI values in newly identified ASEs affecting known driver genes implicated in the pathogenesis of MDS and CSA. Known targeting by NMD is indicated with a red circle; PTC detection with unverified NMD is indicated with an orange circle; in-frame events without a PTC are indicated by a blue circle. F, Distribution of base pair distances from cryptic A3SS sites to canonical splice sites (horizontal axis) in HSPC and Erythroid (N). Further detail is provided in −400 bp to 0 bp for increased contrast. Lines at −30 bp and −10 bp demarcate the interval associated with SF3B1 mis-splicing (38). Additional lines at −140 bp and −330 bp demarcate additional intervals of interest. G, Sequence logos of canonical and A3SS sequences encompassing the 3′ splice site (starting at −35 bp upstream of the AG motif) and statistical comparison through a two-sample logo. H, Frequency of A3SS events per rMATS cell type comparison where the splice site shift remains in-frame (blue) or induces a frameshift event (orange). I, Frequency of exon insertion events per rMATS cell-type comparison where the splice site shift incorporates a new PTC (pink) or remains in-frame with no PTC induction (green). J and K, RNA velocity analysis of transcriptomically identified HSPC and erythroblast subsets in 10x scRNA-seq, visualizing the percentage of spliced transcripts along pseudotime in the total cell populations (violin plots) or separated by sample group (scatter plots). The analysis in J includes all transcripts, whereas K excludes ribosomal and globin transcripts. L, UMAP overlay of FACS-purified HSPC subsets and GPA+ EB from 1 SF3B1mt MDS-RS patient after Smart-seq3xpress (SS3x), visualizing true versus predicted cell-type identity. M, RNA velocity analysis of spliced RNA read percentages in the FACS-sorted SS3× experiment, analyzed independently of the 10x dataset. This graph excludes ribosomal and globin transcripts. N, Mean (±SEM) differences in PSI after 3 hours cycloheximide treatment (70 μg/mL) versus DMSO (1:1,000, vehicle) in MDS-RS CD34 and GPA cells. SF3B1mt-associated NMD-targeted ASEs with sufficient coverage are shown at far left, SF3B1mt-associated in-frame ASEs at middle-left, and endogenous NMD-targeted transcripts at middle-right. The far-right plot visualizes all ASEs. *, P < 0.05; **, P < 0.01; ***, P < 0.001; ns, nonstatistically significant.](https://cdn.ncbi.nlm.nih.gov/pmc/blobs/b1af/10790130/53a3038b7f64/211fig6.jpg)
References
-
- Meyer SE. Splicing together the origins of MDS-RS. Blood 2017;130:841–2. - PubMed
-
- Swerdlow SH. International agency for research on C, World Health O. WHO classification of tumours of haematopoietic and lymphoid tissues. Lyon: International Agency for Research on Cancer 2017.
-
- Yoshida K, Sanada M, Shiraishi Y, Nowak D, Nagata Y, Yamamoto R, et al. . Frequent pathway mutations of splicing machinery in myelodysplasia. Nature 2011;478:64–9. - PubMed
Publication types
MeSH terms
Substances
Grants and funding
LinkOut - more resources
Full Text Sources
Medical
Research Materials
Miscellaneous
