. 2024 Apr 1;30(7):1352-1366.
doi: 10.1158/1078-0432.CCR-23-2043.

Combined Vorinostat and Chloroquine Inhibit Sodium-Iodide Symporter Endocytosis and Enhance Radionuclide Uptake In Vivo

Affiliations

Combined Vorinostat and Chloroquine Inhibit Sodium-Iodide Symporter Endocytosis and Enhance Radionuclide Uptake In Vivo

Martin L Read et al. Clin Cancer Res. .

Abstract

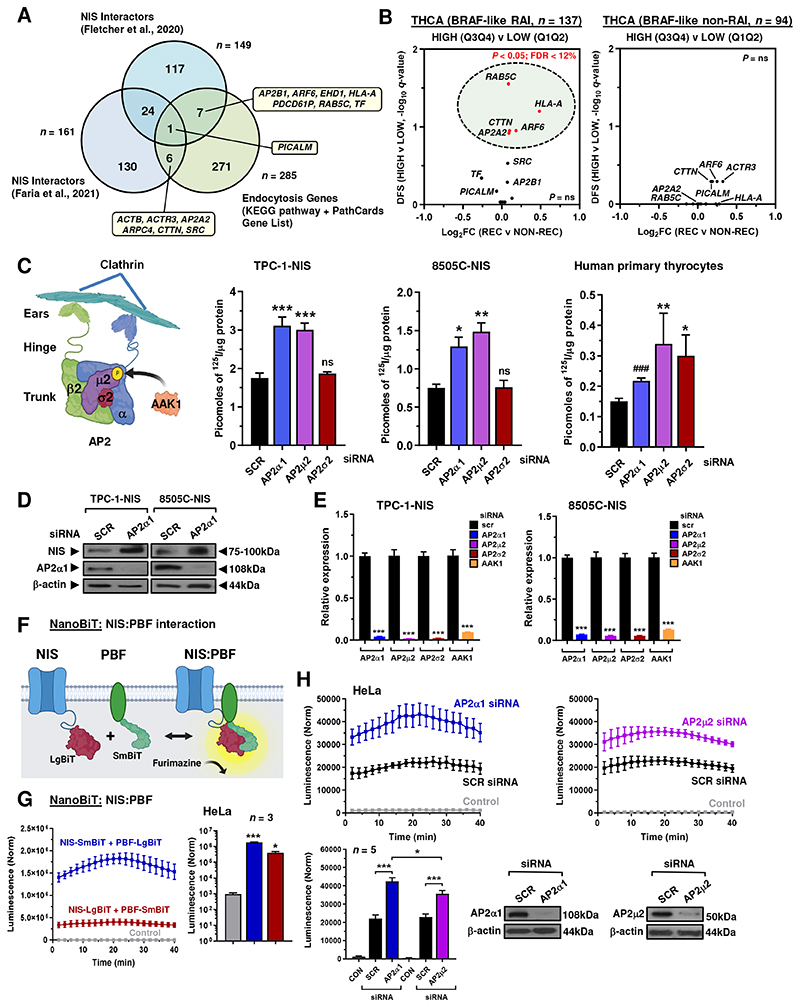
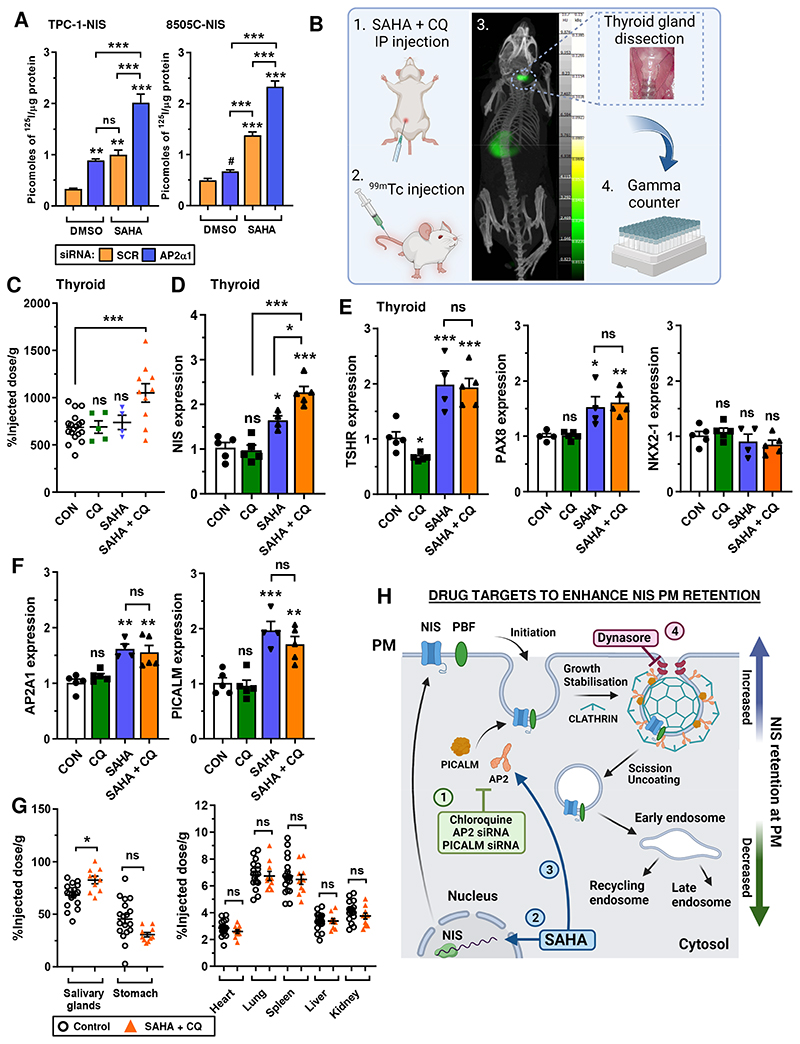
Purpose: Patients with aggressive thyroid cancer are frequently failed by the central therapy of ablative radioiodide (RAI) uptake, due to reduced plasma membrane (PM) localization of the sodium/iodide symporter (NIS). We aimed to understand how NIS is endocytosed away from the PM of human thyroid cancer cells, and whether this was druggable in vivo.

Experimental design: Informed by analysis of endocytic gene expression in patients with aggressive thyroid cancer, we used mutagenesis, NanoBiT interaction assays, cell surface biotinylation assays, RAI uptake, and NanoBRET to understand the mechanisms of NIS endocytosis in transformed cell lines and patient-derived human primary thyroid cells. Systemic drug responses were monitored via 99mTc pertechnetate gamma counting and gene expression in BALB/c mice.

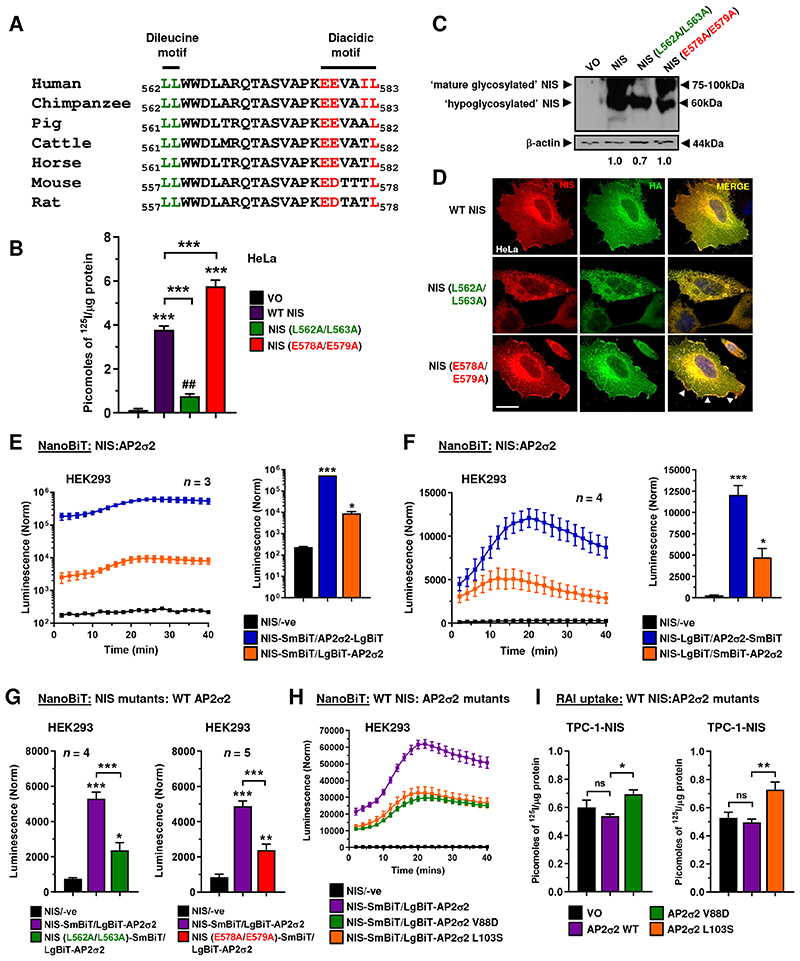
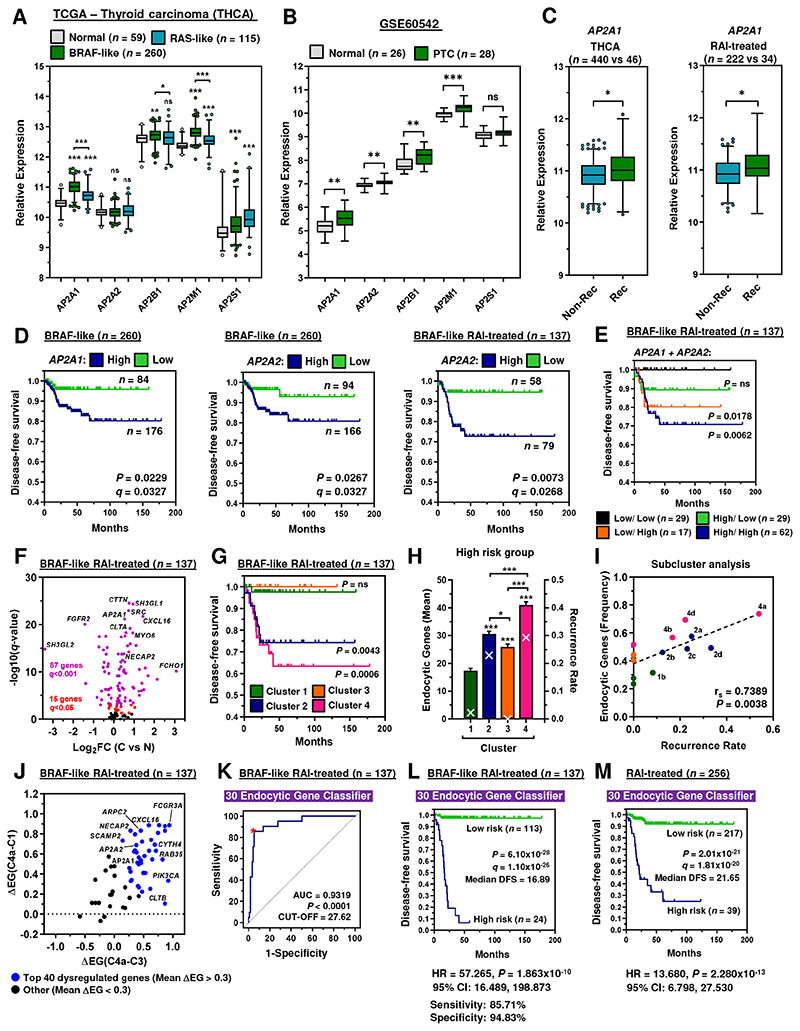
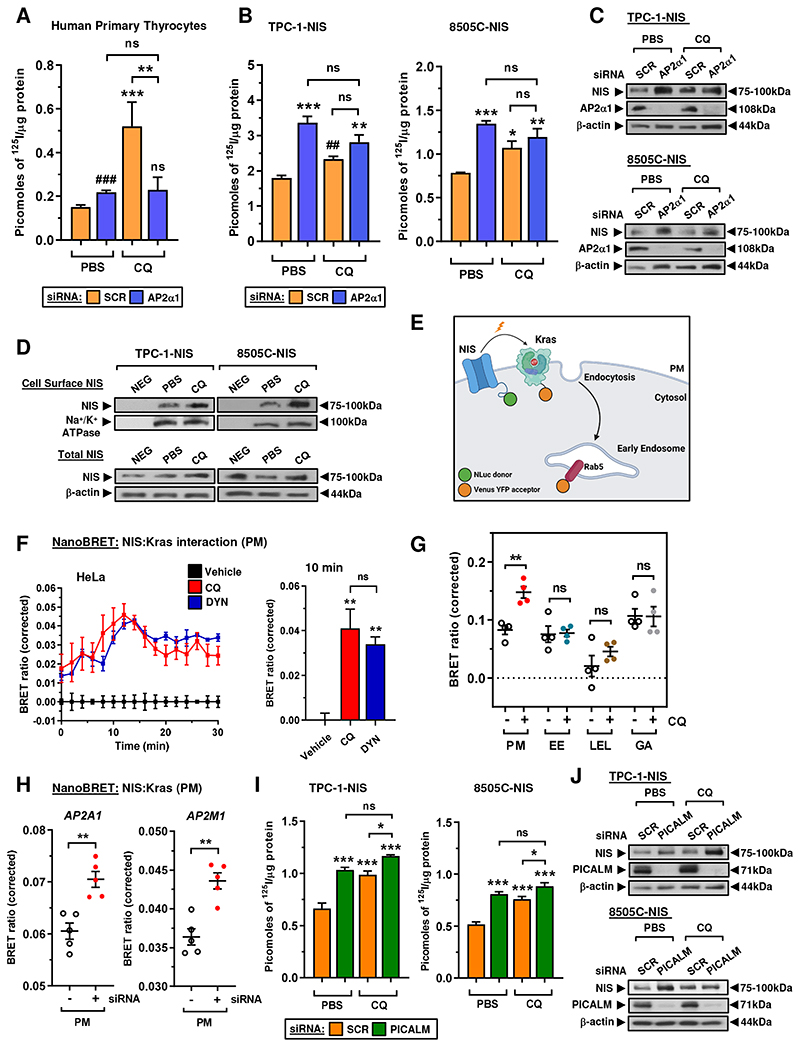
Results: We identified an acidic dipeptide within the NIS C-terminus that mediates binding to the σ2 subunit of the Adaptor Protein 2 (AP2) heterotetramer. We discovered that the FDA-approved drug chloroquine (CQ) modulates NIS accumulation at the PM in a functional manner that is AP2 dependent. In vivo, CQ treatment of BALB/c mice significantly enhanced thyroidal uptake of 99mTc pertechnetate in combination with the histone deacetylase (HDAC) inhibitor vorinostat/SAHA, accompanied by increased thyroidal NIS mRNA. Bioinformatic analyses validated the clinical relevance of AP2 genes with disease-free survival in RAI-treated DTC, enabling construction of an AP2 gene-related risk score classifier for predicting recurrence.

Conclusions: NIS internalization is specifically druggable in vivo. Our data, therefore, provide new translatable potential for improving RAI therapy using FDA-approved drugs in patients with aggressive thyroid cancer. See related commentary by Lechner and Brent, p. 1220.


Conflict of interest statement

Authors' Disclosures

The authors assert they have no conflicts of interest.

Conflict of Interest: The authors assert they have no conflicts of interest.

Figures

Figure 1
Figure 1. Modulation of AP2 expression increases RAI uptake.
A, Venn diagram showing overlap in NIS interactors from 2 mass spectrometry investigations versus endocytosis genes (KEGG pathway + Pathcards). 14 top candidates are highlighted. B, Volcano plot illustrating log2FC [recurrent (REC) versus non-recurrent (NON-REC)] compared to q-value (-log base 10) for DFS in RAI-treated (left) and non-RAI treated (right) BRAF-like THCA cohorts for 14 endocytic genes [high (Q3Q4) versus low (Q1Q2) tumoral expression]. P < 0.05 (green circle). C, Schematic (left) depicting AP2 subunits and interaction with clathrin/ AAK1. Created with BioRender.com. (right) RAI uptake of TPC-1-NIS cells, 8505C-NIS cells and human primary thyrocytes transfected with siRNA specific for indicated AP2 genes. D, Western blot analysis of NIS and AP2α1 protein in TPC-1-NIS and 8505C-NIS cells transfected with AP2α1 siRNA. E, Relative mRNA levels of AP2 genes and AAK1 in TPC-1-NIS and 8505C-NIS cells transfected with siRNA specific for indicated AP2 genes and AAK1. F, Schematic depicting NanoBiT assay to detect protein: protein interaction between NIS tagged with LgBiT and PBF tagged with SmBiT. The NanoLuc luciferase enzyme (LgBiT + SmBiT) relies on the substrate furimazine to produce high intensity, glow-type luminescence. G, Kinetic measurements in live HeLa cells to evaluate protein-protein interactions between NIS and PBF tagged with LgBiT or SmBiT as indicated. (right) NanoBiT assay results at 20 minutes post-addition of Nano-Glo substrate (n = 3). H, NanoBiT evaluation (upper) of protein: protein interaction between NIS and PBF in live HeLa cells transfected with siRNA specific for indicated AP2 genes. (lower) Normalised NanoBiT assay results at 20 minutes post-addition of Nano-Glo live cell assay substrate (n = 5). Western blot analysis of AP2α1 and AP2μ2 protein in HeLa cells transfected with indicated siRNA. Data presented as mean ± S.E.M., n = 3-7, one-way ANOVA followed by Dunnett’s or Tukey’s post hoc test (ns, not significant; *P < 0.05; **P < 0.01; ***P < 0.001), or unpaired two-tailed t-test (###P < 0.001).
Figure 2
Figure 2. C-terminal motifs in NIS influence binding to AP2σ2 and are critical for function.
A, Alignment of NIS C-terminus amino acid sequence (562-583) across multiple species. Potential dileucine (green) and diacidic (red) motifs are highlighted. B, RAI uptake in HeLa cells transfected with wild-type (WT) NIS, NIS mutant L562/L563A or NIS mutant E578A/E579A. C, Western blot analysis of different glycosylated isoforms of NIS protein in HeLa cells transfected with WT NIS, NIS mutant L562A/L563A and NIS mutant E578A/E579A. Relative NIS densitometry values are provided (bottom). D, Same as B but confocal imaging in HeLa cells transfected with HA-tagged WT NIS and NIS mutants. Confocal images represent NIS expression (red), HA expression (green) and a merged image (yellow). Arrows (white) highlight PM regions with greater NIS localisation. Scale bar – 20 μm. See also Supp Fig. S3A and S3B. E, Live cell kinetic measurement using the NanoBiT assay to evaluate protein-protein interactions between NIS and AP2σ2 tagged with LgBiT in HEK293 cells. (right) NanoBiT assay results at 20 minutes post-addition of Nano-Glo substrate. See also Supp Fig. S4A. F, Same as E but AP2σ2 tagged with SmBiT. See also Supp Fig. S4B. G, Same as E but with NIS mutants L562A/L563A (left) and E578A/E579A (right). See also Supp Fig. S4C. H, Same as E but with AP2σ2 mutants V88D and L103S. See also Supp Fig. S4D and S4E. I, RAI uptake in TPC-1-NIS cells transfected with WT AP2σ2, AP2σ2 mutant V88D and AP2σ2 mutant L103S. See also Supp Fig. S4F. Data presented as mean ± S.E.M., n = 4-5, one-way ANOVA followed by Tukey’s post hoc test (ns, not significant; *P < 0.05; **P < 0.01; ***P < 0.001) or unpaired two-tailed t-test (##P < 0.01).
Figure 3
Figure 3. AP2 gene-related risk score classifier is predictive of thyroid cancer recurrence.
A and B, Box and whisker plots showing expression (log2) of AP2 genes in the (A) THCA (BRAF-like and RAS-like PTC versus normal) and (B) GSE60542 (PTC versus normal) datasets. C, Box and whisker plots showing AP2A1 expression in the THCA (left) and RAI-treated (right) cohorts [recurrent (REC) versus non-recurrent (NON-REC)]. D, Representative Kaplan-Meier analysis of DFS for the BRAF-like and BRAF-like, RAI treated THCA cohorts stratified on high vs low tumoral expression of indicated AP2 genes; log-rank test. Number (n) of patients per expression sub-group (high/low), P-values and q-values are shown. E, Same as D but patients stratified on high vs low tumoral expression for both AP2A1 and AP2A2 in the BRAF-like, RAI treated THCA cohort. F, Volcano plot comparing log2FC with q-value (-log base 10) for the BRAF-like, RAI-treated THCA cohort [C versus N; n = 137] and 137 endocytosis-related genes. See also Supp Fig. S5C. G, Representative Kaplan-Meier analysis of DFS for the BRAF-like, RAI treated THCA cohort stratified into patient clusters 1 to 4; log-rank test. Number (n) of patients per sub-group (high/low) and P-values are shown. H, Mean number of dysregulated endocytic genes stratified into the high-risk group (bars; left y-axis) and recurrence rate (white crosses; right y-axis) in patient clusters 1 to 4 (n = 17 – 44). I, Correlation analysis between frequency of dysregulated endocytic genes in high-risk group vs recurrence rate in patients stratified into 14 subclusters; Spearman’s rank correlation. J, Differential analysis (Δ) of the frequency of endocytic genes (EG; high-risk group; n = 61) between patient with high (subcluster 4a) vs low recurrence (clusters 1 and 3). Blue spots = mean ΔEG[(C4a-C1) & ΔEG(C4a-C3)] ≥ 0.3 (n = 40). K-M, ROC analysis (K) and Kaplan-Meier curve (L) of the 30 endocytic gene risk score classifier in the BRAF-like, RAI-treated THCA cohort. M, Same as L but with the RAI-treated THCA cohort (n = 256).
Figure 4
Figure 4. CQ inhibits endocytosis to increase NIS protein at the plasma membrane.
A, RAI uptake in human primary thyrocytes following AP2α1-siRNA depletion and chloroquine (CQ) treatment. Scr – scrambled control siRNA. B and C, RAI uptake (B) and relative NIS and AP2α1 protein levels (C) in TPC-1-NIS and 8505C-NIS cells following AP2α1-siRNA depletion and CQ treatment. Scr – scrambled control siRNA. D, Western blot analysis of NIS protein at the PM relative to Na+/K+ ATPase following CSBA in TPC-1-NIS and 8505C-NIS cells after CQ treatment. (lower) Total NIS protein levels in thyroid cells treated with CQ. E, Schematic depicting NanoBRET assay to monitor close proximity of NIS with highly abundant PM proteins (e.g. Kras). Created with BioRender.com. F, Live cell kinetic measurement using the NanoBRET signal to evaluate the close proximity between NIS and Kras in HeLa cells treated with CQ or DYN. (right) NanoBRET assay results at 10 minutes post-addition of Nano-Glo substrate. G, Profiling PM and subcellular changes of NIS using the NanoBRET assay in CQ-treated HeLa cells. HeLa cells were transiently transfected with NIS tagged with NLuc, and the PM marker Kras or one of the subcellular markers Rab5 (EE, early endosome), Rab7 (LEL, late endosome/lysosome) or Rab6 (GA, golgi apparatus) tagged with Venus. H, NanoBRET evaluation of NIS PM localisation in HeLa cells transfected with siRNA specific for indicated AP2 genes. I and J, RAI uptake (I) and relative NIS and PICALM protein levels (J) in TPC-1-NIS and 8505C-NIS cells following PICALM-siRNA depletion and CQ treatment. Scr – scrambled control siRNA. Data presented as mean ± S.E.M., n = 3-4, one-way ANOVA followed by Tukey’s post hoc test (ns, not significant; *P < 0.05; **P < 0.01; ***P < 0.001) or unpaired two-tailed t-test (#P < 0.05; ##P < 0.01).
Figure 5
Figure 5. Targeting endocytosis to enhance the impact of SAHA on NIS function in vivo.
A, RAI uptake in TPC-1-NIS and 8505C-NIS cells following AP2α1-siRNA depletion and SAHA treatment. Scr – scrambled control siRNA. B, Schematic of steps (–4) used to examine the translatable potential of CQ and SAHA to enhance NIS function in vivo. C and D, Technetium-99m pertechnetate (99mTc) uptake (C; n = 4 -18) and NIS mRNA levels (D) in thyroid glands dissected from WT BALB/c mice administered with CQ and SAHA either alone or in combination. E-F, Same as D but relative TSHR, PAX8, NKX2-1, AP2A1 and PICALM mRNA levels in mouse thyroids. G, Distribution of 99mTc uptake across the indicated tissues harvested from WT BALB/c mice as described in B. Data presented as mean ± S.E.M.; ns, not significant; *P < 0.05; **P < 0.01; ***P < 0.001. H, Mechanistic impact of drug and siRNA targets modulating NIS retention at the PM. (1) Chloroquine, AP2 siRNA and PICALM siRNA inhibit endocytosis, (2) SAHA increases NIS transcription, (4) SAHA increases PICALM and AP2 transcription, and (4) Dynasore inhibits dynamin to block endocytosis. Combinatorial vorinostat and chloroquine treatment targeting both NIS transcription and endocytosis gives maximal NIS stimulation. Schematics created with BioRender.com.

Comment in

Similar articles

Cited by

References

    1. Hertz S, Roberts A. Radioactive Iodine as an Indicator in Thyroid Physiology. V. The Use of Radioactive Iodine in the Differential Diagnosis of Two Types of Graves’ Disease. J Clin Invest. 1942;21(1):31–2. - PMC - PubMed
    1. Lirov R, Worden FP, Cohen MS. The Treatment of Advanced Thyroid Cancer in the Age of Novel Targeted Therapies. Drugs. 2017;77(7):733–45. - PMC - PubMed
    1. Choi YW, Kim HJ, Kim YH, Park SH, Chwae YJ, Lee J, et al. B-RafV600E inhibits sodium iodide symporter expression via regulation of DNA methyltransferase 1. Exp Mol Med. 2014;46:e120. - PMC - PubMed
    1. Durante C, Puxeddu E, Ferretti E, Morisi R, Moretti S, Bruno R, et al. BRAF mutations in papillary thyroid carcinomas inhibit genes involved in iodine metabolism. J Clin Endocrinol Metab. 2007;92(7):2840–3. - PubMed
    1. Knostman KA, McCubrey JA, Morrison CD, Zhang Z, Capen CC, Jhiang SM. PI3K activation is associated with intracellular sodium/iodide symporter protein expression in breast cancer. BMC Cancer. 2007;7:137. - PMC - PubMed

Publication types