. 2023 Nov 3;18(11):e0285918.
doi: 10.1371/journal.pone.0285918. eCollection 2023.

Colonic mucosal associated invariant T cells in Crohn's disease have a diverse and non-public T cell receptor beta chain repertoire

Affiliations

Colonic mucosal associated invariant T cells in Crohn's disease have a diverse and non-public T cell receptor beta chain repertoire

Andrew J Konecny et al. PLoS One. .

Abstract

Objectives: Mucosal-Associated Invariant T (MAIT) cells are T cells with a semi-invariant T cell receptor (TCR), recognizing riboflavin precursors presented by a non-polymorphic MR1 molecule. As these precursors are produced by the gut microbiome, we characterized the frequency, phenotype and clonality of MAIT cells in human colons with and without Crohn's disease (CD).

Methods: The transcriptome of MAIT cells sorted from blood and intestinal lamina propria cells from colectomy recipients were compared with other CD8+ T cells. Colon biopsies from an additional ten CD patients and ten healthy controls (HC) were analyzed by flow cytometry. TCR genes were sequenced from individual MAIT cells from these biopsies and compared with those of MAIT cells from autologous blood.

Results: MAIT cells in the blood and colon showed a transcriptome distinct from other CD8 T cells, with more expression of the IL-23 receptor. MAIT cells were enriched in the colons of CD patients, with less NKG2D in inflamed versus uninflamed segments. Regardless of disease, most MAIT cells expressed integrin α4β7 in the colon but not in the blood, where they were enriched for α4β7 expression. TCR sequencing revealed heterogeneity in the colon and blood, with few public sequences associated with cohorts.

Conclusion: MAIT cells are enriched in the colons of CD patients and disproportionately express molecules (IL-23R, integrin α4β7) targeted by CD therapeutics, to suggest a pathogenic role for them in CD. Public TCR sequences were neither common nor sufficiently restricted to a cohort to suggest protective or pathogenic antigen-specificities.


Conflict of interest statement

The authors have declared that no competing interests exist.

Figures

Fig 1
Fig 1. Blood and mucosal CD4- MAIT cells have a transcriptome distinct from other CD8 T cells.
Full transcriptome sequencing was performed on mRNA isolated from CD4- MAIT or non-MAIT CD8+ T cells sorted from the blood or surgically resected colonic lamina propria of patients with or without IBD as an indication for surgery. Principal component (PC) analysis was performed on transcriptome profiles, separating anatomic source of cells in PCs 1 and 2 (a), and sorted cell phenotype in PCs 3 and 4 (b). Volcano plots of gene transcripts preferentially expressed in CD4- MAIT cells (green) versus conventional CD8 T cells (red) are shown for cells sorted from blood (c) or colon (d). Dotted lines denote the threshold for significance, and the most differentially expressed genes are labeled by name. (e) Venn diagram showing the number of gene transcripts significantly more (“_Up”) or less (“_Down”) expressed in CD4- MAIT cells relative to other CD8 T cells from PBMC (“Blood”) and/or colon (“Tissue”). (f) Normalized mRNA expression levels of the IL23R gene compared between CD4- MAIT cells and non-MAIT CD8+ T cells isolated from blood (PBMC) or colon lamina propria (LPMC) by Mann-Whitney test.
Fig 2
Fig 2. Frequency and phenotype of colonic CD4- MAIT cells.
(a) CD4- MAIT cells from colon biopsies were quantified by flow cytometry as a percent of CD4- negative T cells and found to be more common in biopsies from ten Crohn’s disease (CD) patients relative to ten healthy controls (HC), regardless of whether biopsied colon was inflamed (CDIC) or uninflamed (CDNC). The percent of colonic CD4- MAIT cells expressing NKG2D (b), CD8 (c), or CD103 (d) and the per-cell mean fluorescent intensity (MFI) of CD103 in the latter was quantified by flow cytometry. The number of MAIT cells (as a percentage of CD4- T cells) (f) and the percent thereof expressing CD103 (g) was compared between whole mucosal biopsies (Bx: Pooled from (a) and (d), respectively) and the de-epithelialized LP samples used in Fig 1. The percent of colonic CD8+ conventional T cells expressing CD103 (h) or NKG2D (i) on their surfaceis shown for comparison. A Kruskal-Wallis test for variance was performed for each parameter, and if it revealed a P-value less than 0.05, two-way paired (Wilcoxon) or unpaired (Mann-Whitney) non-parametric comparisons were performed as indicated between autologous or allogeneic specimens, respectively.
Fig 3
Fig 3. Frequency and phenotype of blood CD4- MAIT cells.
The percent of blood CD4- MAIT or other T cell subsets (as indicated on x-axes) expressing CD103 (a) or integrin α4β7 (as detected by labeled vedolizumab) (b) on their surface was quantified by flow cytometry. Pooling data from all cohorts, α4β7 expression showed highly significant variance between T cell subsets by paired analysis (Friedman test), with the most expression among CD4- MAIT cells, which were significantly more α4β7+ (b) and less CD103+ (a) than other CD8 T cells by paired two-way (Wilcoxon) comparison. No differences in CD103 (a) or α4β7 expression (b) were seen between CD (black dots) and HC (open squares). Error bars reflect means and standard deviations.
Fig 4
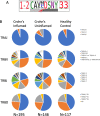
Fig 4. Colonic CD4- MAIT cell TCR sequences.
Full TCR alpha and beta chain gene transcripts were sequenced from individual CD4- MAIT cells sorted from colon biopsies of the ten CD and ten HC subjects in Fig 2. Cells lacking the canonical MAIT TRAV1.2 sequence from their alpha chain were deemed contaminants and excluded from analyses. (a) Of all the remaining cells, a consensus sequence was observed in the TCR alpha chain CDR3 region. (b) The fraction of these CD4- MAIT cells expressing different J-regions from the TCR alpha locus and different V, D, and J regions from the TCR beta locus is shown as a pie chart for inflamed or uninflamed colon biopsies from CD patients, or biopsies from healthy screening colonoscopy recipients.
Fig 5
Fig 5. Colonic CD4- MAIT cell clonality and overlap.
Each individual CD4- MAIT cell from Fig 3 with a canonical TRAV1.2 is shown as a point on the radius of this circos plot. Each individual from whom these MAIT cells were sorted is shown as a different color on the outer circle. The inner circle denotes whether MAIT cells were sorted from the colon biopsy of a HC (green) or a biopsy from the inflamed (red) or uninflamed (blue) colon of a CD patient. Any two MAIT cells with the exact same TCR alpha and beta sequences are connected by a thin line, colored to reflect their tissue of origin as in the inner circle (or purple, if cells from inflamed and uninflamed colon biopsies from CD patients have the same TCR).
Fig 6
Fig 6. Blood CD4- MAIT cell diversity and clonal overlap.
CD4- MAIT cells were sorted from the PBMC of eight Crohn’s disease (CD) patients or eight healthy controls (HC) at the time of colonoscopy from which they donated biopsies used in Figs 2–4, and their TCR beta chain CDR3 regions were sequenced. (a) The TCR beta repertoire diversity in each sample is plotted on a log scale, and the difference in Simpson’s diversity index (in which 1 denotes monoclonality and 0 means every cell has a different TCR beta sequence) between CD and HC samples shows no significance by unpaired non-parametric analysis (Mann-Whitney). (b) The Morisita index of overlap between TCR repertoires (in which 1 denotes complete overlap and 0 denotes no overlap) from each possible combination of any two of the 16 PBMC donors was calculated, and the overlap between every possible pairing is plotted on a log scale. The overlap between any two HC (HC vs HC), any two CD patients (CD vs CD) or any one HC and any one CD patient (HC vs CD) is shown, with unpaired non-parametric analysis (Kruskal-Wallis test) revealing no significant variance. (c) Actual Morisita indices of diversity plotted in (b) for each possible comparison between two CD (red border) and/or HC (blue border) subjects are shown and color coded on a grid.

References

    1. Billerbeck E, Kang YH, Walker L, Lockstone H, Grafmueller S, Fleming V, et al.. Analysis of CD161 expression on human CD8+ T cells defines a distinct functional subset with tissue-homing properties. Proc Natl Acad Sci U S A. 2010;107(7):3006–11. Epub 2010/02/06. doi: 10.1073/pnas.0914839107 ; PubMed Central PMCID: PMC2840308. - DOI - PMC - PubMed
    1. Gherardin NA, Souter MN, Koay HF, Mangas KM, Seemann T, Stinear TP, et al.. Human blood MAIT cell subsets defined using MR1 tetramers. Immunol Cell Biol. 2018;96(5):507–25. Epub 2018/02/14. doi: 10.1111/imcb.12021 ; PubMed Central PMCID: PMC6446826. - DOI - PMC - PubMed
    1. Tilloy F, Treiner E, Park SH, Garcia C, Lemonnier F, de la Salle H, et al.. An invariant T cell receptor alpha chain defines a novel TAP-independent major histocompatibility complex class Ib-restricted alpha/beta T cell subpopulation in mammals. J Exp Med. 1999;189(12):1907–21. doi: 10.1084/jem.189.12.1907 - DOI - PMC - PubMed
    1. Porcelli S, Yockey CE, Brenner MB, Balk SP. Analysis of T cell antigen receptor (TCR) expression by human peripheral blood CD4-8- alpha/beta T cells demonstrates preferential use of several V beta genes and an invariant TCR alpha chain. J Exp Med. 1993;178(1):1–16. doi: 10.1084/jem.178.1.1 ; PubMed Central PMCID: PMC2191070. - DOI - PMC - PubMed
    1. D’Souza C, Pediongco T, Wang H, Scheerlinck JY, Kostenko L, Esterbauer R, et al.. Mucosal-Associated Invariant T Cells Augment Immunopathology and Gastritis in Chronic Helicobacter pylori Infection. J Immunol. 2018;200(5):1901–16. Epub 2018/01/31. doi: 10.4049/jimmunol.1701512 . - DOI - PubMed

Publication types

MeSH terms

Substances