. 2023 Nov 28;42(11):113369.
doi: 10.1016/j.celrep.2023.113369. Epub 2023 Nov 3.

Netrin-1 feedforward mechanism promotes pancreatic cancer liver metastasis via hepatic stellate cell activation, retinoid, and ELF3 signaling

Affiliations

Netrin-1 feedforward mechanism promotes pancreatic cancer liver metastasis via hepatic stellate cell activation, retinoid, and ELF3 signaling

Crissy Dudgeon et al. Cell Rep. .

Abstract

The biology of metastatic pancreatic ductal adenocarcinoma (PDAC) is distinct from that of the primary tumor due to changes in cell plasticity governed by a distinct transcriptome. Therapeutic strategies that target this distinct biology are needed. We detect an upregulation of the neuronal axon guidance molecule Netrin-1 in PDAC liver metastases that signals through its dependence receptor (DR), uncoordinated-5b (Unc5b), to facilitate metastasis in vitro and in vivo. The mechanism of Netrin-1 induction involves a feedforward loop whereby Netrin-1 on the surface of PDAC-secreted extracellular vesicles prepares the metastatic niche by inducing hepatic stellate cell activation and retinoic acid secretion that in turn upregulates Netrin-1 in disseminated tumor cells via RAR/RXR and Elf3 signaling. While this mechanism promotes PDAC liver metastasis, it also identifies a therapeutic vulnerability, as it can be targeted using anti-Netrin-1 therapy to inhibit metastasis using the Unc5b DR cell death mechanism.

Keywords: CP: Cancer; Elf3; Netrin-1; Unc5b; axon guidance; extracellular vesicles; hepatic stellate cells; metastasis; metastatic niche; pancreatic cancer; retinoic acid.


Conflict of interest statement

Declaration of interests The authors declare no competing interests.

Figures

Figure 1.
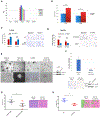
Figure 1.. Netrin-1 is upregulated in metastatic PDAC
(A) Histology of a representative primary and metastatic pancreatic tumor to the liver displaying both mesenchymal (M) and epithelial (well-differentiated) features (D). H&E (i, iv), E-cadherin (ii, v), Masson’s trichrome (iii, vi) staining. Scale bars, 50 μm (i, ii) and 100 μm (iii–vi). (B) Heatmaps of overexpressed (left) and underexpressed (right) genes as well as the axon guidance gene family determined by RNA-seq comparing the log2 fold change from primary to metastatic tumor transcriptomes. Enriched pathways are marked on the right side of the heatmaps. (C) Western blot analysis of Netrin-1 and actin (loading control) expression in primary tumor cell line (Ink4a.1) and four separate metastatic cell lines obtained from liver metastases. (D) (Top) Representative immunohistochemistry images of Netrin-1 expression in human primary pancreatic tumor biopsy (i), primary patient-derived xenograft (PDX) pancreatic tumor (ii), and two metastatic pancreatic PDX tumors (iii, iv). Scale bar, 100 μm. (Bottom) Quantification of Netrin-1 expression in the TMA of PDX pancreatic tumors; n = 75 for primary, n = 18 for metastases. (E) Expression of Netrin-1 in the Collisson et al. RNA-seq dataset of different pancreatic cancer phenotypes (n = 20, quasi-mesenchymal subtype; n = 27, classical subtype; n = 19) based on expression profiling. Statistical analysis was completed using two-tailed Student’s t test (*p < 0.05).
Figure 2.
Figure 2.. Unc5b is the dominant Netrin-1 receptor in PDAC and functions as dependence receptor to promote metastasis
(A) RNA-seq analysis of primary and metastatic pancreatic cancer cell-line expression of Netrin-1 receptors. (B) Annexin V staining of primary Ink4a and metastatic Met38 cell lines transiently transfected with a non-targeting control siRNA or Ntn1 siRNA. n = 3 in each group. (C) (Left) Graphs of the migration and invasion analysis of serum starved Ink4a cells treated with recombinant Netrin-1. (Right) Representative images of fixed and stained cells are on the right. n = 10. Scale bars, 50 μm. (D) (Left) Graphs of the migration and invasion analysis of Met38 cells transiently transfected with a control or Ntn1 siRNA. (Right) Representative images of fixed and stained cells are on the right. n = 10. Scale bars, 50 μm. (E) 3D in vitro sprouting assay for Met38 control KD (a, b) or Ntn1 KD cells (c, d) and A1925 control (e, f) and ΔUnc5b (g, h) expressing cells. Netrin-1 knockdown was confirmed by Netrin-1 expression analysis (far right). Scale bars, 100 μm (a, c, e, g) and 20 μm (b, d, f, h). (F) (Top) Graph of the invasion analysis of Met38 cKO (control knockout) and Met38 Unc5b KO cells. Representative images of fixed and stained cells are below (scale bars, 50 μm), as well as the western blot showing Unc5b depletion in Unc5b KO cells. (G and H) H&E staining of livers after intrasplenic injection of Met38 control knockdown (KD) and Met38 Ntn1 KD cells (G) or Met38 cKO and Met38 Unc5b KO cells (H). Quantitation of tumor area was determined by VisioPharm software. n = 6/group. Scale bars, 50 μm. Statistical analysis was completed using two-tailed Student’s t test (*p < 0.05, **p < 0.01, ***p < 0.001, ****p < 0.0001).
Figure 3.
Figure 3.. Hepatic stellate cell secretion of retinoids causes upregulation of Netrin-1 through RAR/RXR signaling
(A) Netrin-1 expression was analyzed by western blot following treatment with HSC conditioned medium for the indicated time points. Actin served as a loading control. The fold change of Netrin-1 expression is shown below the Netrin-1 blot. (B) (Top) HSCs were imaged on the indicated days by brightfield or retinoid autofluorescence using the DAPI filter. Scale bars, 20 μm. (Bottom) Ink4a.1 cells were treated for 24 h with HSC conditioned medium from the top experiment. Netrin-1 expression was determined by western blot with actin as a loading control. (C) Ink4a.1 cells were treated with retinoic acid (ATRA) and 9-cis-retinoic acid for the indicated times. Netrin-1 and actin expression was analyzed as before. (D) ATRA-treated Ink4a cells were subjected to ChIP analysis of the Ntn1 exon 1 promoter region using an isotype control or RXRα antibody, n = 4/group. (E) Ink4a.1 cells were transfected with siRNA to RARα, RXRα, and the combination and then treated for 24 h with HSC conditioned medium. Netrin-1 and actin expression was analyzed as before. (F) Ink4a.1 cells were treated with all-trans-retinoic acid (RA) or 9-cis-retinoic acid (9RA) ± UVI 3003 for 24 h. Netrin-1 and actin were blotted as before. All experiments were completed in triplicate. Statistical analysis was completed using two-tailed Student’s t test (**p < 0.01).
Figure 4.
Figure 4.. Elf3 increases expression of Netrin-1 in human and mouse pancreatic cancer cells
(A) ATAC-seq analysis of the Elf3 promoter for metastatic Met38 and primary Ink4a.1 pancreatic cancer cells, n = 2/group. (B) Expression of Elf3 was determined by qPCR in multiple primary and metastatic mouse (left) and human (right) pancreatic cancer cell lines treated with 10 μM all-trans-retinoic acid (ATRA) for 18 h. Actin expression was used for normalization. In all cases except for MIAPACA-2, the increase in Elf3 mRNA was statistically significant by two-tailed t test, n = 3/group. (C) ChIP experiment to demonstrate that RARα interacts with the Elf3 promoter, n = 4/group. (D) Following 7 days of treatment with DMSO or varying concentrations of ATRA, the percentages of E-cadherin-positive (left) and vimentin-positive (right) cells were determined by flow cytometry in three cell lines, each of which had been developed from pancreatic tumors generated by different KPC-Arid1a−/− mice, n = 3/group. (E) The top panel shows conservation of consensus Elf3 transcription factor binding sequence within the Netrin-1 promoter in a variety of species, while the bottom panel shows results of a ChIP experiment indicating that Elf3 interacts with this region on the mouse Ntn1 gene. (F) Ink4a.1 cells were transfected for 72 h with pCMV6 or with pCMV6-Elf3, followed by qPCR to assay Netrin-1 transcription. Actin was used as a normalization control, n = 3/group. (G) Met38 sgControl and sgElf3 were treated with DMSO or 10 μM ATRA for 18 h and analyzed for Netrin-1 RNA expression. The top graph shows the fold change of Netrin-1 expression for ATRA vs. DMSO, n = 3. All experiments were completed at least in duplicate and represent mean ± SEM. In the bottom panel the reduction of Elf3 protein is demonstrated by western blot analysis; positions of molecular weight markers, in kDa, are indicated. Statistical analysis was completed using two-tailed Student’s t test (*p < 0.05, **p < 0.01, ***p < 0.001, ****p < 0.0001).
Figure 5.
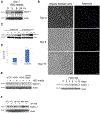
Figure 5.. Netrin-1 on the surface of extracellular vesicles promotes hepatic metastasis by activating HSCs
(A) Expression of HSC activation markers was determined by qPCR following treatment of HSCs with recombinant Netrin-1 at the indicated time points, n = 6/group. (B) In vivo activation of HSCs was determined by Desmin and SMA immunofluorescence staining of livers from mice orthotopically injected with Ink4a.1 WT and Ntn1 KO cells (left). Quantitation of Desmin+/SMA+ HSC cells (right) was determined (n = 10). Scale bars, 50 μm. (C) Activated HSCs were identified and quantitated by flow cytometry using high side scatter and SMA staining, n = 4. (D) NanoSight software analysis on EVs from lnk4a and Met38 cells showing the size of the analyzed EVs. Inset: Netrin-1 expression analysis of cellular and EV fraction by western blot. (E) TEM analysis on EVs harvested from Ink4a.1 and Met38 cells using Netrin-1 antibody coupled to 15-nm gold beads. Representative images showing the frequency of EVs labeled with Netrin-1 and specific EV marker, CD63. Scale bar, 100 nm. (F) Enlargement of representative Netrin-1-positive EVs. Scale bars, 100 nm (Ink4a, left), 200 nm (Ink4a, right), and 50 nm (Met38). (G) (Top) Schema for the in vivo experimental metastasis model used to demonstrate EV priming of the liver for pancreatic cancer metastatic seeding. (Bottom left) H&E staining of livers obtained from mice primed with Netrin-1-containing or Netrin-1 null EVs prior to pancreatic cancer cell seeding. (Bottom right) Percentage of tumor area compared to total liver lobe area shows significant decrease of priming the microenvironment with Ntn1 KO EVs compared to WT EVs. n = 10. Scale bars, 200 μm. All experiments were completed at least in duplicate. Statistical analysis was completed using two-tailed Student’s t test (***p < 0.001, ****p < 0.0001).
Figure 6.
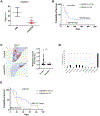
Figure 6.. Netrin-1 interference suppresses metastasis and increases survival in murine PDAC models
(A) Mice were pretreated with mAbNtn1 for 2 days and intrasplenically injected with 50,000 Ink4a.1 cells. Antibody treatment (10 mg/kg) continued every 2 days until liver harvest at day 14. Percentage tumor area in the liver was quantified as before (n = 5). (B) Kaplan-Meier graph showing survival of mice injected intrasplenically with 20,000 Ink4a.1 cells using mAbNtn1 (n = 16) as adjuvant treatment or vehicle (n = 19). Note that three mAbNtn1-treated mice have not recurred beyond day 200. (C) Immunohistochemistry of CK17-stained livers from C57Bl/6J mice injected via portal vein injection with KPC3 cells (left) and treated with IgG control or mAbNtn1, n = 10/group. Percentage of tumor metastasis area was quantified as before, n = 5 sections/mouse. Note the significant reduction in mice treated with anti-Netrin-1 antibody (right). Scale bars, 200 μm. (D) Normalized Netrin-1 expression in KPC3 cells, normal liver, hepatic KPC3 metastases from control IgG-treated mice, and hepatic KPC3 metastases from mAbNtn1-treated mice as quantified by western blot. (E) Kaplan-Meier plot showing survival of KPC mice treated with IgG vehicle and mAbNtn1 antibodies. The vehicle group (n = 17) had MS = 18 days, while the mAbNtn1 group (n = 11) had MS ~ 42 days, a doubling of lifespan. All experiments were completed at least in duplicate. Statistical analysis was completed using two-tailed Student’s t test (***p < 0.001, ****p < 0.0001).
Figure 7.
Figure 7.. The Netrin-1 feedforward mechanism that promotes liver metastasis
EVs containing Netrin-1 activate HSCs through both long-range (A) and possibly short-range communication upon dissemination in the liver (B). Upon activation by Netrin-1, HSCs dump their retinoic acid stores (C). The free retinoic acid is taken up by DTCs by their retinoic acid receptors (D), leading to upregulation of Netrin-1 directly and indirectly through Elf3 upregulation. Through autocrine signaling (E) by Unc5b receptors, newly arrived DTCs increase survival potential through Netrin-1 excretion. In addition, activated hepatic stellate cells deposit collagen into the microenvironment (F), which over time allows macrometastases to become established in the liver (G).

References

    1. McDonald OG, Li X, Saunders T, Tryggvadottir R, Mentch SJ, Warmoes MO, Word AE, Carrer A, Salz TH, Natsume S, et al. (2017). Epigenomic reprogramming during pancreatic cancer progression links anabolic glucose metabolism to distant metastasis. Nat. Genet 49, 367–376. 10.1038/ng.3753. - DOI - PMC - PubMed
    1. Pitarresi JR, Norgard RJ, Chiarella AM, Suzuki K, Bakir B, Sahu V, Li J, Zhao J, Marchand B, Wengyn MD, et al. (2021). PTHrP Drives Pancreatic Cancer Growth and Metastasis and Reveals a New Therapeutic Vulnerability. Cancer Discov. 11, 1774–1791. 10.1158/2159-8290.CD-20-1098. - DOI - PMC - PubMed
    1. Biankin AV, Waddell N, Kassahn KS, Gingras MC, Muthuswamy LB, Johns AL, Miller DK, Wilson PJ, Patch AM, Wu J, et al. (2012). Pancreatic cancer genomes reveal aberrations in axon guidance pathway genes. Nature 491, 399–405. 10.1038/nature11547. - DOI - PMC - PubMed
    1. Mehlen P, Delloye-Bourgeois C, and Chédotal A. (2011). Novel roles for Slits and netrins: axon guidance cues as anticancer targets? Nat. Rev. Cancer 11, 188–197. 10.1038/nrc3005. - DOI - PubMed
    1. Serafini T, Kennedy TE, Galko MJ, Mirzayan C, Jessell TM, and Tessier-Lavigne M. (1994). The netrins define a family of axon outgrowth-promoting proteins homologous to C. elegans UNC-6. Cell 78, 409–424. 10.1016/0092-8674(94)90420-0. - DOI - PubMed

Publication types

LinkOut - more resources