. 2023 Nov 3;9(44):eadi7347.
doi: 10.1126/sciadv.adi7347. Epub 2023 Nov 3.

Copper drives prion protein phase separation and modulates aggregation

Affiliations

Copper drives prion protein phase separation and modulates aggregation

Mariana Juliani do Amaral et al. Sci Adv. .

Abstract

Prion diseases are characterized by prion protein (PrP) transmissible aggregation and neurodegeneration, which has been linked to oxidative stress. The physiological function of PrP seems related to sequestering of redox-active Cu2+, and Cu2+ dyshomeostasis is observed in prion disease brain. It is unclear whether Cu2+ contributes to PrP aggregation, recently shown to be mediated by PrP condensation. This study indicates that Cu2+ promotes PrP condensation in live cells at the cell surface and in vitro through copartitioning. Molecularly, Cu2+ inhibited PrP β-structure and hydrophobic residues exposure. Oxidation, induced by H2O2, triggered liquid-to-solid transition of PrP:Cu2+ condensates and promoted amyloid-like PrP aggregation. In cells, overexpression of PrPC initially protected against Cu2+ cytotoxicity but led to PrPC aggregation upon extended copper exposure. Our data suggest that PrP condensates function as a buffer for copper that prevents copper toxicity but can transition into PrP aggregation at prolonged oxidative stress.


Figures

Fig. 1.
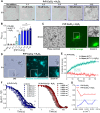
Fig. 1.. PrPC condensation at cell-cell contacts is promoted by Cu2+.
(A) Confocal images of HEK293 cells transfected with PrPC-YFP-GPI or YFP-GPI showing localization at the plasma membrane and accumulation of PrPC-YFP-GPI at cell-cell interfaces in untreated (top) or Cu2+-treated (300 μM CuCl2) cells (bottom). White lines across cell membranes (M1 and M2; not in contact with other cells) and interfaces (I) indicate positions and numbering of line plots in (B). Arrows mark the start and direction of measurement. (B) Line plots from (A) showing fluorescence intensity of individual membranes (M1 and M2) and the interface (I) of two adjacent cells treated with Cu2+ or not. (C) Fluorescence quantification at cell-cell interface relative to the sum of intensities measured for individual membranes of the contacting cells [II/(IM1 + IM2)]. Data shown as mean ± SEM, n = 20 to 23 measurements per group, one-way analysis of variance (ANOVA) (Tukey). ****P < 0.0001 and ***P < 0.001; ns, not significant. (D) FRAP shows a lower recovery of PrPC-YFP-GPI at individual cell membranes or cell-cell interfaces upon Cu2+ treatment, indicating less molecular diffusion, as opposed to YFP-GPI with Cu2+ treatment or not. n = 23 to 26 bleached circular areas per group. Fitting to obtain times to half recovery (t1/2; inside rectangles) are shown in black. Insets: Examples of bleached circular areas from PrPC-YFP-GPI in the individual cell membranes (top) or interfaces (bottom). Pseudocolored intensity scale shown on the right. (E) Cell viability assay of HEK293 cells transfected with PrPC-YFP-GPI or GFP treated with increasing concentrations of CuCl2 for 1 hour. *P < 0.05 and ***P < 0.001. Data shown as mean ± SEM, n = 3 independent replicates, one-way ANOVA (Sidak). (F) Time-lapse confocal imaging of Cu2+-treated cells showing liquid-like fission (i) and fusion (ii and iii) of small PrPC-YFP-GPI clusters at the membrane or in the cytosol (iv). Time points indicated inside micrographs. Scale bars, 20 μm (A), 1 μm (D), and 5 μm (F). a.u., arbitrary units. PM, plasma membrane.
Fig. 2.
Fig. 2.. Cu2+ drives recombinant PrP condensation.
(A) Phase separation prediction of PrP (UniProt ID P04156) by FuzDrop (37) (top, gray line, left axis), catGRANULE (38) (top, black line, right axis), ParSe (39) (bottom, gray line, left axis), and PScore (40) (bottom, black line, right axis). Middle: Amino acid sequence of PrP N-terminal domain (23 to 120) with indicated copper-coordinating His. Five octarepeats (blue shading) are predicted to be LARKS. Top inset: PrP C-terminal domain structure (residues 121 to 231, PDB 1XYX) with Cu2+-coordinating His side chains in blue. Bottom inset: Octarepeats structure (residues 23 to 106, PDB 2KKG) with evenly interspaced Trp (green) and Tyr (white) side chains that potentially contribute to phase separation. (B) Micrographs of PrP at 25 μM incubated for 2 hours with 25 to 200 μM CuCl2. (C) Turbidity [absorption at 350 nm (A350 nm)] of 10 μM PrP at increasing CuCl2 concentration. (D) Structure of Zincon:Cu2+ complex. (E) Microscopy images of 25 μM PrP with 200 μM CuCl2 captured by a color high-resolution camera followed by Zincon addition. Zoomed-in of numbered regions are shown. (F) FRAP of 10 μM PrP (0.1% Alexa Fluor 647–labeled protein) with 80 μM CuCl2 (1:8 molar ratio), performed immediately after sample preparation. Data shown as mean ± SEM (n = 3 condensates). Time to half recovery (t1/2) is shown in the rectangle. (G) Turbidity of PrP:CuCl2 (1:8 molar ratio) condensation upon increasing 1,6-HD concentrations (measured after 6 min). (H) Differential interference contrast (DIC) and fluorescence images of 20 μM PrP (0.1% Alexa Fluor 647–labeled protein) with 160 μM CuCl2 (1:8 molar ratio) show wetting of poly-d-lysine–coated glass surfaces over time. Data in (C) and (G) shown as mean ± SD (n = 3), one-way ANOVA (Tukey). ****P < 0.0001 and **P < 0.01. Scale bars, 20 μm (B and H), 50 μm (E), and 2 μm (F).
Fig. 3.
Fig. 3.. H2O2 treatment triggers PrP:Cu2+ liquid-to-solid phase transition.
(A) Phase contrast images of 25 μM PrP incubated with increasing concentrations of CuCl2 in the presence of 10 mM H2O2 (2-hour incubation). (B) Turbidity (A350 nm) of 10 μM PrP at increasing CuCl2 concentrations (6 min after sample preparation) in the presence of H2O2. Data shown as mean ± SD, n = 3. (C) Phase contrast (left) and fluorescence (right) images of 25 μM PrP with 200 μM CuCl2 and 10 mM H2O2, stained with SYPRO orange after 30 min. Zooms of marked regions are shown on the right. (D) DIC (left) and fluorescence (right; intrinsic blue fluorescence characteristic of amyloids) images of 25 μM PrP incubated with 200 μM CuCl2 and 10 mM H2O2 after 2-hour incubation. Marked regions are zoomed. (E) FRAP of 10 μM PrP with 80 μM CuCl2 in 20 mM Hepes (pH 7.4) (green; t1/2 in seconds is shown in the rectangle) and upon addition of 10 mM H2O2 (red). FRAP recorded immediately after sample preparation. Data shown as mean ± SEM, n = 3 condensates. (F) XPCS autocorrelation functions for increasing q values of PrP:Cu2+ (i) and PrP:Cu2+ + H2O2 (ii). (G) XPCS-derived Kohlrausch-Williams-Watts (KWW) exponent, γ, over the recorded q range for PrP:Cu2+ (blue) and PrP:Cu2+ + H2O2 (red). All experiments were performed at 25°C in PhysB, unless otherwise stated. Scale bars, 20 μm (A) and 10 μm (C and D).
Fig. 4.
Fig. 4.. Cu2+ reduces PrP misfolding and, together with H2O2, results in dityrosine-rich PrP aggregates.
(A) Experimental setup to examine PrP seeded aggregation in vitro. PrP (25 μM) was incubated with 0.1% seeds (pre-aggregated PrP obtained from denaturation protocol with 1 M guanidinium-HCl, 3 M urea) under continuous agitation at 42°C for 48 hours in the presence or absence of CuCl2 (200 μM), H2O2 (10 mM), or both. (B) DLS analysis of aggregated 48-hour samples (diluted to 1 μM for measurements). Mass percentage of each species is plotted, and Rh is shown within bars. Data shown as mean ± SD from 10 acquisitions at 25°C. (C) Negative-stain TEM at different magnifications. Blue arrowheads indicate circular condensate-like structures. Zoom-in of numbered regions are shown in the middle. (D) SYPRO orange emission spectra (excitation, 495 nm; emission, 535 to 665 nm) of 48-hour aggregated samples. The illustrations show a β sheet–rich structure and an unfolded protein, which are probed by SYPRO orange. (E) Dityrosine intrinsic fluorescence (excitation, 325 nm; emission, 350 to 500 nm) of 48-hour aggregated samples. Intramolecular (between two vicinal tyrosine residues) and intermolecular (inset illustration) dityrosine cross-links can be formed in oxidative conditions (catalyzed by Cu2+/H2O2). Legend applies to (D) and (E). All samples were prepared in PhysB pH 7.2. Scale bars are indicated inside images.
Fig. 5.
Fig. 5.. Long-term exposure to Cu2+ leads to PrPC-YFP-GPI amyloid-like aggregates in cells.
(A) Live cell imaging of HEK293 cells transfected with PrPC-YFP-GPI. Cells treated with 300 μM CuCl2 for 3 hours (middle and bottom rows) showed AmyTracker680-positive aggregates at the cell surface. Bottom: Individual cell with PrP aggregates. White lines indicate positions of line profiles shown in (B). (B) Line profiles through AmyTracker-positive PrP aggregates at the surface of the cell shown in (A, bottom). (C) Formation of spherical hollow structures with PrPC-YFP-GPI in the surrounding membrane after 3 hours of Cu2+-treatment. Zoom-in of marked regions are shown on the right. (D) Schematic diagram on the role of copper in PrPC condensation and oxidation-induced aggregation. PrP:Cu2+ condensation at the cell surface buffers Cu2+ concentration by sequestering redox-active excessive copper. This reduces the oxidative burden and prevents cellular damage. In the presence of ROS, further stimulated through Fenton reactions of Cu2+/H2O2, PrP:Cu2+ condensates transition into a gel-like state (less molecular mobility inside condensates) that inhibits functional Cu2+ sequestering by PrP. Moreover, ROS trigger PrP unfolding (exposure of hydrophobic surfaces), drive β-cleavage that produces aggregation-prone C-terminal PrP fragments, and enhance dityrosine cross-linking, altogether converting PrP into amyloid-like aggregates. In summary, PrP controls copper homeostasis and prevents ROS generation through phase separation, but abnormally high or prolonged ROS can result in aberrant PrP condensation and pathological aggregation. Scale bars are indicated inside images, and zoom-ins correspond to 2 μm.

References

    1. S. B. Prusiner, Prions. Proc. Natl. Acad. Sci. 95, 13363–13383 (1998). - PMC - PubMed
    1. B. Caughey, G. S. Baron, B. Chesebro, M. Jeffrey, Getting a grip on prions: Oligomers, amyloids, and pathological membrane interactions. Annu. Rev. Biochem. 78, 177–204 (2009). - PMC - PubMed
    1. S. J. Kim, R. S. Hegde, Cotranslational partitioning of nascent prion protein into multiple populations at the translocation channel. Mol. Biol. Cell 13, 3775–3786 (2002). - PMC - PubMed
    1. C. J. Johnson, P. U. P. A. Gilbert, M. Abrecht, K. L. Baldwin, R. E. Russell, J. A. Pedersen, J. M. Aiken, D. McKenzie, Low copper and high manganese levels in prion protein plaques. Viruses 5, 654–662 (2013). - PMC - PubMed
    1. O. Milhavet, H. E. M. McMahon, W. Rachidi, N. Nishida, S. Katamine, A. Mangé, M. Arlotto, D. Casanova, J. Riondel, A. Favier, S. Lehmann, Prion infection impairs the cellular response to oxidative stress. Proc. Natl. Acad. Sci. U.S.A. 97, 13937–13942 (2000). - PMC - PubMed