. 2023 Nov 3;9(44):eadh3642.
doi: 10.1126/sciadv.adh3642. Epub 2023 Nov 3.

POLE3 is a repressor of unintegrated HIV-1 DNA required for efficient virus integration and escape from innate immune sensing

Affiliations

POLE3 is a repressor of unintegrated HIV-1 DNA required for efficient virus integration and escape from innate immune sensing

Suzie Thenin-Houssier et al. Sci Adv. .

Abstract

Unintegrated retroviral DNA is transcriptionally silenced by host chromatin silencing factors. Here, we used the proteomics of isolated chromatin segments method to reveal viral and host factors associated with unintegrated HIV-1DNA involved in its silencing. By gene silencing using siRNAs, 46 factors were identified as potential repressors of unintegrated HIV-1DNA. Knockdown and knockout experiments revealed POLE3 as a transcriptional repressor of unintegrated HIV-1DNA. POLE3 maintains unintegrated HIV-1DNA in a repressive chromatin state, preventing RNAPII recruitment to the viral promoter. POLE3 and the recently identified host factors mediating unintegrated HIV-1 DNA silencing, CAF1 and SMC5/SMC6/SLF2, show specificity toward different forms of unintegrated HIV-1DNA. Loss of POLE3 impaired HIV-1 replication, suggesting that repression of unintegrated HIV-1DNA is important for optimal viral replication. POLE3 depletion reduces the integration efficiency of HIV-1. POLE3, by maintaining a repressive chromatin structure of unintegrated HIV-1DNA, ensures HIV-1 escape from innate immune sensing in primary CD4+ T cells.


Figures
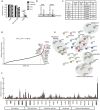
Fig. 1.
Fig. 1.. Identification of factors accumulating on uHIV-1 DNA and involved in its silencing.
(A) qPCR analysis of input, FT, and eluate fractions from PICh isolated from cells infected with HIV-Luc at 9 hpi. Results are presented as quantities relative to input from large-scale experiment with triplicate samples. Enrichment of vDNA over β-globin (full line) and α-satellite (dashed line) is shown. (B) Western blot analysis monitoring the presence of the viral IN in the input and eluate fractions. (C) Mass spectrometry results for the factors identified by PICh using infected (INF) and noninfected (NI) cells. Number and summed intensity of the peptides matched to viral and host proteins known to play a role in HIV infection or associated with vDNA are presented. (D) siRNA screen of host factors silencing uHIV-1 DNA transcription. HeLa cells were transfected with a siRNA library composed of a pool of siRNAs targeting each gene and infected with the HIV-Luc IND116A virus. Luciferase assays were performed at 48 hpi. The results are presented as luciferase activity relative to nontargeting (NT) siRNA–transfected cells from two independent experiments performed with triplicate samples. Factors to the right of the dotted line were used for interaction network using STRING database. Red indicates factors within functional clusters. (E) Protein-protein interaction network of the top-ranked factors identified in (D). Nodes represent proteins. Solid and dotted edges indicate interactions within and between clusters, respectively. Nodes are color-coded based on functional clusters generated by STRING. (F) Validation of candidate proteins highlighted in (E). HeLa cells were transfected with four individual siRNAs targeting each gene and infected with HIV-Luc IND116A. Luciferase assay was performed at 48 hpi. Results are presented as luciferase activity relative to that in NT siRNA-transfected cells. Mean ± SD values of two independent experiments with triplicate samples are plotted.
Fig. 2.
Fig. 2.. POLE3 and POLE4 are transcriptional repressors of uHIV-1 DNA.
(A and B) Protein expression analysis and luciferase assay results in POLE3 (A) and POLE4 (B) KO cells infected with HIV-Luc IND116A. The results are presented as luciferase activity relative to that in NT single guided RNA (sgRNA) cells. (C and D) Protein expression analysis (C) and luciferase assay (D) results in POLE3 KO HeLa cells with stable exogenous expression of POLE3 WT, POLE3 F44D, or POLE3 ΔC infected with HIV-Luc IND116A. The results are presented as luciferase activity relative to that in NT sgRNA cells in one representative experiment with triplicate samples. (E) Nascent HIV RNA expression from uHIV-1 DNA at 48 hpi in POLE3 and POLE4 KD HeLa cells. The results are presented as nascent HIV RNA relative to NT siRNA. (F to I) ChIP assay using NT (gray) and POLE3 (white) KD HeLa cells infected with HIV-Luc IND116A for 48 hours. qPCR analysis was performed using the indicated primers. (J) CUT&RUN using NT (gray) and POLE3 (white) KD HeLa cells infected with HIV-Luc IND116A for 48 hours. qPCR analysis was performed using the indicated primers. (K) ChIP assay using NT (gray) and POLE4 (white) KO HeLa cells infected with HIV-Luc IND116A for 48 hours. qPCR analysis was performed using the indicated primers. (L to O) Quantification of total HIV-1 DNA (L and N) and 2-LTR circles (M and O) in POLE3 KD HeLa cells infected with HIV-Luc IND116A at 9 hpi (L and M) and 48 hpi (N and O). The results are presented as quantities relative to those in NT siRNA-transfected cells. Mean ± SD values of at least three independent experiments are plotted. *P < 0.05, **P < 0.01, ***P < 0.001; independent Student’s t test. NS, not significant.
Fig. 3.
Fig. 3.. POLE3 silences uHIV-1 DNA transcription in primary CD4+ T cells.
(A and B) PHA–IL-2–activated primary CD4+ T cells from four healthy donors were electroporated with NT and POLE3 siRNAs and then infected with VSV-G pseudotyped HIV-Luc IND116A. POLE3 expression in whole-cell extracts on the day of infection was analyzed by immunoblotting using an anti-POLE3 antibody (A). Luciferase assays were performed at 48 hpi (B). The results are presented as luciferase activity relative to that in NT siRNA-transfected cells; the mean ± SD values of triplicate samples from four healthy donors are plotted. (C and D) ChIP assays were performed at 48 hpi using anti-H3 (C) and anti-RNAPII antibodies (D). qPCR analysis was performed using specific primers for Nuc1 and the GAPDH promoter (control genomic region). The results are presented as the fold change between NT siRNA-transfected (gray) and POLE3 siRNA-transfected (white) cells, and the mean ± SD values of five independent experiments are plotted. (E to H) POLE3 silences uHIV-1 DNA transcription in a VPR-independent manner. PHA–IL-2–activated primary CD4+ T cells from three healthy donors were electroporated with NT and POLE3 siRNAs and then infected with VSV-G pseudotyped HIV-Luc IND64A with (G) or without (H) VPR expression. The expression of POLE3 in whole-cell extracts on the day of infection was analyzed by immunoblotting (E). Luciferase assays were performed at 48 hpi (F to H). The results are presented as luciferase activity relative to that in NT siRNA-transfected cells; the mean ± SD values of each duplicate from three healthy donors are plotted. *P < 0.05, **P < 0.01, ***P < 0.001; independent Student’s t test.
Fig. 4.
Fig. 4.. POLE3 does not affect expression from plasmid DNA.
(A to E) Effects of POLE3, SMC5, SLF2, and CAF1 KD on expression from plasmid DNA. POLE3, SMC5, and CAF1A expression from whole-cell extracts on the day of plasmid transfection was analyzed by immunoblotting. The amount of SLF2 mRNA transcript on the day of plasmid transfection was measured by RT-qPCR using two different primer sets, as no antibody was available for Western blot analysis. A luciferase assay using POLE3, SMC5, SLF2, and CAF1A KD HeLa cells transfected with pLTR-Luc (B), pCMV-Luc (C), pHIV-Luc (D), and pHIV-Luc Tat (E) was performed 24 hours posttransfection. The results are presented as luciferase activity relative to that in NT siRNA-transfected cells, and the mean ± SD values of four independent experiments are plotted. (F to I) Silencing of uHIV-1 DNA by POLE3 in the absence of the 2-LTR circle form. Expression of POLE3 protein in Nalm-6 (Lig4 +/+ or −/−) cells electroporated with POLE3 siRNA (F). Luciferase assays were performed in Nalm-6 (Lig4 +/+ or −/−) POLE3 KD cells infected with VSV-G pseudotyped HIV-Luc IND116A at 48 hpi (G). The results are presented as luciferase activity relative to that in Nalm-6 (Lig4 +/+) cells electroporated with NT siRNA, and the mean ± SD values of four independent experiments are plotted. Quantification of total HIV DNA (H) and 2-LTR circles (I) in Nalm-6 (Lig4 +/+ or −/−) POLE3 KD cells infected with HIV-Luc IND116A at 48 hpi. The results are presented as the copy number per cell, and the mean ± SD values of two independent experiments are plotted. *P < 0.05, **P < 0.01, ***P < 0.001; independent Student’s t test.
Fig. 5.
Fig. 5.. Depletion of POLE3 markedly impairs HIV-1 replication kinetics.
(A) Effect of POLE3 depletion on HIV-1 replication in HeLa-P4 cells. POLE3 KO HeLa-P4 (black circle) and control (white circle) cells were infected with replication-competent HIV-1 (NL4.3) at two different MOIs. Supernatants were collected every 3 days. HIV-1 spreading was quantified by measurement of the p24 concentration in the culture medium. (B to D) Effect of POLE3 depletion on HIV-1 integration in HeLa-P4 cells. Quantification of total HIV DNA (B), 2-LTR circles (C), and integrated provirus (D) in HeLa-P4 POLE3 KO cells infected with replicative HIV-1 (NL4.3; MOI = 0.5). The results are presented as quantities relative to those in control cells at 12 hpi (C and D) or 24 hpi (E), and the mean ± SD values of two independent experiments with triplicate samples are plotted. (E) Effect of POLE3 depletion on HIV-1 replication in SupT1 cells. POLE3 KD (black circle and square) and control (white circle and square) SupT1 cells were infected with replication-competent HIV-1 (NL4.3) at two different MOIs. Supernatants were collected every 3 days. HIV-1 spreading was quantified by measurement of the p24 concentration in the culture medium. (F) Effect of POLE3 KD on HIV-1 integration in SupT1 cells. Integrated HIV DNA was quantified using samples from the HIV-1 spreading assay (MOI 0.05) at 3 days postinfection (dpi). The results are presented as quantities relative to those in NT control cells. **P < 0.01, ***P < 0.001; independent Student’s t test. ND, not determined.
Fig. 6.
Fig. 6.. Depletion of POLE3 induces an innate immune response in primary CD4+ T cells.
(A and B) PHA–IL-2–activated primary CD4+ T cells isolated from two healthy donors were electroporated with NT (white) and POLE3 (gray) siRNAs and then infected with VSV-G pseudotyped HIV-Luc INwt or IND116A in duplicate. POLE3 expression in whole-cell extracts on the day of infection was analyzed by immunoblotting using an anti-POLE3 antibody. IFNβ, ISG15, IFIT1, and IFIT2 mRNA expression was measured by RT-qPCR at 24 hpi. (C to E) PHA–IL-2–activated primary CD4+ T cells isolated from 10 additional donors were infected with HIV-Luc IND116A. ISG15 (C), IFIT1 (D), and IFIT2 (E) mRNA expression was measured by qPCR at 24 hpi. Duplicate infections for each donor are presented. The results are presented relative to siNT-transfected noninfected cells (NI). *P < 0.05, **P < 0.01, ***P < 0.001, ****P < 0.0001; Mann-Whitney U test.

References

    1. R. D. Sloan, M. A. Wainberg, The role of unintegrated DNA in HIV infection. Retrovirology 8, 52 (2011). - PMC - PubMed
    1. M. Lusic, R. F. Siliciano, Nuclear landscape of HIV-1 infection and integration. Nat. Rev. Microbiol. 15, 69–82 (2017). - PubMed
    1. S. Machida, D. Depierre, H.-C. Chen, S. Thenin-Houssier, G. Petitjean, C. M. Doyen, M. Takaku, O. Cuvier, M. Benkirane, Exploring histone loading on HIV DNA reveals a dynamic nucleosome positioning between unintegrated and integrated viral genome. Proc. Natl. Acad. Sci. U.S.A. 117, 6822–6830 (2020). - PMC - PubMed
    1. F. K. Geis, S. P. Goff, Unintegrated HIV-1 DNAs are loaded with core and linker histones and transcriptionally silenced. Proc. Natl. Acad. Sci. U.S.A. 116, 23735–23742 (2019). - PMC - PubMed
    1. S. P. Goff, Silencing of Unintegrated Retroviral DNAs. Viruses. 13, 2248 (2021). - PMC - PubMed