. 2024 Jan 3;12(1):107-119.
doi: 10.1158/2326-6066.CIR-23-0061.

Tyrosine Kinase Inhibition Activates Intratumoral γδ T Cells in Gastrointestinal Stromal Tumor

Affiliations

Tyrosine Kinase Inhibition Activates Intratumoral γδ T Cells in Gastrointestinal Stromal Tumor

Mark S Etherington et al. Cancer Immunol Res. .

Abstract

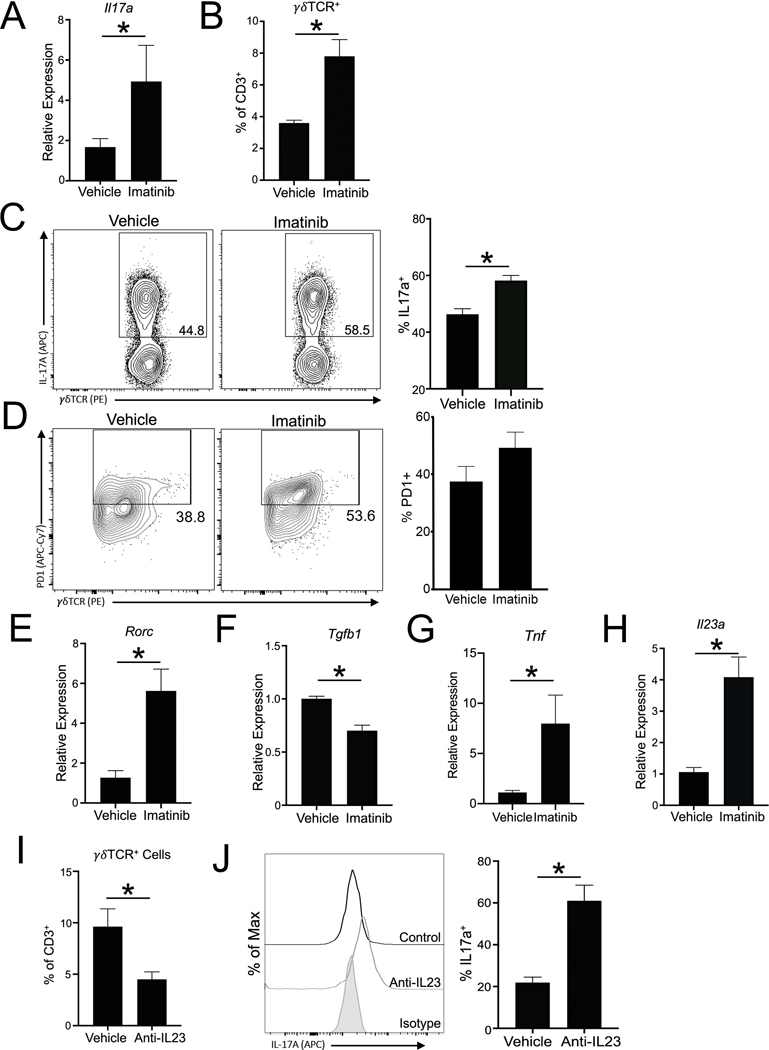
γδ T cells are a rare but potent subset of T cells with pleiotropic functions. They commonly reside within tumors but the response of γδ T cells to tyrosine kinase inhibition is unknown. To address this, we studied a genetically engineered mouse model of gastrointestinal stromal tumor (GIST) driven by oncogenic Kit signaling that responds to the Kit inhibitor imatinib. At baseline, γδ T cells were antitumoral, as blockade of either γδ T-cell receptor or IL17A increased tumor weight and decreased antitumor immunity. However, imatinib therapy further stimulated intratumoral γδ T cells, as determined by flow cytometry and single-cell RNA sequencing (scRNA-seq). Imatinib expanded a highly activated γδ T-cell subset with increased IL17A production and higher expression of immune checkpoints and cytolytic effector molecules. Consistent with the mouse model, γδ T cells produced IL17A in fresh human GIST specimens, and imatinib treatment increased γδ T-cell gene signatures, as measured by bulk tumor RNA-seq. Furthermore, tumor γδ T cells correlated with survival in patients with GIST. Our findings highlight the interplay between tumor cell oncogene signaling and antitumor immune responses and identify γδ T cells as targets for immunotherapy in GIST.


Figures

Fig. 1.
Fig. 1.. Phenotypically distinct γδ T cells infiltrate GIST.
(A) γδ T cells were identified in KitV558Δ/+ tumors by flow cytometry. (B) Intracellular IL17A and TNFα staining across KitV558Δ/+ tumor-infiltrating T cells by flow cytometry. (C) Tumor-infiltrating T cells in KitV558Δ/+ mice were analyzed for surface markers and transcription factors. γδ T cells in the tumor, spleen, and blood of KitV558Δ/+ mice were analyzed for (D) γ variable chain expression, (E) RORγT, CD44, Il17a, or (F) CD27. Data are representative of 2 experiments each, 4 mice/experiment. Data represent mean ± SEM; p values were calculated using a two-sided Student’s t test; *, P < 0.05.
Fig. 2.
Fig. 2.. Single-cell transcriptomics define the phenotype of tumor-infiltrating γδ T cells.
Relative intratumoral T cell expression of (A) Cd8a, Cd4, and Trdc (black arrow denotes γδ T cells), (B) Rorc, Zbtb16, Sox13, (C) Maf, (D) Il23r, (E) Ccr6, Cxcr6, Ccr2, (F) Pdcd1, Cd274, and (G) Il17a. (H) Heatmap displaying the per-cell relative expression of distinguishing genes across all CD4+, CD8+, and γδ T cells. (I) Relative expression of Tcrg-V6, (J) Cd163l1, and (K) Cd27. UMAP plots colored by single-cell RNA transcript enrichment for each marker listed. UMAP represents 20,507 T cells from 6 KitV558Δ/+ mouse tumors.
Fig. 3.
Fig. 3.. IL17A exerts tumor control in mouse GIST.
Tumor weight in KitV558Δ/+ mice treated with 2 weeks of (A) anti-γδ TCR or (B) anti-IL17A or isotype antibody. (C) Representative KitV558Δ/+ tumors treated with isotype or anti-IL17a. (D) Relative gene expression of Il10 in bulk tumors from KitV558Δ/+ mice treated with 2 weeks of anti-IL17A or isotype control. (E) Intratumoral T regulatory cells, defined by CD25+FoxP3+ staining, in KitV558Δ/+ mice treated with anti-IL17a or isotype. (F) CD69 expression on intratumoral CD8 T cells in KitV558Δ/+ mice treated with anti-IL17A or isotype. (G) IL17RA staining across immune cell subtypes in untreated KitV558Δ/+ tumors. (H) Relative gene expression of Tnf in bulk tumors of KitV558Δ/+ mice treated with anti-IL17A or isotype. (I) Tumor weight in KitV558Δ/+ mice treated with anti-TNFα antibody or isotype. The anti-γδ TCR experiment had 7 mice per group (14 mice in total) and the anti-IL17A experiment had 11 mice per group (22 mice in total). Data represent mean ± SEM; p values were calculated using a two-sided Student’s t test; *, P < 0.05.
Fig. 4.
Fig. 4.. Tumor cell oncogene inhibition activates γδ T17 cells.
(A) Relative expression of Il17a in bulk tumors of KitV558Δ/+ mice after 1 week of imatinib treatment or vehicle. (B) Prevalence of γδ TCR+ T cells within the tumor-infiltrating T-cell compartment by flow cytometry in KitV558Δ/+ tumors with 1 week of imatinib treatment or vehicle. (C) IL17A expression by flow cytometry in intratumoral γδ T cells from KitV558Δ/+ mice with or without imatinib treatment. (D) PD1 expression by flow cytometry of intratumoral γδ T cells from KitV558Δ/+ mice with imatinib treatment or vehicle. (E–H) Relative expression of Rorc, Tgfb1, Tnf, and Il23a in bulk KitV558Δ/+ tumors after 1 week of imatinib treatment or vehicle. γδ T-cell (I) prevalence and (J) IL17A expression by flow cytometry after two weeks of anti-IL23 or isotype. Representative data from 2 separate experiments, 5 mice/group. Data represent mean ± SEM; p values were calculated using a two-sided Student’s t test; *, P < 0.05.
Fig. 5.
Fig. 5.. Single-cell transcriptomics uncover heterogeneous intratumoral γδ T-cell subsets.
(A) Numbered clusters within the γδ T-cell compartment, based on unsupervised clustering by principal component analysis. (B) Heatmap of differentially expressed genes within each γδ T- cell cluster. (C) Heatmap of gene expression modules, with stratified module enrichment by γδ T-cell clusters. (D) Relative expression, per γδ T cell, of immune checkpoint genes, (E) Gzmb and Areg, and (F) Il17a. (G) Relative expression of genes that define cluster 3. (H) Relative expression, per γδ T cell, of Il23r. (I) Enrichment of γδ T-cell clusters based on treatment status. (J) Relative enrichment, per γδ T cell, of gene sets “HALLMARK TNF⍺ Signaling via NFΚβ”, “BIOCARTA IL17 Pathway”, and “GO Secretory Granule Lumen”. UMAP plots display scRNA-seq profiling of 1,659 γδ T cells from 6 mice as detailed in the methods section.
Fig. 6.
Fig. 6.. γδ T-cell infiltration correlates with treatment in human GIST.
(A) Immunohistochemistry staining of γδ TCR in human GIST tumor at 20x magnification. Inset shows representative isotype staining. Graph shows count of γδ TCR+ staining for 10 high powered fields across 29 freshly obtained human GIST patient specimens. (B) Representative staining by flow cytometry and frequency of γδ TCR staining in freshly isolated human GIST samples (n=4). (C) Intracellular staining by flow cytometry of IL17A of CD4+ and γδT cells from 3 consecutive freshly isolated human GIST samples. (D) Representative staining by flow cytometry and frequency of Vδ1 and Vδ2 in freshly isolated human GIST and paired peripheral blood. Bulk tumor RNA-seq data from 75 human GIST (18) were analyzed for correlation of TRGC1 and TRGC2 with (E) RORC, CD69, and PCDC1; (F) TMEM176B, TMEM176A, and CD163L1; and (G) the effector molecule genes GZMB, PRF1, and TNF. (H) Relative expression of RORC and TRGV10 in human GISTs by imatinib treatment status at the time of surgery. (I) Survival comparison of 32 surgically resected GIST patients (19) based on TRDC, CD4, and CD8A expression grouped as high (n = 16) or low (n=16) expressors. Correlations and correlative significance are demonstrated using Spearman ranked method. Non-correlative data are represented as mean ± SEM. Survival curves and p-value generated using the Kaplan Meier method and log-rank test.

Similar articles

Cited by

References

    1. Joensuu H, DeMatteo RP. The management of gastrointestinal stromal tumors: a model for targeted and multidisciplinary therapy of malignancy. Annu Rev Med 2012;63:247–58 doi 10.1146/annurev-med-043010-091813. - DOI - PMC - PubMed
    1. Sommer G, Agosti V, Ehlers I, Rossi F, Corbacioglu S, Farkas J, et al. Gastrointestinal stromal tumors in a mouse model by targeted mutation of the Kit receptor tyrosine kinase. Proc Natl Acad Sci U S A 2003;100(11):6706–11 doi 10.1073/pnas.1037763100. - DOI - PMC - PubMed
    1. Demetri GD, von Mehren M, Blanke CD, Van den Abbeele AD, Eisenberg B, Roberts PJ, et al. Efficacy and safety of imatinib mesylate in advanced gastrointestinal stromal tumors. N Engl J Med 2002;347(7):472–80 doi 10.1056/NEJMoa020461. - DOI - PubMed
    1. Balachandran VP, Cavnar MJ, Zeng S, Bamboat ZM, Ocuin LM, Obaid H, et al. Imatinib potentiates antitumor T cell responses in gastrointestinal stromal tumor through the inhibition of Ido. Nat Med 2011;17(9):1094–100 doi 10.1038/nm.2438. - DOI - PMC - PubMed
    1. Medina BD, Liu M, Vitiello GA, Seifert AM, Zeng S, Bowler T, et al. Oncogenic kinase inhibition limits Batf3-dependent dendritic cell development and antitumor immunity. J Exp Med 2019. doi 10.1084/jem.20180660. - DOI - PMC - PubMed

Publication types

MeSH terms