. 2023 Dec 4;222(12):e202306123.
doi: 10.1083/jcb.202306123. Epub 2023 Nov 3.

The role of midbody-associated mRNAs in regulating abscission

Affiliations

The role of midbody-associated mRNAs in regulating abscission

Trey Farmer et al. J Cell Biol. .

Abstract

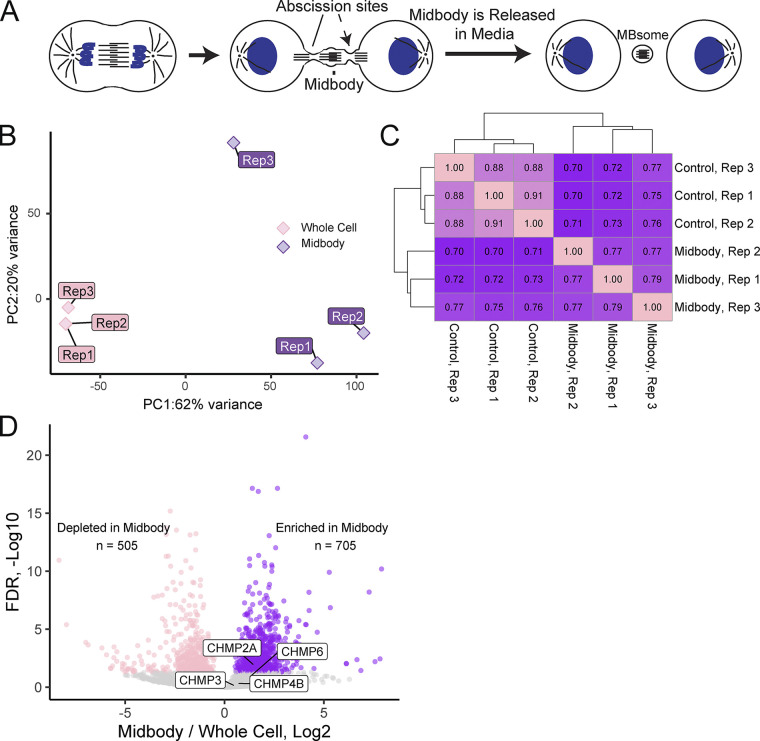
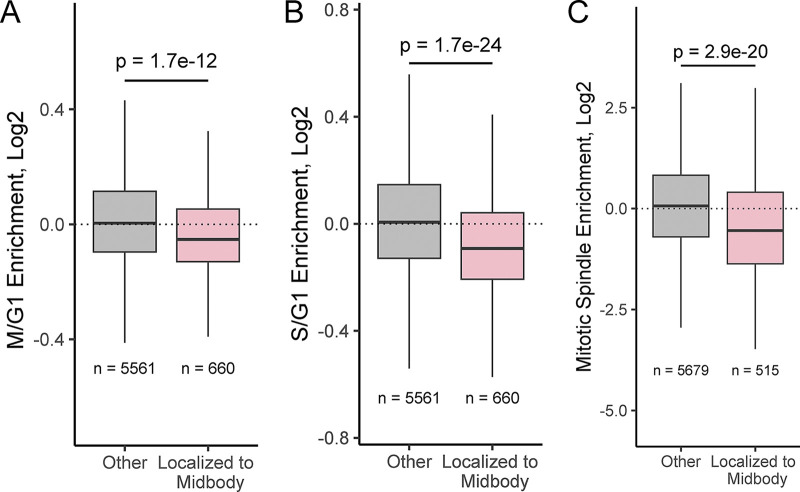
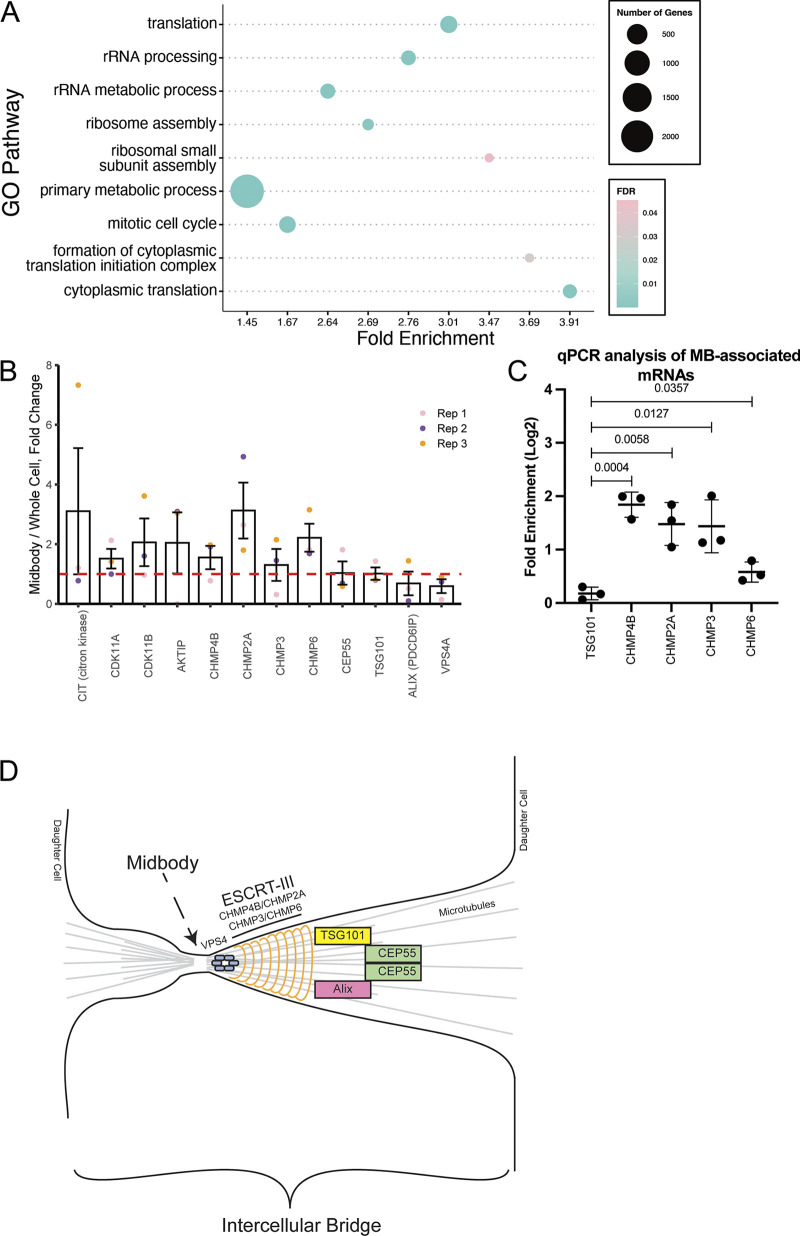
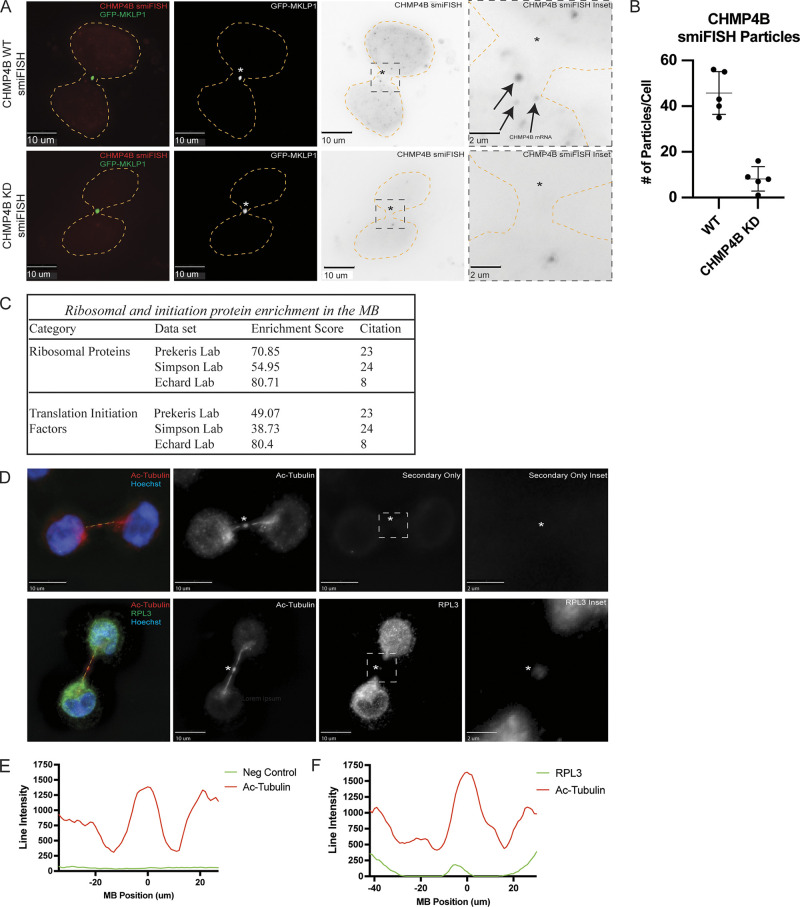
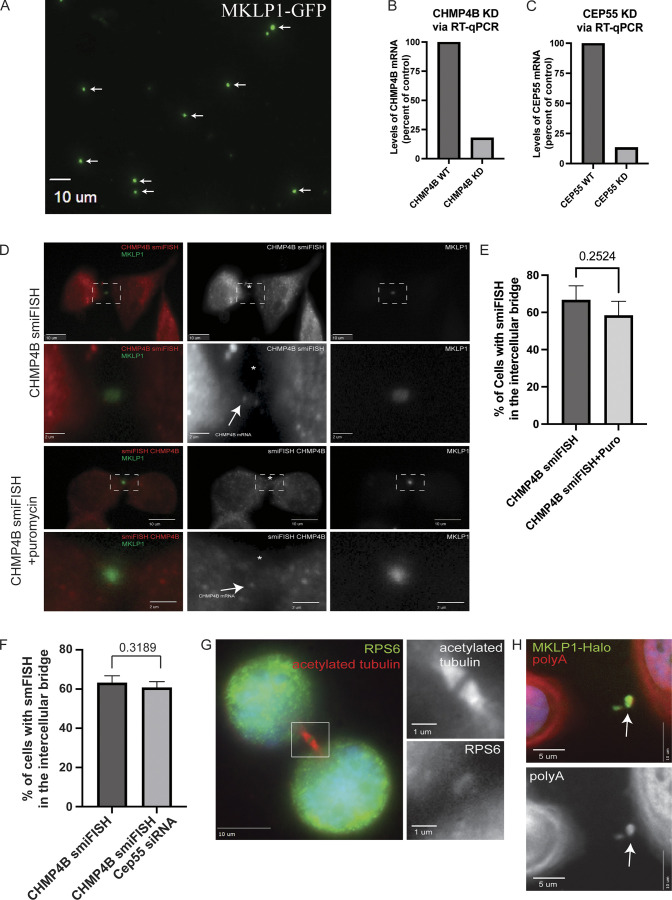
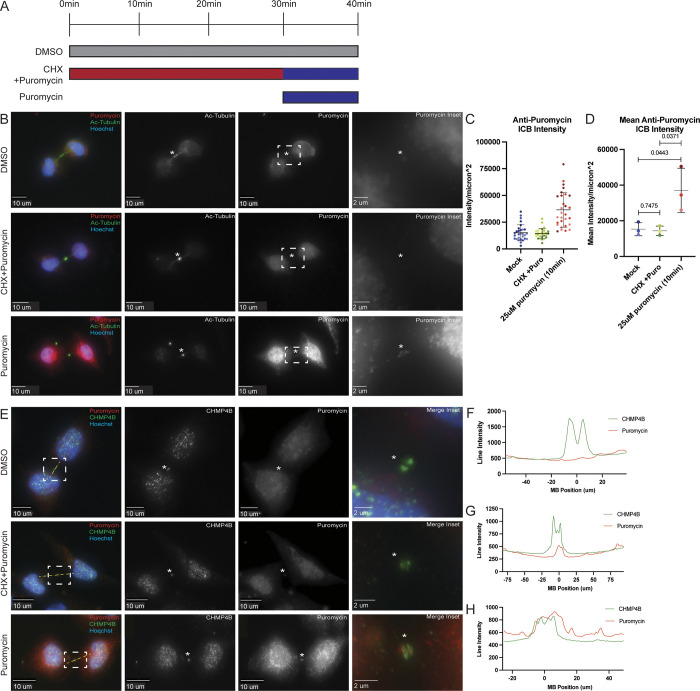
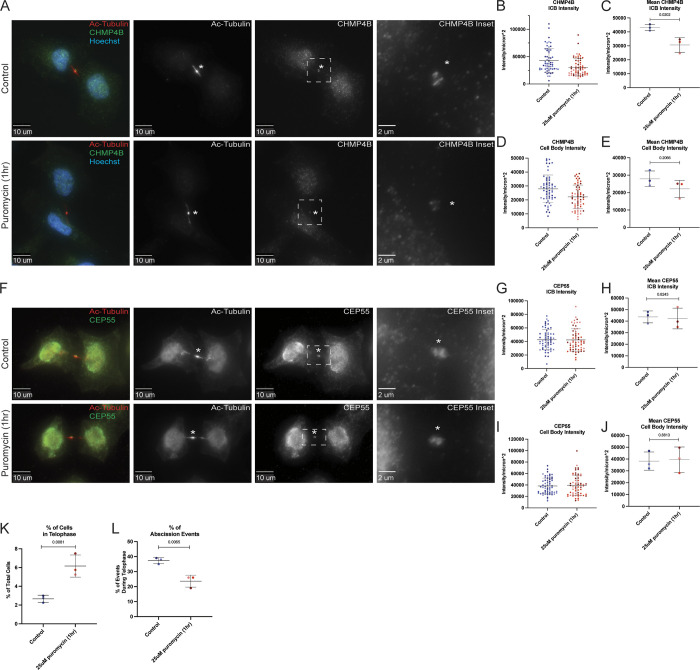
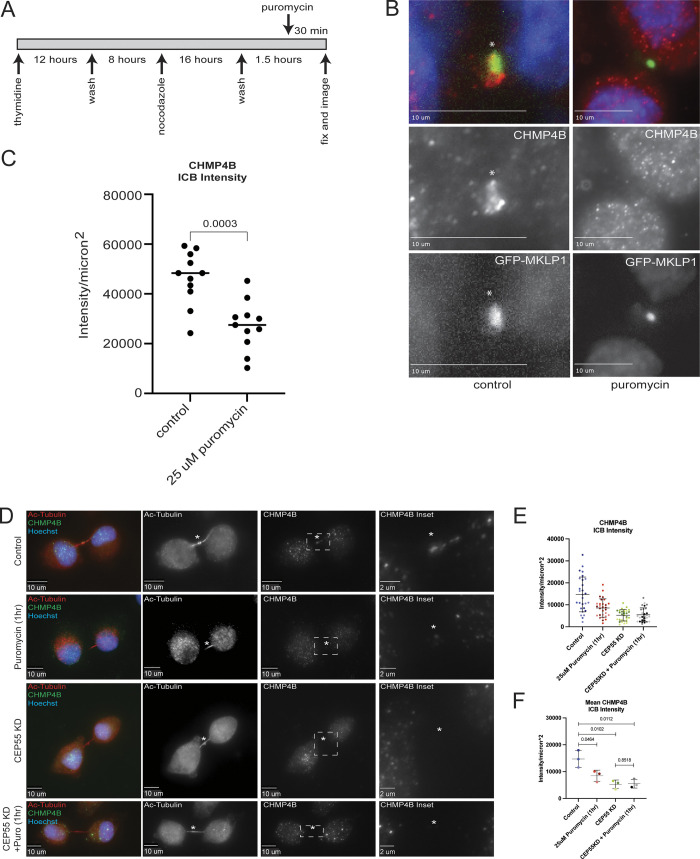
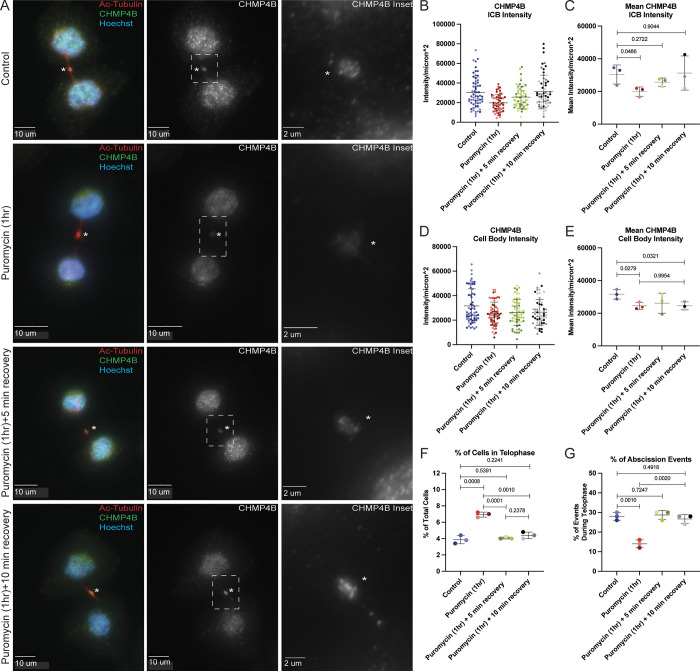
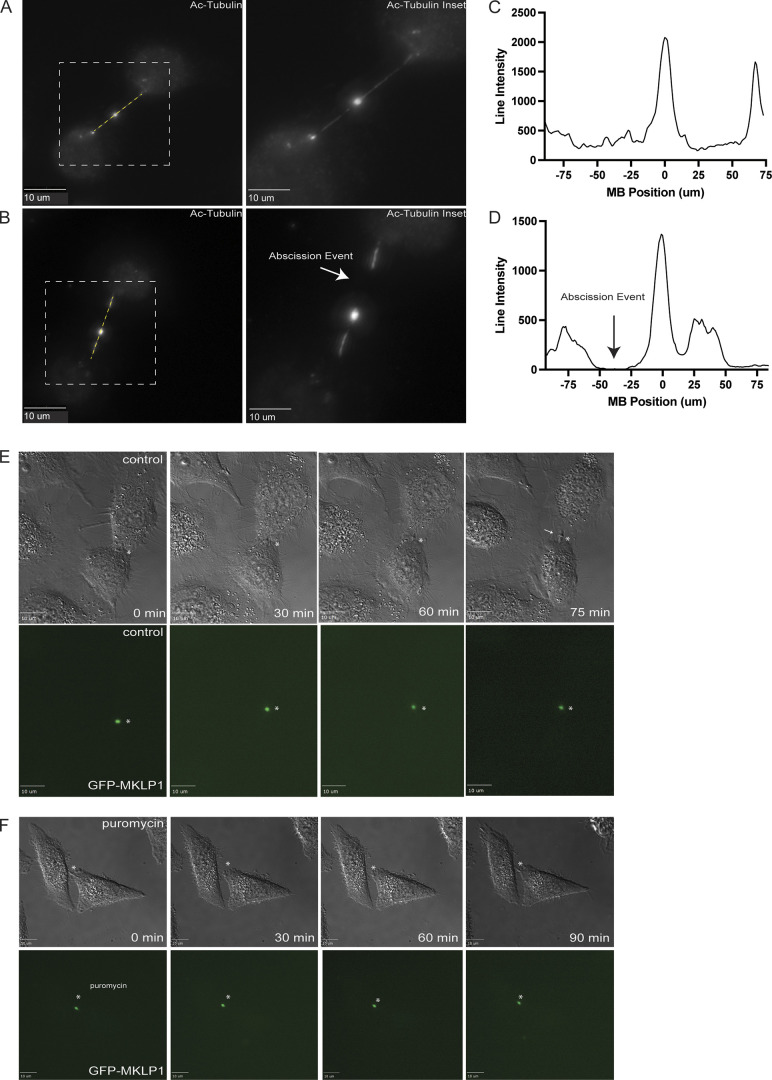
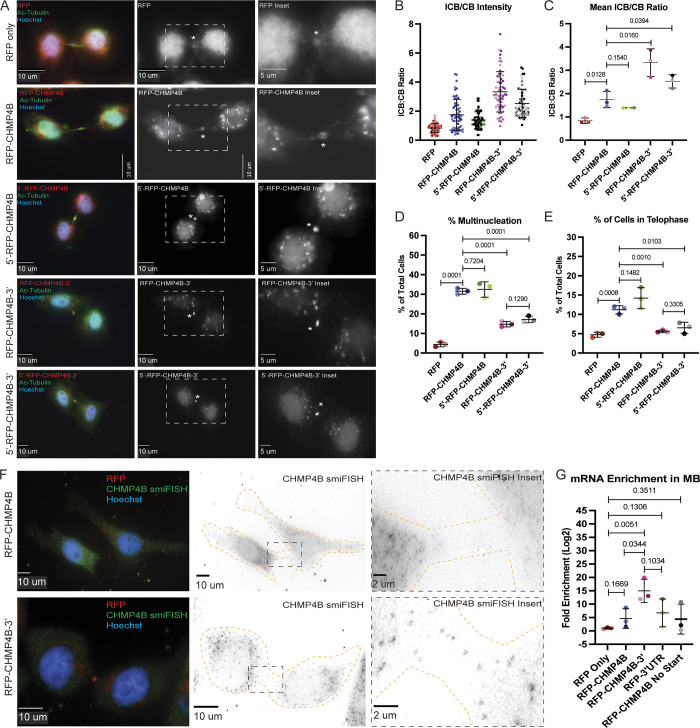
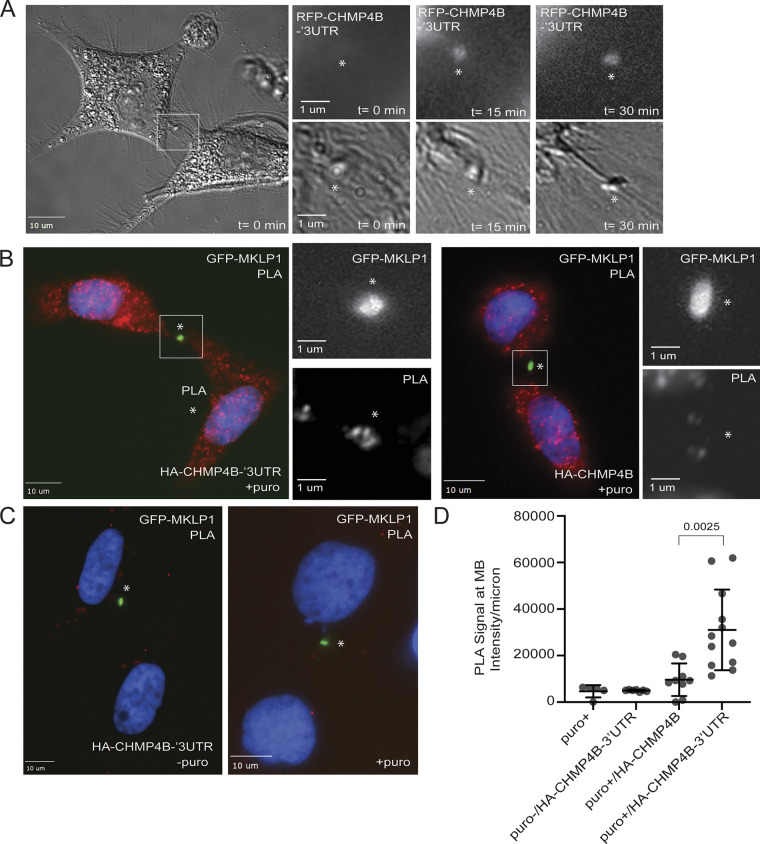
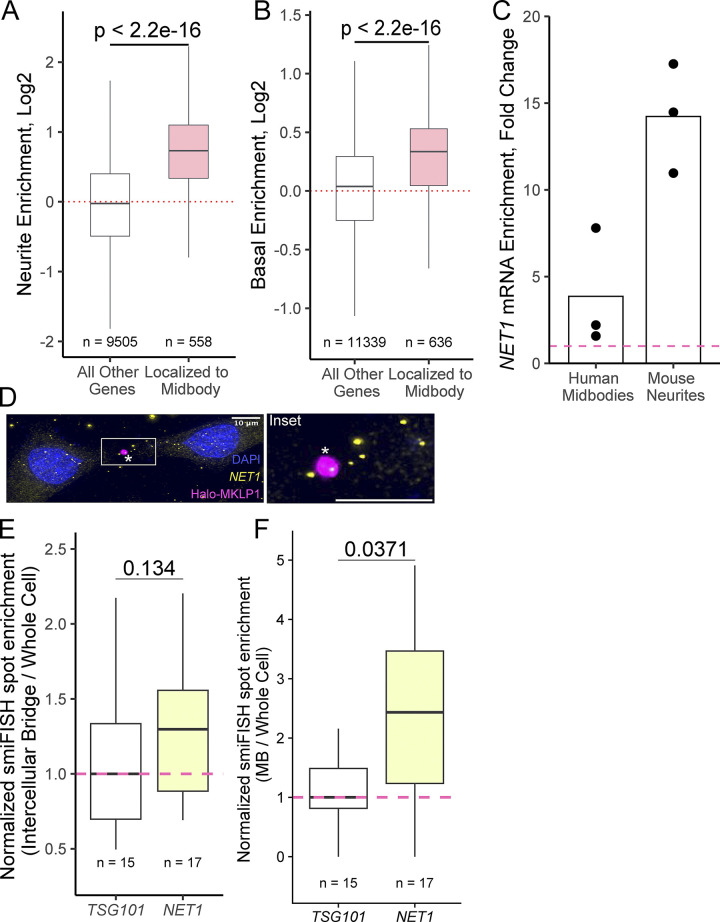
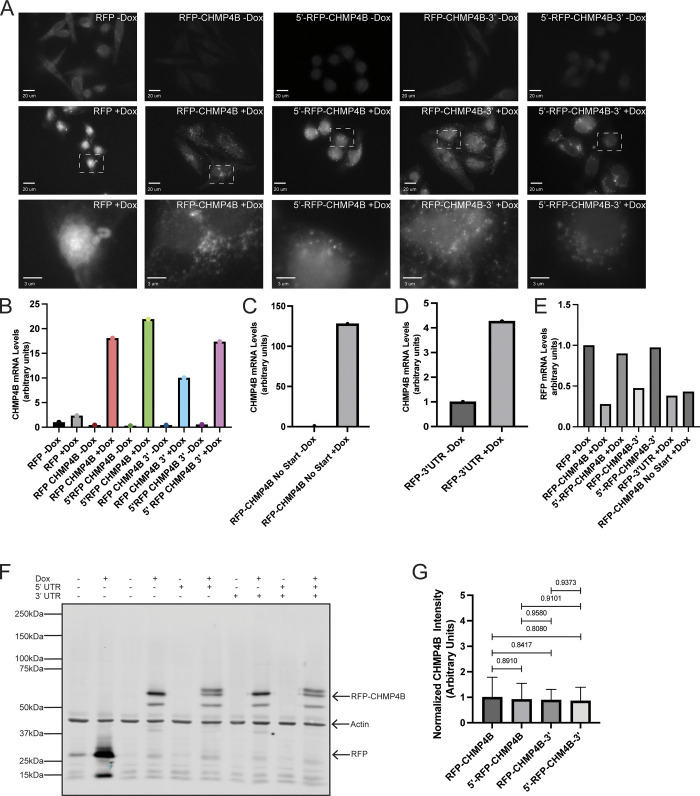
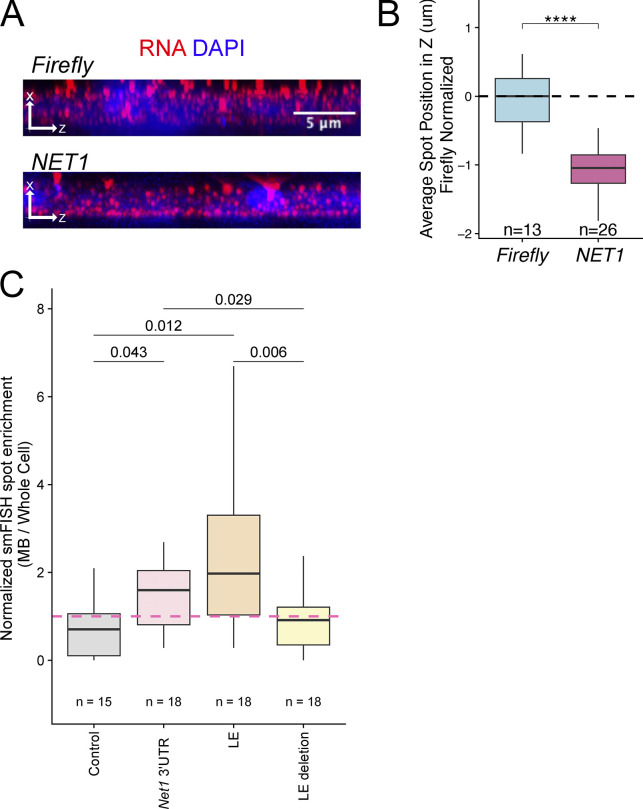
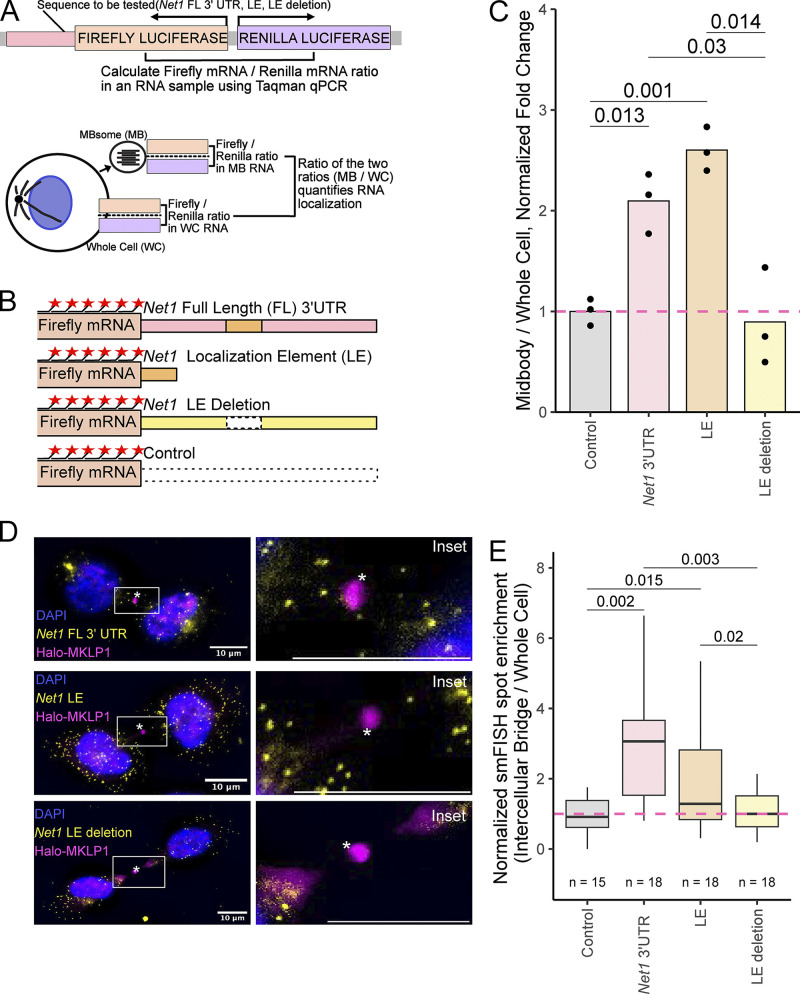
Midbodies function during telophase to regulate the abscission step of cytokinesis. Until recently, it was thought that abscission-regulating proteins, such as ESCRT-III complex subunits, accumulate at the MB by directly or indirectly binding to the MB resident protein, CEP55. However, recent studies have shown that depletion of CEP55 does not fully block ESCRT-III targeting the MB. Here, we show that MBs contain mRNAs and that these MB-associated mRNAs can be locally translated, resulting in the accumulation of abscission-regulating proteins. We demonstrate that localized MB-associated translation of CHMP4B is required for its targeting to the abscission site and that 3' UTR-dependent CHMP4B mRNA targeting to the MB is required for successful completion of cytokinesis. Finally, we identify regulatory cis-elements within RNAs that are necessary and sufficient for mRNA trafficking to the MB. We propose a novel method of regulating cytokinesis and abscission by MB-associated targeting and localized translation of selective mRNAs.


Conflict of interest statement

Disclosures: The authors declare no competing interests exist.

Figures

Figure 1.
Figure 1.
MBsomes contain a distinct subset of mRNAs. (A) Schematic representing MB formation and MBsome release into the media. MBsomes from the media were isolated for RNAseq analysis presented in this study. (B) Principal component analysis representing the difference between the three control and the three MB RNAseq datasets. (C) Correlation analysis representing the correlation between the various control and MB RNAseq datasets. (D) Volcano plot showing the significantly depleted (pink) and significantly enriched (purple) mRNAs found within MBsomes from three RNAseq datasets.
Figure S1.
Figure S1.
Comparative analysis of MB-Associated mRNAs. (A) Comparison of MB-associated mRNA with RNA contents of HeLa cells in G2/M and G1 cell cycle phases. (B) Comparison of MB-associated mRNA with RNA contents of HeLa cells in S and G1 cell cycle phases. (C) Comparison of MB-associated mRNA with spindle-associated RNA.
Figure 2.
Figure 2.
MBsomes are enriched in mRNAs encoding proteins that regulate translation and cell cycle. (A) The Gene Ontology (GO) pathway analysis tool was used to determine the pathways associated with the enriched MB-associated mRNAs. (B) MB enrichment of mRNAs encoding known abscission regulators. Data shown present means and SD derived from three separate RNAseq analyses. Dashed line marks the mRNA levels present in the whole cell transcriptome. (C) Whole-cell or MBsome-associated mRNAs were isolated from GFP-MKLP1-expressing HeLa cell line. The cDNA was subject to RT-qPCR using TSG101, CHMP4B, CHMP2A, CHMP3, CHMP6, or GAPDH (control) specific primers and represented as normalized values. The means and SD were calculated from three independent experimental repeats. Statistical analysis is represented with a P value. (D) Schematic representing key regulators of abscission and how they relate to each other in the intercellular bridge.
Figure 3.
Figure 3.
Midbodies contain molecular machinery required for protein translation. (A) GFP-MKLP1 expressing HeLa cells were either mock-treated or treated with CHMP4B siRNA for 72 h and subjected to staining with smFISH probes against CHMP4B. Arrows in the inset point to CHMP4B mRNA particles. The cell outline is marked in yellow with the asterisks marking the MB. The black dashed square represents the region of the image used for the inset. Scale bars: 10 μm. (B) ImageJ was used to count the number of CHMP4B smFISH particles in the mock or CHMP4B siRNA-treated cells. Each dot represents a single cell. The means and SD were calculated from five randomly chosen cells in telophase. (C) The Database for Annotation, Visualization, and Integrated Discovery (DAVID) was used to determine whether ribosomal proteins and translation initiation factors are enriched in all three published MB proteomes. (D) HeLa cells were fixed and subjected to immunostaining with anti-acetylated-tubulin (red) and anti-RPL3 (green) antibodies. The line used for the line intensity graphs is marked in yellow and the asterisks mark the MB. The white dashed square represents the region of the image used for the inset. Scale bars: 10 μm. Inset scale bars: 2 μm. (E and F) Line intensity graphs representing the intensity of acetylated-tubulin (red) and RPL3 (green). Negative control was derived from samples that were treated with secondary antibodies but without anti-RPL3 antibodies.
Figure S2.
Figure S2.
Validation of CHMP4B mRNA localization at the MB. (A) Midbodies were purified from HeLa cells stably expressing GFP-MKLP1. Purified midbodies were plated on poly-L-lysine coated coverslips and analyzed by fluorescence microscopy. Arrows point to GFP-MKLP1 positive midbodies. Scale bar: 10 μm. (B and C) GFP-MKLP1 expressing HeLa cells were either mock-treated or treated with CHMP4B (B) or CEP55 (C) siRNAs. Cells were then incubated for 72 h, followed by mRNA isolation and RT-qPCR analysis using CHMP4B, CEP55, and GAPDH (control) specific primers. Data shown are the CHMP4B or CEP55 mRNA levels normalized against GAPDH mRNA derived from one qPCR analysis. (D and E) GFP-MKLP1 expressing HeLa cells were either mock treated (top two panels) or treated with puromycin for 1 h (bottom two panels) and subjected to staining with smFISH probes against CHMP4B mRNA. CHMP4B mRNA particles are marked by the arrows in the inset and the black dashed square represents the region of the image used for the inset (D). Scale bars: 10 μm. Inset scale bars: 2 μm. The number of cells with CHMP4B smFISH signal was then counted. The data shown in E represents the means and SD derived from three independent experiments. (F) GFP-MKLP1 expressing HeLa cells were either mock treated or treated with CEP55 siRNA for 72 h. Cells were then fixed and subjected to staining with smFISH probes against CHMP4B mRNA. The number of cells with CHMP4B smFISH signal in the MB were then counted and expressed as means and SD derived from three independent experiments. (G) HeLa cells were fixed and stained with anti-RPS6 and anti-acetylated-tubulin antibodies. Box in the image on the left indicates areas that are shown in zoomed-in images on the right. Scale bars: 10 μm. Inset scale bars: 1 μm. (H) HeLa cells expressing MKLP1-Halo (green) were fixed and stained with polyA probes (red). Arrows point to the midbody. Scale bars: 5 μm.
Figure 4.
Figure 4.
Active protein translation occurs in the midbody. (A) Schematic representing the three treatment conditions and times used for the experiments represented in B–E. (B) HeLa cells were treated with either DMSO, CHX+Puromycin, or Puromycin and subjected to immunostaining with anti-acetylated-tubulin and anti-puromycin antibodies. The asterisks mark the MB and the white dashed square represents the region of the image used for the inset. Scale bars: 10 μm. Inset scale bars: 2 μm. (C and D) 3i imaging software was used to measure the anti-puromycin intensity/μm2 in the intercellular bridge of 60 cells from three separate experiments (C; each dot represents one cell). Statistical analysis was done on means and SD derived from the three individual experiments (D). Each experiment is represented by a different shade of color and is the mean derived from all cells analyzed in that particular experiment. Statistical analysis is represented with a P value. (E) HeLa cells were treated with either DMSO, CHX+Puromycin, or Puromycin and subjected to immunostaining with anti-puromycin (to mark the puromycylated peptides) and anti-CHMP4B antibodies. The line used for the line intensity graphs is marked in yellow and the asterisks mark the MB. The white dashed square represents the region of the image used for the inset. Scale bars: 10 μm. Inset scale bars: 2 μm. (F–H) Line intensity graphs representing the intensity of Puromycin (red) and CHMP4B (green) signals after DMSO (F), CHX+Puromycin (G), or Puromycin (H) treatments.
Figure 5.
Figure 5.
Inhibition of translation inhibits CHMP4B accumulation at the midbody. (A) HeLa cells were either untreated or treated with puromycin for 1 h and subjected to immunostaining with anti-acetylated-tubulin and anti-CHMP4B antibodies. The asterisks mark the MB and the white dashed square represents the region of the image used for the inset. Scale bars: 10 μm. Inset scale bars: 2 μm. (B and C) Shown data represent CHMP4B intensity/μm2 in the intercellular bridge of 60 cells from three separate experiments. B shows distributions derived from individual cells (each dot represents a single cell). Statistical analysis in C was done on the means and SD derived from the three individual experiments where experimental means were calculated by averaging values from all the cells from each experiment. Each experiment is represented by a different shade of color. Statistical analysis is represented with a P value. (D and E) Shown data represent CHMP4B intensity/μm2 in the cell body of 60 cells from three separate experiments. D shows distributions derived from individual cells (each dot represents a single cell). Statistical analysis in E was done on the means, and SD were derived from the three individual experiments where experimental means were calculated by averaging values from all the cells from each experiment. Each experiment is represented by a different shade of color. Statistical analysis is represented with a P value. (F) HeLa cells were either untreated or treated with puromycin for 1 h and subjected to immunostaining with anti-acetylated-tubulin and anti-CEP55 antibodies. The asterisks mark the MB and the white dashed square represents the region of the image used for the inset. Scale bars: 10 μm. Inset scale bars: 2 μm. (G and H) Shown data represents CEP55 intensity/μm2 in the intercellular bridge of 60 cells from three separate experiments. G shows distributions derived from individual cells (each dot represents a single cell). Statistical analysis in H was done on the means and SD were derived from the three individual experiments where experimental means were calculated by averaging values from all the cells from each experiment. Each experiment is represented by a different shade of color. Statistical analysis is represented with a P value. (I and J) Shown data represents CEP55 intensity/μm2 in the cell body of 60 cells from three separate experiments. I show the distributions derived from individual cells (each dot represents a single cell). Statistical analysis in J was done on the means, and SD were derived from the three individual experiments where experimental means were calculated by averaging values from all the cells from each experiment. Each experiment is represented by a different shade of color. Statistical analysis is represented with a P value. (K) HeLa cells after puromycin treatment were fixed and stained with anti-acetylated-tubulin antibodies. The percentage of cells in telophase was then counted. Shown data are the means and SD derived from three independent experiments. Statistical analysis is represented with a P value. (L) HeLa cells after puromycin treatment were fixed and stained with anti-acetylated-tubulin antibodies. The percentage of cells that just completed abscission was then counted. Shown data are the means and SD derived from three independent experiments. Statistical analysis is represented with a P value.
Figure S3.
Figure S3.
The effect of puromycin treatment on CHMP4B targeting to the MB in synchronized cells. (A) Synchronization and puromycin treatment schematics. (B and C) Synchronized HeLa cells were incubated for 90 min in the presence or absence of puromycin (during last 30 min of incubation). Cells were then foxed and stained with anti-CHMP4B antibodies (red). Asterisk marks the midbody. Scale bars: 10 μm. C shows quantification of CHMP4B localization in the midbody. Data shown are the means and SD calculated from individual cell values. Dots represent localization in individual cells. (D) HeLa cells were either untreated, treated with puromycin, CEP55 siRNA, or CEP55 siRNA plus puromycin and subjected to immunostaining anti-acetylated-tubulin and anti-CHMP4B antibodies. The asterisks mark the MB, and the white dashed square represents the region of the image used for the inset. Scale bars: 10 μm. Inset scale bars: 2 μm. (E and F) Shown data represents CHMP4B intensity/μm2 in intercellular of 60 cells from three separate experiments. E shows distributions derived from individual cells (each dot represents a single cell). Statistical analysis in F was done on the means and SD were derived from the three individual experiments where experimental means were calculated by averaging values from all the cells from each experiment. Each experiment is represented by a different shade of color. Statistical analysis is represented with a P value.
Figure S4.
Figure S4.
Puromycin wash-out leads to fast recovery of CHMP4B levels in MB. (A) HeLa cells were either untreated or treated for 1 h with puromycin. Cells were then washed and incubated with complete media for either 5 min or 10 min. Cells were then fixed and subjected to immunostaining with anti-acetylated-tubulin and anti-CHMP4B antibodies. The asterisks mark the MB and the white dashed square represents the region of the image used for the inset. Scale bars: 10 μm. Inset scale bars: 2 μm. (B and C) Shown data represents CHMP4B intensity/μm2 in the intercellular bridge of 60 cells from three separate experiments. B shows distributions derived from individual cells (each dot represents a single cell). Statistical analysis in C was done on the means and SD were derived from the three individual experiments where experimental means were calculated by averaging values from all the cells from each experiment. Each experiment is represented by a different shade of color. Statistical analysis is represented with a P value. (D and E) Shown data represents CHMP4B intensity/μm2 in the cell body of 60 cells from three separate experiments. D shows distributions derived from individual cells (each dot represents a single cell). Statistical analysis in E was done on the means and SD were derived from the three individual experiments where experimental means were calculated by averaging values from all the cells from each experiment. Each experiment is represented by a different shade of color. Statistical analysis is represented with a P value. (F and G) HeLa cells that were untreated or treated for 1 h with puromycin. Cells were then washed and incubated with media for an additional 5 or 10 min. Cells were then fixed and stained with anti-acetylated-tubulin antibodies. The percentage of cells in either telophase (F) or just after abscission (G) was then counted. Shown data are means and SD derived from three independent experiments. Statistical analysis is represented with a P value.
Figure S5.
Figure S5.
The effect of puromycin treatment on cell abscission. (A and B) HeLa cells were fixed and subjected to immunostaining using anti-acetylated-tubulin. A represents a cell in telophase. B represents a cell that had just undergone abscission (see arrow). The lines used for the line intensity graphs are marked in yellow, and the white dashed square represents the region of the image used for the inset. Scale bars: 10 μm. (C and D) Line intensity graphs representing the intensity of acetylated-tubulin in telophase and abscission cells. The abscission site is marked by an arrow (D). (E and F) Telophase HeLa cells stably expressing GFP-MKLP1 were analyzed by time-lapse microscopy. Cells were imaged for 120 min with 15 min time-lapse. Scale bars: 10 μm.
Figure 6.
Figure 6.
The 3′ UTR of CHMP4B is important for protein accumulation and mRNA translocation. (A) HeLa cells expressing various RFP-tagged dox-inducible constructs were incubated with 2 μg/ml doxycycline for 48 h and then subjected to immunostaining with anti-acetylated-tubulin. The asterisks mark the MB and the white dashed square represents the region of the image used for the inset. Scale bars: 10 μm. Inset scale bars: 5 μm. (B and C) Ratio between RFP fluorescence in the intercellular bridge and cell body was calculated from 60 randomly chosen cells in telophase. B shows distributions derived from individual cells (each dot represents a single cell). Statistical analysis in C was done on the means, and SD were derived from the three independent experiments where experimental means were calculated by averaging values from all the cells from each experiment. Each experiment is represented by a different shade of color. Statistical analysis is represented with a P value. (D) HeLa cells expressing various RFP-tagged dox-inducible constructs were incubated with 2 μg/ml doxycycline for 48 h and then subjected to immunostaining with anti-acetylated-tubulin. The percentage of cells with multinucleation was then counted. Shown data are the means and SD derived from three independent experiments. Statistical analysis is represented with a P value. (E) HeLa cells expressing various RFP-tagged dox-inducible constructs were incubated with 2 μg/ml doxycycline for 48 h and then subjected to immunostaining with anti-acetylated-tubulin. The percentage of cells in telophase was then counted. Shown data are the means and SD derived from three independent experiments. Statistical analysis is represented with a P value. (F) HeLa cells expressing dox-inducible RFP-CHMP4B or RFP-CHMP4B-3′UTR constructs were incubated with 2 μg/ml doxycycline for 48 h and subjected to staining with smFISH probes against CHMP4B. The cell outline is marked in yellow with the asterisks marking the MB. The black dashed square represents the region of the image used for the inset. Scale bars: 10 μm. Inset scale bars: 2 μm. (G) Whole-cell or MB-associated mRNA was isolated from these cell lines expressing various RFP-tagged constructs and subject to RT-qPCR analysis using RFP or GAPDH (control) specific primers. RFP mRNA levels were then normalized against GAPDH mRNA and expressed as a ratio between MB and whole-cell RFP mRNA levels. Statistical analysis is represented with a P value and was done on the means and SD derived from three independent experiments.
Figure 7.
Figure 7.
The 3′ UTR is required for CHMP4B translation at the MB during telophase. (A) HeLa cells were transfected with RFP-CHMP4B-3′UTR and plated on glass-bottom dishes. The accumulation of RFP-CHMP4B at the MB during telophase was then imaged using time-lapse microscopy for 120 min with 15 min time-lapse. Asterisk marks the midbody. Scale bars: 10 μm. Inset scale bars: 1 μm. (B) HeLa cells stably expressing GFP-MKLP1 were transfected with either HA-CHMP4B-3′UTR (images on the left) or HA-CHMP4B (images on the right). Cells were then fixed and incubated with anti-HA and anti-puromycin antibodies followed by proximity ligation assay (PLA). Asterisk marks the midbody. Boxes mark area shown in higher magnification insets. Scale bars: 10 μm. Inset scale bars: 1 μm. (C) Negative controls for the PLA experiment are shown in B. Cells in the image on the left were not treated with puromycin but transfected with HA-CHMP4B-3′UTR. Cells in the image on the right were treated with puromycin but not transfected with HA-CHMP4B-3′UTR. Asterisk marks the midbody. Scale bars: 10 μm. (D) Quantification of the levels of PLA signal in the midbody area. Data shown are the means and SEM derived from all cells analyzed. Each circle indicates the data derived from one dividing cell.
Figure 8.
Figure 8.
Transcripts associated with the plus-ends of microtubules are enriched in the MB transcriptome. (A) Comparison of MB-associated mRNA with RNAs enriched in neuronal projections of mouse neuronal cells. Genes were binned into MB-localized RNAs and non-MB-localized RNAs. Neurite RNA enrichment values (neurite RNA/soma RNA, log2) from previously published data were then calculated for the mouse orthologs of all genes, and the distributions of enrichment values were compared between bins. P values were calculated using a Wilcoxon rank-sum test. (B) As in A, genes were binned according to their MB RNA enrichment. Using a previous published comparison of the apical and basal compartments of epithelial cells, basal enrichment values (basal RNA/apical RNA, log2) were calculated for all genes and the distributions of enrichment values were compared between bins. P values were calculated using a Wilcoxon rank-sum test. (C) NET1 RNA enrichment in human midbodies compared with whole cells (left) and mouse neurites compared to cell bodies (right). Scale bars: 10 μm. Inset scale bars: 2 μm. (D) smiFISH for endogenous NET1 mRNA localization (yellow) in cells stably expressing Halo-MKLP1 (pink). Midbody is marked with an asterisk. The box indicates the area shown in a higher magnification inset. Scale bar: 5 μm. (E) Quantification of NET1 smiFISH. Transcript counts were quantified in the intercellular bridge and whole-cell areas. For each cell, the number of counts in the intercellular bridge was normalized by the number of counts in the whole cell. The median ratio for this value across all cells for the control TSG101 transcript was set to one. P values were calculated using a t test. (F) As in E, except that transcript counts in the midbody and whole cell regions were compared. P values were calculated using a t test.
Figure S6.
Figure S6.
Characterization of HeLa LoxP cells expressing doxycycline-inducible RFP-tagged constructs. (A) HeLa LoxP cells expressing various RFP-tagged dox-inducible constructs cells were untreated (−Dox) or treated with 2 μg/ml doxycycline for 48 h (+Dox). RFP was visualized by fluorescent microscopy to test for dox-dependent expression. The white dashed square represents the region of the image used for the inset. Scale bars: 20 μm. Inset scale bars: 3 μm. Scale bars: 5 μm. (B–D) HeLa LoxP cells expressing various RFP-tagged dox-inducible constructs cells were untreated (−Dox) or treated with 2 μg/ml doxycycline for 48 h (+Dox). The construct expression levels were then determined by RT-qPCR using CHMP4B-specific primers (single qPCR run with three technical replicates). (E) HeLa LoxP cells expressing various RFP-tagged dox-inducible constructs cells were treated with 2 μg/ml doxycycline for 48 h. The levels of expression among various constructs were the n compared using RT-qPCR with RFP specific primers (single qPCR run with three technical replicates). (F and G) HeLa LoxP cells expressing various RFP-tagged dox-inducible constructs cells were untreated (−Dox) or treated with 2 μg/ml doxycycline for 48 h (+Dox). The levels of RFP-tagged protein expressions were visualized via Western blot using anti-RFP and anti-Actin (loading control) antibodies. G shows Western blot quantification from three independent experiments. Statistical analysis is represented with a P value. Source data are available for this figure: SourceData FS6.
Figure S7.
Figure S7.
Localization analysis of Net1 mRNA. (A) smiFISH for endogenous NET1 mRNA localization (red) in human epithelial cells. As a nonlocalized control, transcripts encoding an exogenous Firefly luciferase are also visualized. (B) Quantification of NET1 RNA localization along the apicobasal axis of epithelial cells. (C) Quantification of MB-localized Net1 UTR-containing reporter transcripts. In all samples, reporter transcript counts in midbodies and whole cells were quantified and the ratio of counts between the two locations is reported. These ratios were normalized by setting the value for the control reporter transcript lacking 3′ UTR additions to one. P values were calculated using a t test.
Figure 9.
Figure 9.
NET1 3′ UTR localization elements are necessary and sufficient to target mRNA to the MB. (A) Schematic RT-qPCR-based reporter RNA approach for assaying MB RNA localization. Plasmids expressing Firefly and Renilla luciferases from a bidirectional reporter are integrated into the genome. Sequences to be tested for MB localization activity (NET1 full length 3′ UTR, LE and LE deletion) are fused to the 3′ UTR of Firefly luciferase. Using Taqman qPCR, the ratio of Firefly to Renilla luciferase mRNA is measured in MB and whole-cell samples. The ratio of these ratios (MB/WC) quantifies the MB enrichment of the Firefly luciferase transcript. By asking how this value changes upon appending additional sequences to the Firefly luciferase RNA, the effects of these additional sequences on MB RNA enrichment can be tested. (B) Diagram of reporter constructs used to interrogate NET1 localization activity in MBs. smFISH probes against the Firefly luciferase coding sequence are shown as red stars. (C) Localization of the reporter RNAs described in B to the MB as quantified using the strategy outlined in A. The value for the control reporter lacking additional sequence elements was set to one. P values were calculated using a t test. (D) smFISH visualizing the reporter RNAs described in B (yellow) in cells stably expressing Halo-MKLP1 (pink). Midbody is marked with an asterisk. The box indicates the area shown in a higher magnification inset. Scale bars: 10 μm. (E) Quantification of MB-localized Net1 UTR-containing reporter transcripts visualized in D. In all samples, reporter transcript counts in intercellular bridges and whole cells were quantified and the ratio of counts between the two locations is reported. These ratios were normalized by setting the value for the control reporter transcript lacking 3′ UTR additions to one. P values were calculated using a t test.

Similar articles

Cited by

References

    1. Addi, C., Bai J., and Echard A.. 2018. Actin, microtubule, septin and ESCRT filament remodeling during late steps of cytokinesis. Curr. Opin. Cell Biol. 50:27–34. 10.1016/j.ceb.2018.01.007 - DOI - PubMed
    1. Addi, C., Presle A., Frémont S., Cuvelier F., Rocancourt M., Milin F., Schmutz S., Chamot-Rooke J., Douché T., Duchateau M., et al. . 2020. The Flemmingsome reveals an ESCRT-to-membrane coupling via ALIX/syntenin/syndecan-4 required for completion of cytokinesis. Nat. Commun. 11:1941. 10.1038/s41467-020-15205-z - DOI - PMC - PubMed
    1. Agromayor, M., Carlton J.G., Phelan J.P., Matthews D.R., Carlin L.M., Ameer-Beg S., Bowers K., and Martin-Serrano J.. 2009. Essential role of hIST1 in cytokinesis. Mol. Biol. Cell. 20:1374–1387. 10.1091/mbc.e08-05-0474 - DOI - PMC - PubMed
    1. Arora, A., Castro-Gutierrez R., Moffatt C., Eletto D., Becker R., Brown M., Moor A.E., Russ H.A., and Taliaferro J.M.. 2022a. High-throughput identification of RNA localization elements in neuronal cells. Nucleic Acids Res. 50:10626–10642. 10.1093/nar/gkac763 - DOI - PMC - PubMed
    1. Arora, A., Goering R., Velez P.T., and Taliaferro J.M.. 2022b. Visualization and quantification of subcellular RNA localization using single-molecule RNA fluorescence in situ hybridization. Methods Mol. Biol. 2404:247–266. 10.1007/978-1-0716-1851-6_13 - DOI - PMC - PubMed

Publication types

MeSH terms

Substances