. 2023 Dec:68:102949.
doi: 10.1016/j.redox.2023.102949. Epub 2023 Oct 30.

Hypoxia increases persulfide and polysulfide formation by AMP kinase dependent cystathionine gamma lyase phosphorylation

Affiliations

Hypoxia increases persulfide and polysulfide formation by AMP kinase dependent cystathionine gamma lyase phosphorylation

Shafiul Alam et al. Redox Biol. 2023 Dec.

Abstract

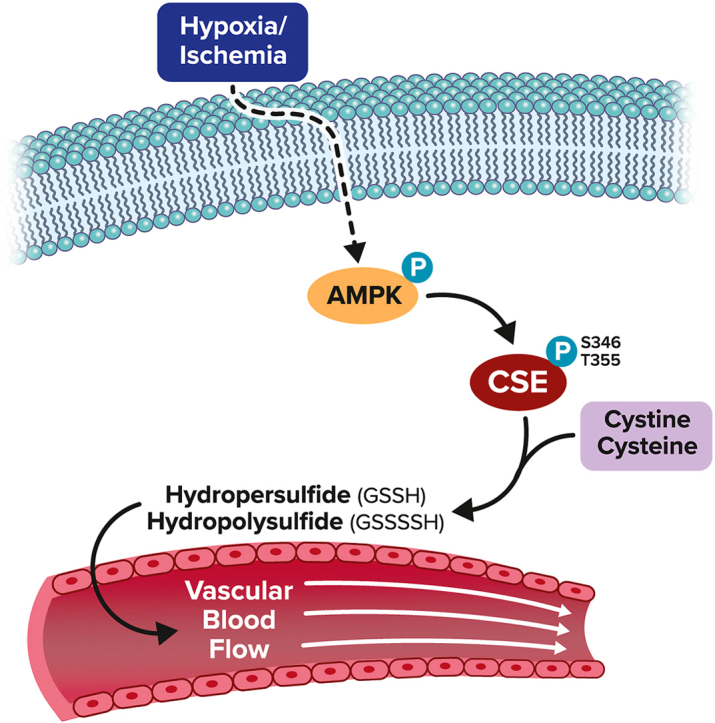
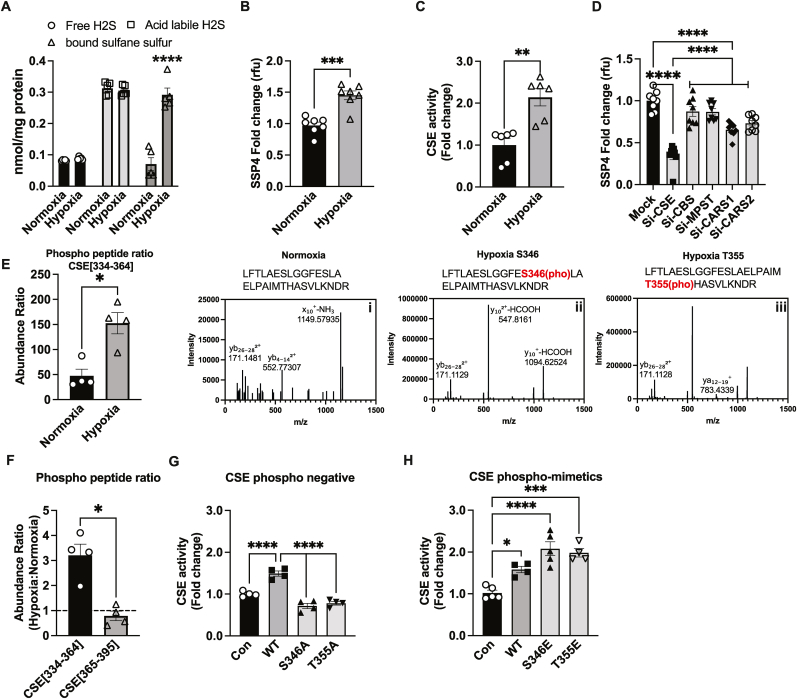
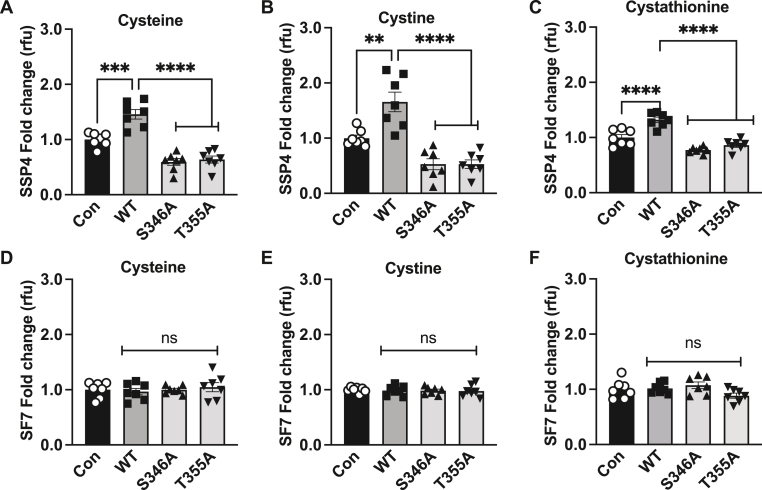
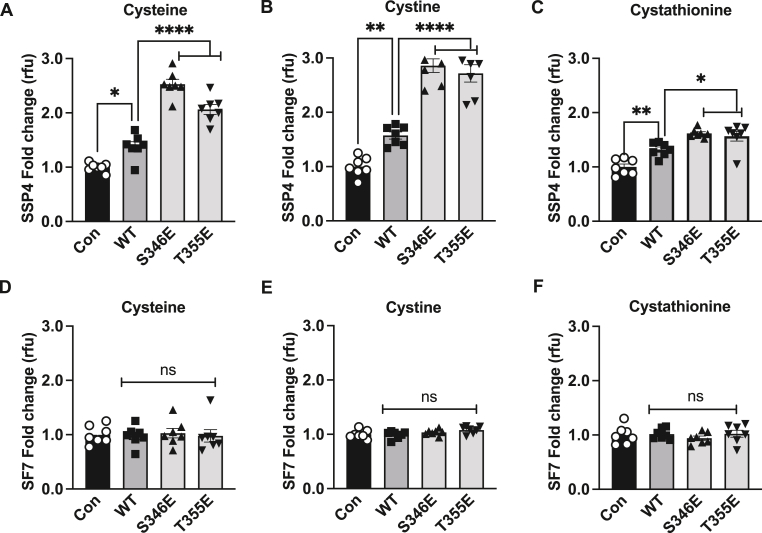
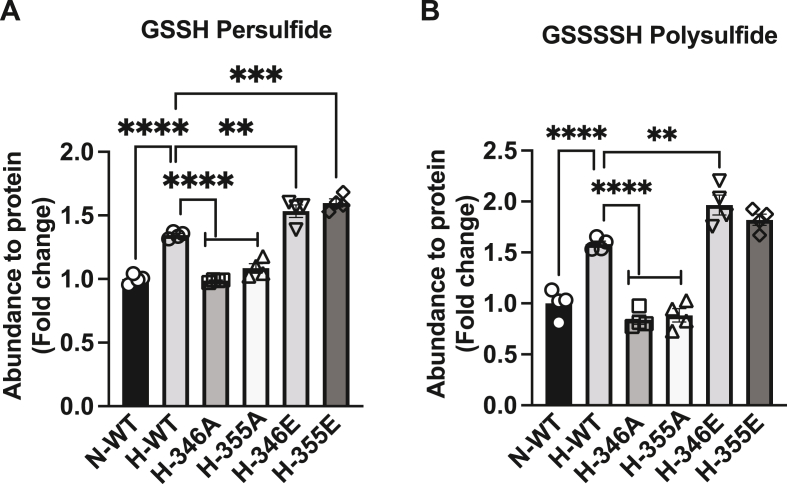
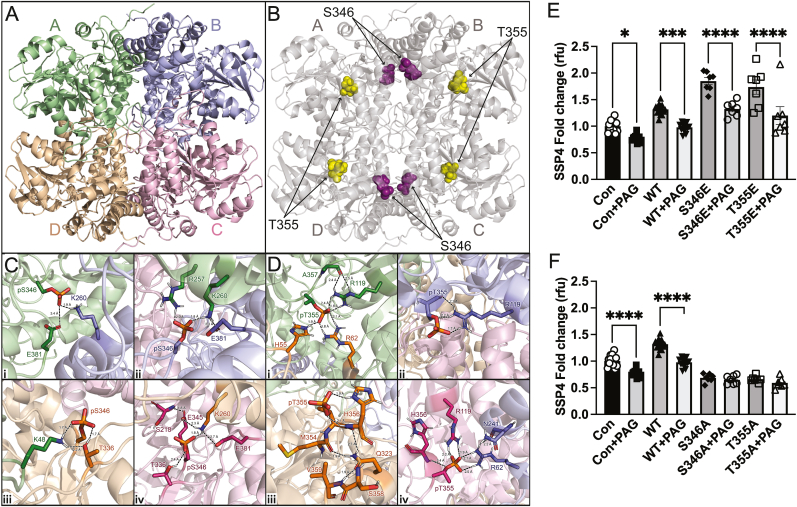
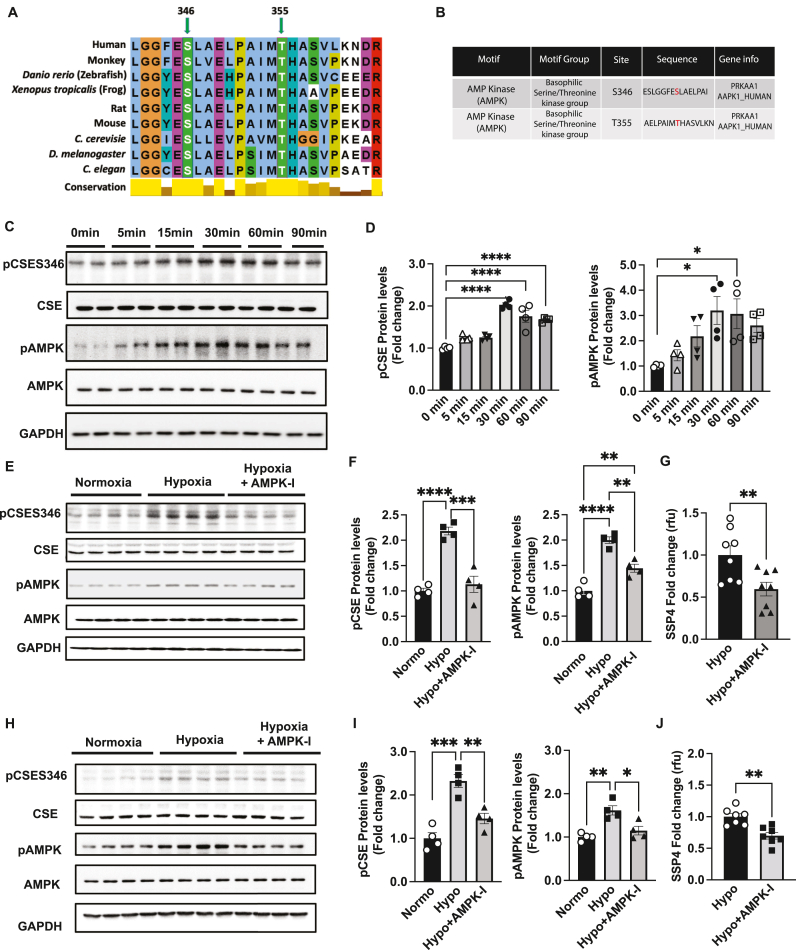
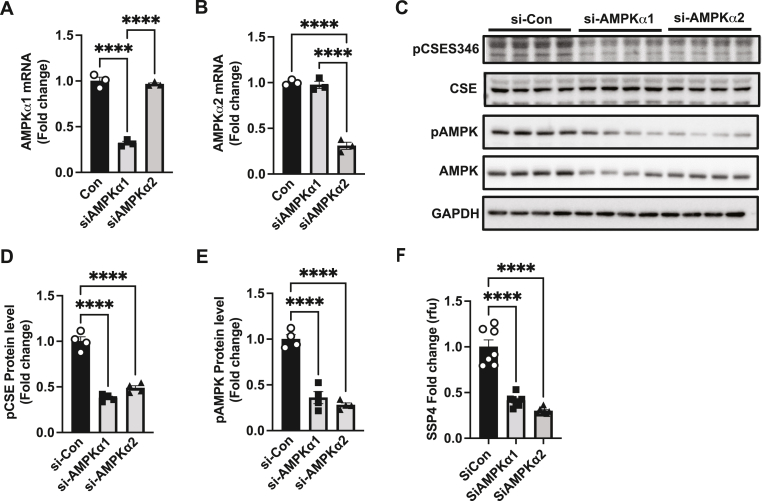
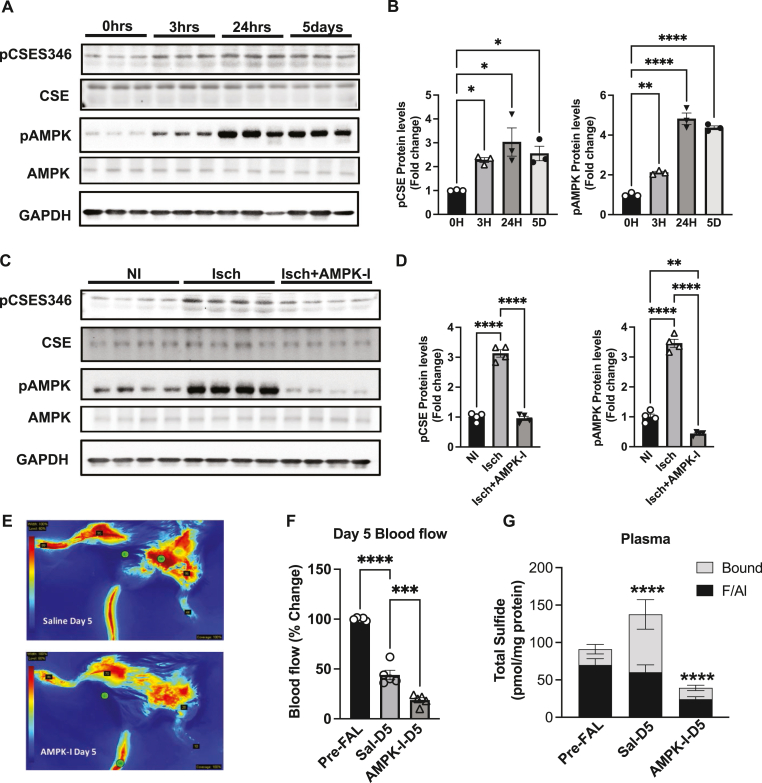
Hydropersulfide and hydropolysulfide metabolites are increasingly important reactive sulfur species (RSS) regulating numerous cellular redox dependent functions. Intracellular production of these species is known to occur through RSS interactions or through translational mechanisms involving cysteinyl t-RNA synthetases. However, regulation of these species under cell stress conditions, such as hypoxia, that are known to modulate RSS remain poorly understood. Here we define an important mechanism of increased persulfide and polysulfide production involving cystathionine gamma lyase (CSE) phosphorylation at serine 346 and threonine 355 in a substrate specific manner, under acute hypoxic conditions. Hypoxic phosphorylation of CSE occurs in an AMP kinase dependent manner increasing enzyme activity involving unique inter- and intramolecular interactions within the tetramer. Importantly, both cellular hypoxia and tissue ischemia result in AMP Kinase dependent CSE phosphorylation that regulates blood flow in ischemic tissues. Our findings reveal hypoxia molecular signaling pathways regulating CSE dependent persulfide and polysulfide production impacting tissue and cellular response to stress.

Keywords: AMP kinase; Cystathionine gamma lyase; Ischemia; Molecular modeling; Persulfide; Phosphorylation; Polysulfide.


Conflict of interest statement

Declaration of competing interest C.G.K., G.K·K., S.A., and X.S. have a provisional patent on CSE phosphorylation mutants and uses.

Figures

Image 1
Graphical abstract
Fig. 1
Fig. 1
Hypoxic per-polysulfide formation and CSE phosphorylation. Panel A shows MAECs exposed to either normoxia (21 % oxygen) or hypoxic (1 % oxygen) conditions for 30min and analyzed for various sulfide metabolites, including free, acid-labile sulfide and bound sulfane sulfur (including persulfide and polysulfide) using MBB/HPLC method. Panel B Per-polysulfides levels in MAECs treated with either normoxia or hypoxia for 30min using the fluorescent probe SSP4. Panel C CSE enzyme activity under hypoxia compared to normoxia in MAECs. Panel D Per-polysulfide levels in MAECs transfected with either mock, CSE, CBS, MPST, CARS-1 or CARS-2 siRNAs and then respectively were probed with SSP4 under hypoxic conditions. Panel E LC/MS HCD fragmentation spectrum of trypsin digested human CSE purified from normoxic versus hypoxic treated HEK cells. CSE amino acid fragment 334–364 (LFTLAESLGGFESLAELPAIMTHASVLKNDR) was identified by Protein Discoverer 2.5. (i) HCD spectra of native Human CSE [334−364] peptide. (ii) HCD spectra of singly phosphorylated Human CSE [334−364] at Ser346. (iii) HCD spectra of singly phosphorylated Human CSE [334−364] at T355. Panel F Phospho peptide ratios comparing CSE[334–364] and CSE[365–395] from LC/MS HCD fragmentation spectrum of trypsin digested human CSE purified from hypoxia. Panel G CSE activity of Control (Con), WT, or CSE phosphonegative alanine mutant constructs of S346A or T355A transfected into HEK293 cells. Panel H CSE activity of HEK293 cells transfected with either Control, WT, CSE glutamate (E) phospho-mimetics, S346E or T355E, under hypoxia. All the data are averaged from triplicates from each experiment with at least n = 5. ****P < 0.0001; ***P < 0.0002; **P < 0.003; *P < 0.01.
Fig. 2
Fig. 2
Phospho-negative mutants reduces per-polysulfide levels under hypoxia. HEK293 cells transfected with either Control (Con), wild type CSE (WT), phospho-negative mutant S346A or T355A under hypoxia (1 % oxygen) for 30 min and probed for per-polysulfide (SSP4 fluorophore) or hydrogen sulfide (SF7 fluorophore) signal. Panels A, B, and C show SSP4 signal using cysteine, cystine, or cystathionine as substrates, respectively. Panels D, E, and F show SF7 signal using cysteine, cystine, or cystathionine as substrates, respectively. All data were averaged from triplicates from each experiment with at least n = 5. ****P < 0.0001; **P < 0.003; *P < 0.01.
Fig. 3
Fig. 3
Phospho-mimetics induces per-polysulfide levels under hypoxia. HEK293 cells transfected with either Control (Con), wild type CSE (WT), phospho-mimetic mutants S346E or T355E under hypoxia (1 % oxygen) for 30 min and probed for per-polysulfide (SSP4 fluorophore) or hydrogen sulfide (SF7 fluorophore) signal. Panels A, B, and C show SSP4 signal using cysteine, cystine, or cystathionine as substrates, respectively. Panels D, E, and F show SF7 signal using cysteine, cystine, or cystathionine as substrates, respectively. All data were averaged from triplicates from each experiment with at least n = 5. ****P < 0.0001; **P < 0.003; *P < 0.01.
Fig. 4
Fig. 4
Per and polysulfide levels in endothelial cells transfected with CSE phospho mutants. Abundance of per/polysulfide to protein (fold change) was measured by HPE-IAM LC/MS in MAECs transfected with either wild type CSE (WT) under normoxia (N-WT) or hypoxia (H-WT), phospho negative mutants S346A (H-346A), T355A (H-355A); phospho-mimetics mutant S346E (H-346E) or T355E (H-355E) under hypoxia. Panel A reports glutathionine persulfide (GSSH) and panel B illustrates glutathionine polysulfide (GSSSSH). All data are averaged from triplicates from each experiment with at least n = 3. ****P < 0.0001; ***P < 0.0002; **P < 0.003.
Fig. 5
Fig. 5
Molecular dynamics simulations of cystathionine gamma lyase. Three-dimensional structure of CSE as a tetramer and the respective composite monomers generated by AlphaFold. Molecular dynamics simulations of 350 ns were performed with linear constraint solver (LINCS) constraints for all bonds for panel A WT CSE, and panel B CSE with phospho sites S346 (purple), and T355 (gold). Molecular dynamics simulations Phosphorylation of residues S346 and T355 modeled in Pymol using the PyTMs plugin. All were performed using GROMACS 2019 software with the GROMOS 54A7 force field and SPC216 water model. Frames were recorded every 2 ps. Panel C The 300 ns simulation showing extensive intra- and inter-molecular contacts induced by phosphorylation of 346. Each p346 monomer were color coded belongs to and kept the scheme as shown panel A to illustrate which contacts are intra vs inter-molecular contacts. The backbone RMSD was monitored over the production run of each protein to ensure the stability and convergence of the simulated trajectories. p346 leads to a novel interaction between monomer A (p346) and B (K260, R257), monomer B (p346, H217, E345) and monomer A (K260, R257), monomer C (p346, T336) and monomer A (K48), and monomer D (p346, E345, E381) and monomer C (K260). Panel D Intra- and inter-molecular electrostatic interactions formed by phosphorylation of T355. Interactions to pT355A – H55D, R62D, R119A (Fig. 4D, inset i); pT355B – R119B (Fig. 4D, inset ii); pT355D – Q323D, M354D, H356D, S358D, V359D (Fig. 4d, inset iii); and pT355C – R119C, H356C, R62B, N241B (Fig. 4d, inset iv). Panel E HEK293 cells transfected with either Control (Con), wild type CSE (WT), phospho-mimetic mutants S346E or T355E with or without PAG under hypoxia (1 % oxygen) for 30 min and probed for per-polysulfide (SSP4 fluorophore) Panel F HEK293 cells transfected with either Control (Con), wild type CSE (WT), phospho-negative mutants S346A or T355A with or without PAG under hypoxia (1 % oxygen) for 30 min and probed for per-polysulfide (SSP4 fluorophore). All the data are averaged from triplicates from each experiment with at least n = 5. ****P < 0.0001; ***P < 0.0002; *P < 0.01. (For interpretation of the references to color in this figure legend, the reader is referred to the Web version of this article.)
Fig. 6
Fig. 6
Hypoxia induces per-polysulfide via AMPK-mediated phosphorylation of CSE. Panel A Conservation sequence of human CSE at S346 and T355 compared across various species, including human, monkey, Danio rerio (Zebra fish), Xenopus tropicalis (frog), rat, mouse, Saccharomyces cerevisiae, Drosophila melanogaster, and Caenorhabditis elegans. Panel B CSE phospho sites S346 and T355 showing modular signaling domains of protein Serine/Threonine kinases motif groups using Scansite 4. Panel C Representative blots of MAEC treated under hypoxia for 0, 5, 15, 30, 60 and 90 min probed for pCSES346, total CSE, pAMPK, AMPK and GAPDH. Panel D Quantitation of pCSES346 and p-AMPK protein levels, respectively from western blots in Panel A. Panel E Representative blots of MAEC treated with mock or AMPK inhibitor (AMPK-I) Dorsomorphin under hypoxia for 30min. Panel F Quantitation of pCSES346 and pAMPK protein levels, from western blots in Panel E. Panel G MAEC treated with mock or AMPK inhibitor (AMPK-I), Dorsomorphin under hypoxia for 30 min followed by per-polysulfide (SSP4 fluorophore) signal. Panel H Representative blots from HUVEC treated under normoxia or hypoxia or hypoxia + AMPK-I for protein levels of pCSES346, total CSE, pAMPK, AMPK and GAPDH. Panel I quantitation of HUVEC blots for pCSES346 and pAMPK treated with mock or AMPK inhibitor (AMPK-I) Dorsomorphin under hypoxia for 30 min. Panel J HUVECs treated under hypoxia or hypoxia + AMPK-I for 30 min followed by per-polysulfide (SSP4 fluorophore) measurement. Densiometric analysis of p-AMPK and p-CSE346 blots were normalized to total AMPK or total CSE (normalized to GAPDH for protein). All data are averaged from triplicates from each experiment with at least n = 5. ****P < 0.0001; ***P < 0.0002; *P < 0.01.
Fig. 7
Fig. 7
AMPK isomer siRNA reduces hypoxic CSE phosphorylation and per-polysulfide formation. MAEC were treated with si-Con, siAMPKα1 or siAMPKα2 was examined for AMPKα1 and AMPKα2 mRNA expression (Panels A and B). Panel C shows representative blots of pCSES346, total CSE, pAMPK, total AMPK and GAPDH from MAEC treated under hypoxia with siCon, siAMPKα1, or siAMPKα2. Panels D and E respectively show quantitation of pCSES346 and pAMPK protein levels from immunoblots in Panel C. Panel F illustrates SSP4 levels from MAEC transfected with siCon, siAMPKα1, or siAMPKα2 under hypoxia. Densiometric analysis of p-AMPK and p-CSE346 blots were normalized to total AMPK or total CSE (normalized to GAPDH for protein). All data are averaged from triplicates from each experiment with at least n = 5. ****P < 0.0001; ***P < 0.0002; **P < 0.003; *P < 0.01.
Fig. 8
Fig. 8
AMPK inhibition reduces CSE phosphorylation, per-polysulfide and ischemic blood flow. Panel A Representative blots of ischemic gastrocnemius muscle tissues from mice subject to the femoral artery ligation (FAL) 0hrs, 3hrs, 24hrs and 5 days probed for pCSES346, total CSE, pAMPK, AMPK and GAPDH. Panel B Graphic representation of the densitometry quantification depicted in Panel A for pCSE346 and p-AMPK protein expression. Panel C Representative western blots were performed from non-ischemic (NI), ischemic (Isch), and ischemic AMPK-I (Isch + AMPK-I) skeletal muscle (SkM) tissues collected at day 5 post femoral artery ligation. Panel D Graphic representation of the densitometry quantification of pCSE346 and p-AMPK protein expression. Panel E Representative angiogram images of hindlimbs showing blood flow (blue color = lowest flow; red color = highest flow) from saline treated post-ligation at day 5 (upper panel; Sal-D5) and AMPK inhibitor treated post-ligation at day 5 (lower panel; AMPK-I-D5). Panel F Graphic representation of the densitometry quantification depicted in Panel E for ischemic limb blood flow. Panel G Plasma sulfide levels, including free/acid labile pools (F/Al) and bound sulfide of pre-FAL, saline (sal) or AMPK-I treated mice. In all densiometric analysis of western blots, p-AMPK and p-CSE346 are normalized to total AMPK or total CSE that are normalized to GAPDH. All the data were representative of at least n = 5. ****P < 0.0001; **P < 0.003; *P < 0.01. (For interpretation of the references to color in this figure legend, the reader is referred to the Web version of this article.)

References

    1. Kimura H. Hydrogen sulfide and polysulfides as signaling molecules. Proc. Jpn. Acad. B Phys. Biol. Sci. 2015;91:131–159. doi: 10.2183/pjab.91.131. - DOI - PMC - PubMed
    1. Kolluru G.K., Shackelford R.E., Shen X., Dominic P., Kevil C.G. Sulfide regulation of cardiovascular function in health and disease. Nat. Rev. Cardiol. 2023;20:109–125. doi: 10.1038/s41569-022-00741-6. - DOI - PMC - PubMed
    1. Polhemus D.J., Lefer D.J. Emergence of hydrogen sulfide as an endogenous gaseous signaling molecule in cardiovascular disease. Circ. Res. 2014;114:730–737. doi: 10.1161/circresaha.114.300505. - DOI - PMC - PubMed
    1. Fukuto J.M., Ignarro L.J., Nagy P., Wink D.A., Kevil C.G., Feelisch M., Cortese-Krott M.M., Bianco C.L., Kumagai Y., Hobbs A.J., et al. Biological hydropersulfides and related polysulfides - a new concept and perspective in redox biology. FEBS Lett. 2018;592:2140–2152. doi: 10.1002/1873-3468.13090. - DOI - PMC - PubMed
    1. Paul B.D., Snyder S.H. Protein sulfhydration. Methods Enzymol. 2015;555:79–90. doi: 10.1016/bs.mie.2014.11.021. - DOI - PubMed

LinkOut - more resources