. 2023 Nov 2;30(11):1434-1451.e9.
doi: 10.1016/j.stem.2023.10.002.

Development of functional resident macrophages in human pluripotent stem cell-derived colonic organoids and human fetal colon

Affiliations

Development of functional resident macrophages in human pluripotent stem cell-derived colonic organoids and human fetal colon

Jorge O Múnera et al. Cell Stem Cell. .

Abstract

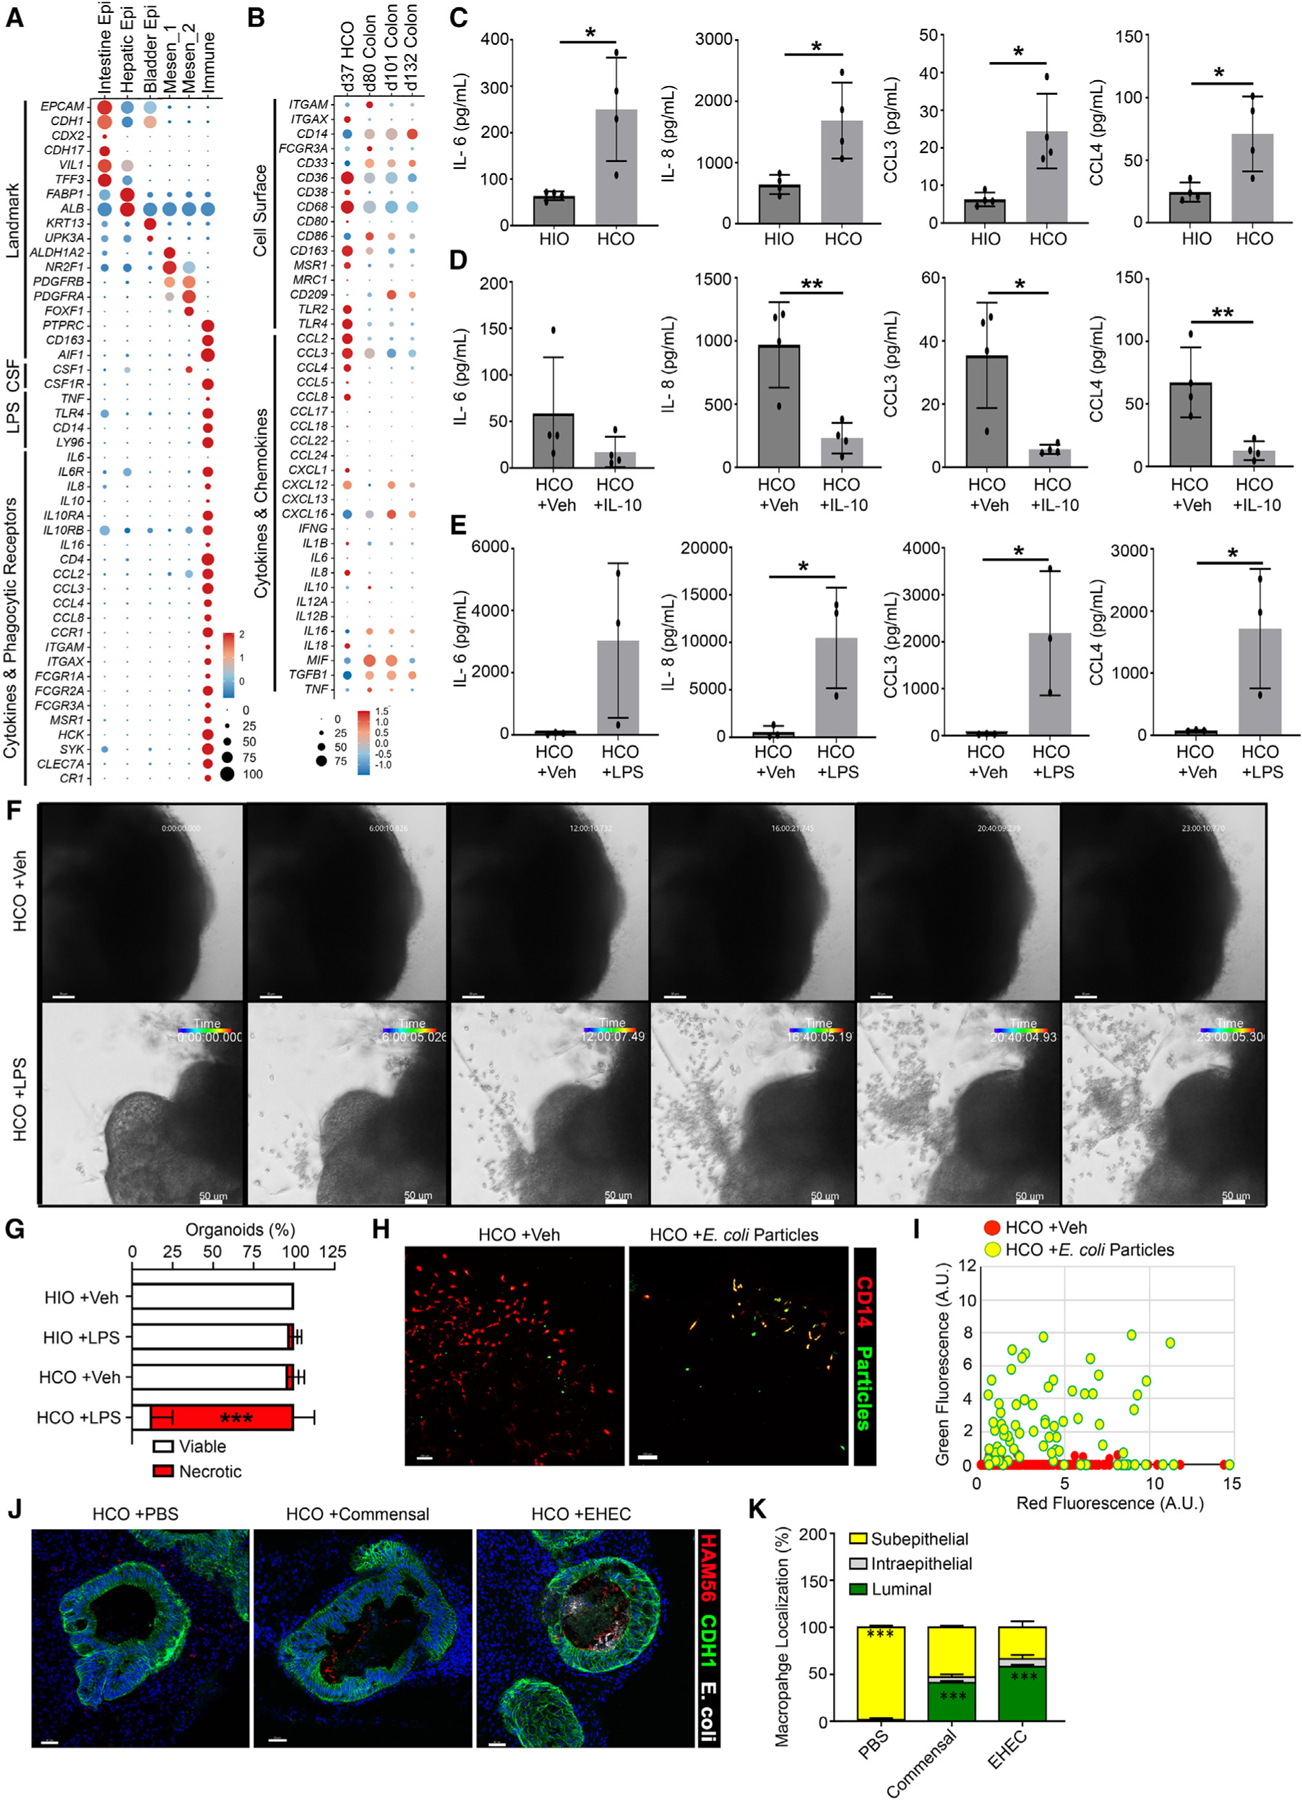
Most organs have tissue-resident immune cells. Human organoids lack these immune cells, which limits their utility in modeling many normal and disease processes. Here, we describe that pluripotent stem cell-derived human colonic organoids (HCOs) co-develop a diverse population of immune cells, including hemogenic endothelium (HE)-like cells and erythromyeloid progenitors that undergo stereotypical steps in differentiation, resulting in the generation of functional macrophages. HCO macrophages acquired a transcriptional signature resembling human fetal small and large intestine tissue-resident macrophages. HCO macrophages modulate cytokine secretion in response to pro- and anti-inflammatory signals and were able to phagocytose and mount a robust response to pathogenic bacteria. When transplanted into mice, HCO macrophages were maintained within the colonic organoid tissue, established a close association with the colonic epithelium, and were not displaced by the host bone-marrow-derived macrophages. These studies suggest that HE in HCOs gives rise to multipotent hematopoietic progenitors and functional tissue-resident macrophages.

Keywords: endothelial-to-hematopoietic transition; hemogenic endothelium; human colonic organoids; tissue-resident macrophages.


Conflict of interest statement

Declaration of interests The authors declare no competing interests.

Figures

Figure 1.
Figure 1.. HE-like cells co-developed in HCO cultures
(A) Wholemount RUNX1 (red), ENDOMUCIN (green), and CDX2 (white) staining of an E10.5 mouse embryo. On the right, optical slices from wholemount showed nuclear RUNX1 staining in the dorsal aorta (DA) and around the hindgut (HG) and liver (Lv) endoderm (n = 3). (B and C) (B) Wholemount RUNX1 (red), CD34 (green), and CDH1 (white) staining and (C) quantification of a day 22 HIO and HCOs showing nuclear RUNX1 staining within CD34+ endothelial tubes in HCOs (n = 3–5). (D) Stereoscopic time-lapse snapshots from day 21 HCO mesenchyme showing an endothelial tube (EC) and hematopoietic cells (HCs) within EC’s lumen (see Video S1). (E) Stereoscopic quantification of the percentage of wells of a 24-well plate containing HIOs or HCOs containing HCs (n = 3 differentiations). (F and G) (F) Immunofluorescent staining and (G) quantification of day 21 HIOs and HCOs for CD34 (green), SPI1 (red), and CDH1 (white) and counterstained with DAPI. A minimum of 5 organoids from each of 2 separate differentiations was analyzed. (H) Relative expression in transcripts per million (TPM) of endothelial and hematopoietic genes from bulk RNA-seq data of day 21 HIOs and HCOs (n = 3 biological replicates, i.e., 3 separate differentiations). (I) Representative flow cytometric analysis of cell suspension stained with CD45 and CD34 following 5 days of culture of isolated day 21 HCO CD34+ cells. (J) Quantification of hemogenic assay across 4 separate differentiations. (K) Schematic showing differences in HIO and HCO protocols. Significance determined by unpaired t test with *p < 0.05, **p < 0.01, ***p < 0.001 (n = 3–5). Scale bars: (A and B) 100 μm in wholemount; (A) 80 μm and (B and F) 50 μm in the optical slices; (D) 20 μm.
Figure 2.
Figure 2.. HCO cultures contained pre-HSC EMPs
(A) Schematic of assays performed on day 21 and 22 HCOs. (B and C) (B) Micrographs of low and higher power magnification of cytospun cells from day 21 HCO cultures. Representative images and (C) quantification of monocytes (Mono), macrophages (Mac), neutrophils (Neu), basophils (Bas), and eosinophils (Eos), unspecified progenitors, erythrocytes (Ery), or lymphoid cells. Pictures and quantification are representative of 4 separate differentiations. (D) Micrographs of colonies formed after day 21 and 22 HCO cell suspensions were cultured in Methocult medium. Representative images of Ery, Mac, granulocyte (G), and mixed myeloid (MM) colonies. (E) Quantification of colony formation in Methocult from HIO and HCOs derived from H1 hESC and control iPSC lines. Results are from 3 biological replicates (colony forming assays from 3 separate differentiations). (F) Relative hemoglobin expression (based on RT-qPCR) of embryonic/primitive HBE1, fetal HBG1/2, and adult HBB subunits from day 22 HCO suspended cells cultured in Methocult. (G) Schematic of differentiation and associated markers of primitive and pre-HSC definitive waves of fetal hematopoiesis. Yolk sac multipotent progenitors (YSMPs), hematopoietic progenitor cells (HPCs), granulocyte-monocyte progenitor (GMP), vitelline vessels (Vit), and umbilical (Umb). (H) Uniform manifold approximation and projection (UMAP) clustering of all hematopoietic cells from the day 22 HCO cultures. (I–K) Relative expression and abundance of select (I) differential expressed genes (DEGs), (J) published nascent HSC signature, and (K) lymphoid lineage markers in each Seurat cluster from day 22 HCO hematopoietic cells. Bolded genes are marker genes from (G). (L) Deduced relationship between RNA expression of day 22 HCO hematopoietic cells and a published CS14 human fetal hematopoietic reference dataset. Similarity score determined by both random forest (RF) and support vector machine (SVM) or a combination of both (ensemble).
Figure 3.
Figure 3.. The differentiation trajectory of macrophages in HCOs resembled that of human embryos
(A and B) UMAP clustering of all hematopoietic cells integrated from the HCO cultures colored by (A) time point or (B) cell type based on random forest predictions using annotations from published fetal macrophage atlas. (C) Relative proportions of predicted cell types in each HCO sample. Numbers above bars represent the total number of hematopoietic cells in each condition. (D) Pseudotime trajectory of day 22, day 28, and day 37 HCO hematopoietic cells. (E and F) Dot or feature plots of relative expression and abundance of differentiation progression from HPCs and lymphoid cells (CD34, CD7, and CD3D) to GMP/myeloblast (RUNX1, MPO, and LYZ) to monocyte/macrophage (FCGR3A, CD14, and CD163). Monocytes/macrophages (hPSC-mono/macro) were derived independent of HCOs. (G and H) UMAP clustering of all hematopoietic cells integrated from all three in vitro HCO time points and published fetal hematopoietic datasets, colored by (G) anatomical sample (left: AGM, yolk sac, pooled vitelline vessels, umbilical cord, placenta or liver, heart, and lung; right; Bian et al. atlas, day 22, day 28, or day 37 HCOs) or (H) Seurat cluster annotated with cell types. Cell-type annotations from Bian et al. reference atlas include YSMP, hematopoietic stem/progenitor cells (HSPCs), erythroid (ErP), and megakaryocyte (MkP) progenitors; mast cells; lympho-myeloid CD7-high (CD7hiP) and -low (CD7loP) progenitors; GMP; myeloblasts; monocytes; and macrophage populations. Markers enriched in specific macrophage cluster are listed. (I) Relative proportions of predicted cell types in each HCO sample and the macrophage and CS14/4.5 week hematopoietic cell atlases. (J) Feature plots of select hematopoietic genes showing the distribution of in pan-immune (PTPRC and SPI1), HPCs (CD34, SPINK2, and C1QTNF4), ErP/MkP (GATA2 and HBE1), CD7hiP/lymphoid (CD7 and CD3D), GMP (MYB and MPO), myeloblast (CEACAM8, LYZ, and S100A12), monocyte (CSF1R, FCGR3A, CD14, and HLA-DRA), and macrophage (CX3CR1, MRC1, LYVE1, CD163, FOLR2, and ADAMDEC1). (K and L) Ensemble similarity score of HCOs hematopoietic cells compared with annotations from (K) fetal hematopoietic or (L) hematopoietic cells from fetal colon reference atlases.
Figure 4.
Figure 4.. HCO macrophages adopted a tissue-resident signature
(A) Wholemount immunofluorescence of day 35 HIOs and HCOs or human colon biopsy stained for macrophage marker CD163 (red), epithelial CDH1 (green), and counterstained with DAPI (n = 2–11). Inset high magnification of human colonic biopsy macrophages. (B) Quantification of CD163+ macrophage in day 35 HIO and HCO wholemounts (n = 6–11). (C–E) (C) Relative expression in TPM of myeloid genes from bulk RNA-seq of day 35 HIOs and HCOs (n = 3 biological replicates). Relative expression of published (D) self-maintaining lamina propria macrophagesor (E) tissue-resident macrophages from day 22, day 28, and day 37 HCO immune cells from scRNA-seq. (F and G) (F) Representative flow cytometric analysis and (G) quantification of gated viable cells expressing monocyte/macrophage marker FCGR1A/CD64 in day 35 HCOs (n = 3). U937 + PMA cells were used a positive control. (H and I) (H) Flow cytometric analysis and (I) quantification of the percentage of gated viable CD64+ cells that co-express the macrophage markers CCR2/CD192, CD14, or TIMD4 from day 35 HCOs (n = 3). (J and K) (J) Heatmap expression of tissue resident macrophage markers expressed in HCOs identified from atlas highlighted in (E) and (K) published fetal colon macrophages. Significance *p < 0.05, **p < 0.01, ***p < 0.001 determined by t test. Scale bars: wholemount 100 μm and biopsy section 50 μm.
Figure 5.
Figure 5.. Monocytes and macrophages in HCOs acquired an intestinal/colonic-like transcriptional signature
(A) Relative expression and abundance of tissue-enriched macrophage markers from the yolk sac, liver, lung, skin, head, or intestine/colonic in day 22, day 28, and day 37 HCO hematopoietic cells or hPSC monocyte/macrophage (mono/macro). Enriched macrophage markers are identified by Bian et al. macrophage atlas or the Yu et al. endodermal atlas for the intestine/colon. (B) Schematic of comparing HCOs to published hematopoietic cells from human fetal endodermal tissue atlas. (C and D) UMAP clustering of all hematopoietic cells integrated from all time points of in vitro HCO cultures and human fetal tissues. UMAPs colored by (C) annotated cell types or (D) organ. (E) Pearson correlation of all RNA from all hematopoietic cells in HCOs and fetal endodermal organs. (F) Relative proportions of HCO hematopoietic cells or hPSC mono/macro that mapped onto reference fetal mono/macro annotated cells from each organ. Mono/macro and organ annotations from reference atlas. (G) Heatmap of the top 20 differentially expressed genes of individual organs from all mono/macro annotated cells from human fetal endodermal atlas across all time points. Same genes in day 22, day 28, and day 37 HCO hematopoietic cells as well as hPSC mono/macro. (H and I) Deduced relationship among RNA expression of day 22, day 28, and day 37 HCO hematopoietic cells; hPSC mono/macro; and a publish human fetal endodermal organ mono/macro reference dataset. Similarity score based on annotated (H) organ or (I) tissue as reference training dataset. Ensemble similarity scoring based on both random forest and SVM predictions. (J and K) UMAP clustering of macro/mono cells integrated from the day 37 HCO and the human fetal endodermal organs scRNA-seq datasets. The human fetal endodermal organ datasets were used as a reference. UMAP clustering colored by (J) organ or (K) Seurat cluster with select differential expressed markers for each cluster. (L) Relative proportions of cells in each Seurat cluster for day 37 HCO and each fetal endodermal organ.
Figure 6.
Figure 6.. HCO macrophages responded to pro- and anti-inflammatory stimuli
(A) Relative expression of cell-type markers, as well as cytokine and phagocytic receptors in day 37 HCOs. (B) Relative expression of cell surface markers, cytokines, and chemokines in day 37 HCO and human fetal colon macrophages. (C–E) Luminex array data for IL-6, IL-8, CCL3, and CCL4 from paired day 35 HIO and HCO samples (from same differentiation). HCOs were (C) untreated or treated with either (D) H20 vehicle (Veh) or IL-10 for 7 days or (E) Veh or LPS for 24 h. Each point represents Luminex values from an individual differentiation (n = 3–4). (F) Micrographs of a live imaging time course of HCOs treated with Veh/H20 or LPS of 24 h time course (see Videos S2 and S3). (G) Quantification of HIO and HCO viability following 24 h of Veh or LPS treatment. (H) Immunofluorescent staining of day 35 HCO with and without pHRODO E. coli particles (green) and CD14 macrophages (red) (see Video S4). (I) Quantitation of phagocytosed particles into CD14+ cells in cultures treated (yellow) with E. coli particles or vehicle treated (red) (n = 3 wells of organoids per group). (J) Immunofluorescent images of day 35 HCOs 24 h after the injection of PBS, commensal E. coli, or pathogenic EHEC stained for CDH1 (green), HAM56/MIF macrophages (red), and E. coli (white) counterstained with DAPI. (K) Spatial quantitation of HAM56 macrophage distribution within the HCOs cultures (n = 3 organoids per group). Significance *p < 0.05, **p < 0.01, ***p < 0.001 determined by t tests. Scale bars: 50 μm (F, H, and J).
Figure 7.
Figure 7.. HCO macrophages persisted long-term within in vivo grafts and were not displaced by bone-marrow-derived murine macrophages
(A) Schematic of transplantation (TXP) of organoids into mouse kidney capsule and H&E images of HIO and HCO grafts following 15 weeks in vivo. (B and C) Immunofluorescence of (B) mouse and human colon biopsy, and (C) 12 week HIO TXP and HCO TXP stained for human CD163 (red) and mouse-specific macrophage marker F4/80 (green) counterstained with DAPI (n = 5 transplanted organoids per condition). (D and E) Quantification of (D) proportions of F4/80+ versus CD163+ macrophages and (E) localization of these macrophages in 12 week HIO TXP and HCO TXPs. (F) Quantification of mouse and human CD45+ cells as a percentage of viable cells in the circulating blood and bone marrow of mice containing HCO TXP for 10–12 weeks. Graph represents mean ± SD. Significance ***p < 0.001 determined by unpaired t test. Scale bars: (A) 100 μm and (B and C) 50 μm.

References

    1. Bain CC, Bravo-Blas A, Scott CL, Perdiguero EG, Geissmann F, Henri S, Malissen B, Osborne LC, Artis D, and Mowat AM (2014). Constant replenishment from circulating monocytes maintains the macrophage pool in the intestine of adult mice. Nat. Immunol 15, 929–937. 10.1038/ni.2967. - DOI - PMC - PubMed
    1. Gomez Perdiguero E, Klapproth K, Schulz C, Busch K, Azzoni E, Crozet L, Garner H, Trouillet C, de Bruijn MF, Geissmann F, and Rodewald HR (2015). Tissue-resident macrophages originate from yolk-sac-derived erythro-myeloid progenitors. Nature 518, 547–551. 10.1038/nature13989. - DOI - PMC - PubMed
    1. Hoeffel G, Chen J, Lavin Y, Low D, Almeida FF, See P, Beaudin AE, Lum J, Low I, Forsberg EC, et al. (2015). C-Myb(+) erythro-myeloid progenitor-derived fetal monocytes give rise to adult tissue-resident macrophages. Immunity 42, 665–678. 10.1016/j.im-muni.2015.03.011. - DOI - PMC - PubMed
    1. Sheng J, Ruedl C, and Karjalainen K (2015). Most tissue-resident macrophages except microglia are derived from fetal hematopoietic stem cells. Immunity 43, 382–393. 10.1016/j.immuni.2015.07.016. - DOI - PubMed
    1. Lazarov T, Juarez-Carreño S, Cox N, and Geissmann F (2023). Physiology and diseases of tissue-resident macrophages. Nature 618, 698–707. 10.1038/s41586-023-06002-x. - DOI - PMC - PubMed

Publication types