. 2023 Nov 22;186(24):5290-5307.e26.
doi: 10.1016/j.cell.2023.10.006. Epub 2023 Nov 2.

Global identification of SWI/SNF targets reveals compensation by EP400

Affiliations

Global identification of SWI/SNF targets reveals compensation by EP400

Benjamin J E Martin et al. Cell. .

Abstract

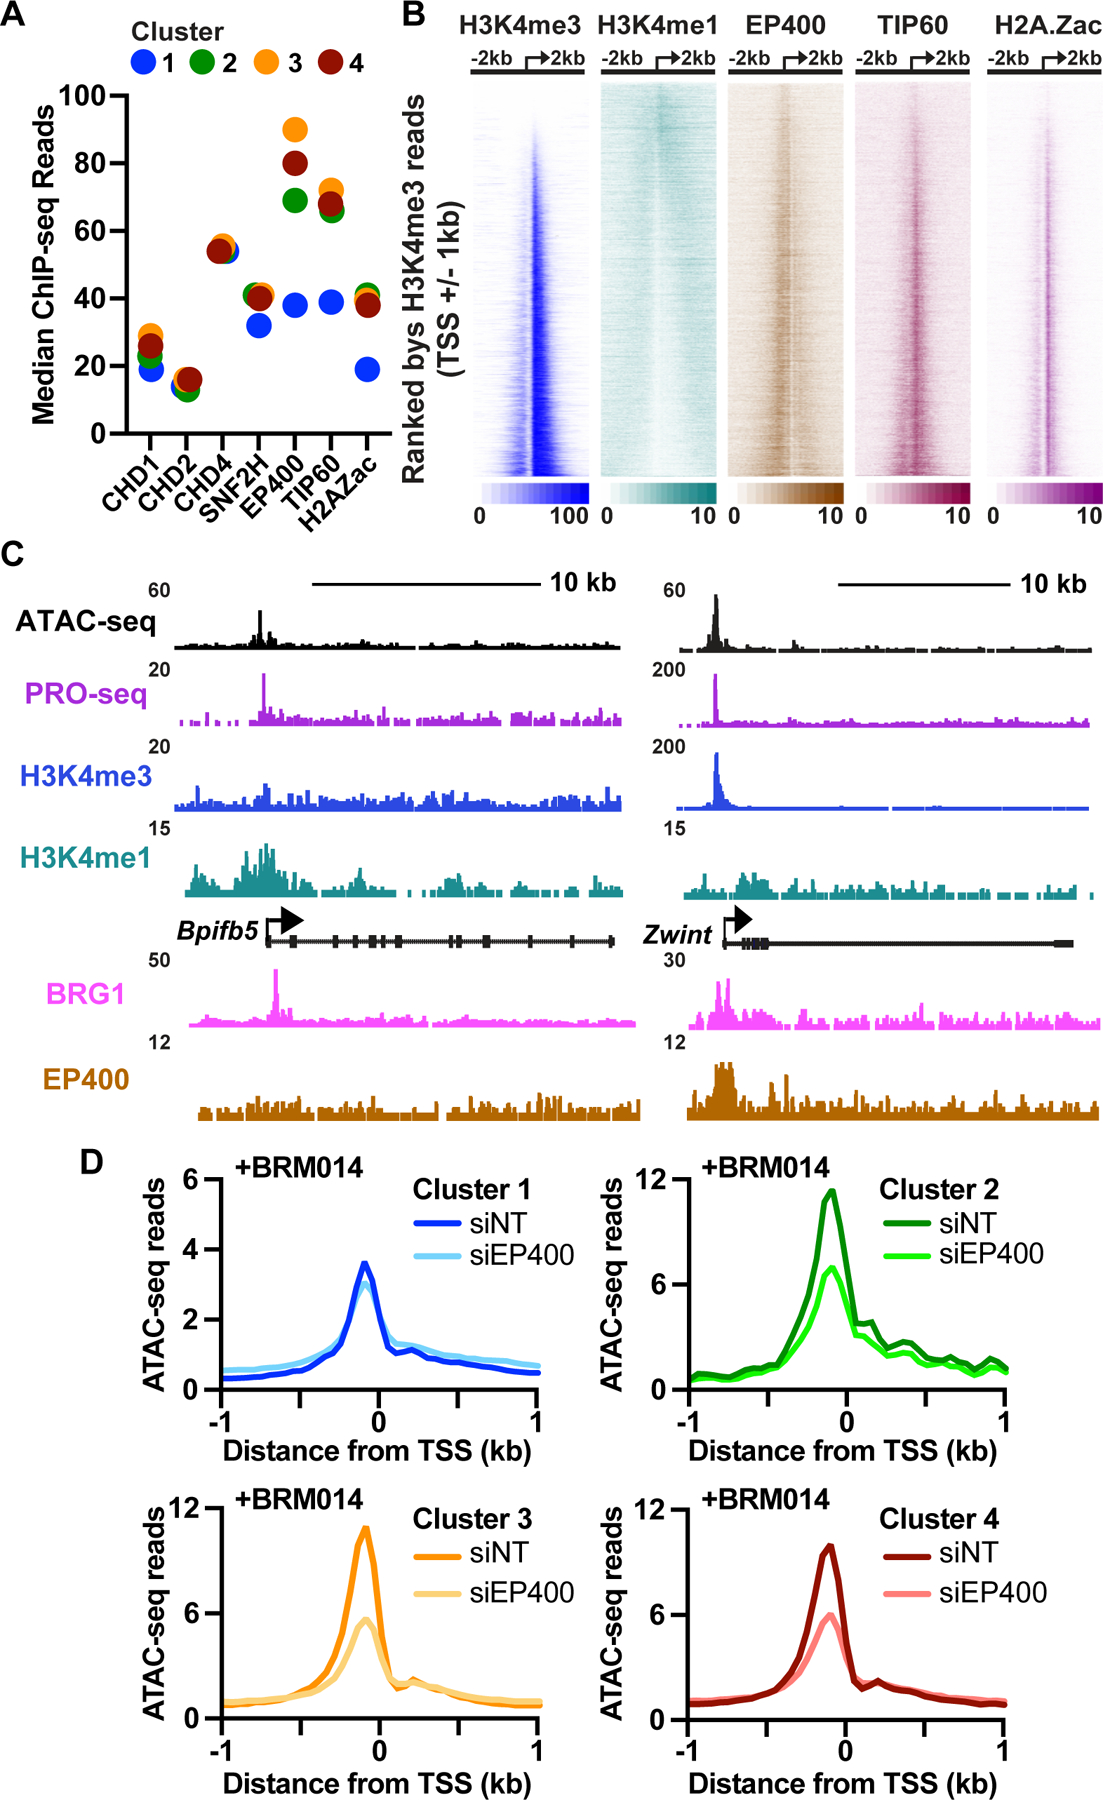
Mammalian SWI/SNF chromatin remodeling complexes move and evict nucleosomes at gene promoters and enhancers to modulate DNA access. Although SWI/SNF subunits are commonly mutated in disease, therapeutic options are limited by our inability to predict SWI/SNF gene targets and conflicting studies on functional significance. Here, we leverage a fast-acting inhibitor of SWI/SNF remodeling to elucidate direct targets and effects of SWI/SNF. Blocking SWI/SNF activity causes a rapid and global loss of chromatin accessibility and transcription. Whereas repression persists at most enhancers, we uncover a compensatory role for the EP400/TIP60 remodeler, which reestablishes accessibility at most promoters during prolonged loss of SWI/SNF. Indeed, we observe synthetic lethality between EP400 and SWI/SNF in cancer cell lines and human cancer patient data. Our data define a set of molecular genomic features that accurately predict gene sensitivity to SWI/SNF inhibition in diverse cancer cell lines, thereby improving the therapeutic potential of SWI/SNF inhibitors.

Keywords: BRG1; EP400; PRO-seq; RNAPII; SWI/SNF; chromatin accessibility; chromatin remodeling; combination therapies; epigenetic regulators; transcription.


Conflict of interest statement

Declaration of interests K.A. is a consultant to Syros Pharmaceuticals and Odyssey Therapeutics, is on the SAB of CAMP4 Therapeutics, and received research funding from Novartis not related to this work.

Figures

Figure 1.
Figure 1.. Enhancer accessibility and activity require SWI/SNF activity
(A) Genome browser view of the Psmd7 promoter (solid box) and associated enhancer (dashed box) with PRO-seq, ATAC-seq, BRG1 ChIP-seq, H3K27ac ChIP-seq, H3K4me3 ChIP-seq and H3K4me1 ChIP-seq data. (B) Heatmap representation of the effects of 2 h BRM014 treatment on ATAC-seq signal at enhancers (n = 32,149). Normalized data from combined replicates (n = 3 per condition) were aligned to the enhancer peak center. Sites are ranked by difference in ATAC-seq reads (Enhancer center +/− 300 bp) between 2 h BRM014 and 2 h DMSO control. BRG1 ChIP-seq signal is shown in the same rank order, as is relative BRG1 signal (summed +/− 500 bp from peak centers). (C) Aggregate plot of quantitative BRG1 ChIP-seq signal (n = 2 per condition) at enhancers from 2 h DMSO- and BRM014-treated cells. Average MNase-seq profiles are shown to indicate the position of the NDR. Data are graphed in 50 bp bins. (D and E) Difference in ATAC-seq signal (D) and PRO-seq signal (E) after BRM014 treatment (n ≥ 2 per condition) for all enhancers. Data were aligned to the enhancer center and rank ordered by the difference in enhancer ATAC-seq reads after 8 h treatment. Blue line between heatmaps indicates the 77% of enhancers that fail to recover accessibility, while red line indicates enhancers that regain accessibility. See also Figures S1 and S2.
Figure 2.
Figure 2.. Promoters recover from SWI/SNF inhibition with variable kinetics
(A) Heatmaps showing the effects of 2 h BRM014 treatment on ATAC-seq signal at promoters (n = 13,536). Data are aligned to TSS. Sites are ranked by difference in ATAC-seq reads after 2 h BRM014 treatment (−450 to +149 bp from the TSS). BRG1 ChIP-seq signal is shown in the same rank order, as is relative BRG1 signal (summed from −750 to +249 bp relative to TSS). (B) Aggregate plot of quantitative BRG1 ChIP-seq signal around promoters in DMSO- and BRM014-treated cells. Average MNase-seq profile is shown to define the position of the NDR. Data are graphed in 50 bp bins. (C and D) Difference in ATAC-seq (C) and PRO-seq (D) signal after BRM014 treatment (compared to time-matched DMSO controls, as in A) for all promoters. Data were aligned to TSS and genes rank ordered by the difference in promoter ATAC-seq reads after 8 h treatment. (E and F) Clustering based on relative differences in ATAC-seq reads (as in C) defines four classes of responses to extended BRM014 treatment. The average value in each cluster for the relative ATAC-seq (−450 to +149 bp from the TSS) and PRO-seq (TSS to +150 nt) signals across the time course are shown at bottom. See also Figure S3.
Figure 3.
Figure 3.. Recovery of gene expression during BRM014 treatment is not dependent on the activity of nearby enhancers
(A) Representation of promoter clusters among genes downregulated or upregulated after 8 h BRM014 treatment, as compared to all active genes longer than 1 kb. Percentages of genes in each cluster are indicated. Differentially expressed genes were those with a Fold-change > 1.5 and P adj < 0.001, based on PRO-seq read density in gene bodies (TSS+250 to TES). (B) Gene body PRO-seq read density is shown at downregulated and upregulated genes. P-values are from Mann-Whitney test. (C) Heatmaps show the effects of 8 h BRM014 treatment on ATAC-seq signal at promoters (right) and their closest enhancers (left) for genes downregulated, unchanged (subsampled, n = 500) and upregulated upon BRM014 treatment. Data are aligned to the enhancer center or gene TSS. (D) ATAC-seq counts (± 300 bp relative to the enhancer center) at the closest enhancers for the genes downregulated (top), unchanged (middle), or upregulated (bottom) after 8 h BRM014 treatment. P-values are from Mann-Whitney test. (E) Genome browser image of ATAC-seq and PRO-seq data at the Eomes promoter (solid box) and associated enhancer (dashed box) in cells treated with BRM014 or DMSO for 8 h. See also Figure S3.
Figure 4.
Figure 4.. Promoters that are sensitive to SWI/SNF inhibition have distinct epigenetic characteristics
(A-C) Aggregate plots of average reads at promoters by cluster for ATAC-seq (A), MNase-seq (B) and PRO-seq (C) signal. Data are graphed in 50 bp bins. Dotted lines in (C) represent antisense strand reads. (D) Percentage of genes by transcript biotype for all annotated genes in each cluster. (E) Bar graph showing percentage of promoters by cluster overlapping a CpG island. (F-H) Aggregate plots of average reads at promoters by cluster for BRG1 ChIP-seq (F), H3K4me3 ChIP-seq (G) and H3K4me1 ChIP-seq (H) signal. Data are graphed in 50 bp bins. See also Figure S4.
Figure 5.
Figure 5.. Epigenetic features of promoters can predict sensitivity to SWI/SNF inhibition or degradation
(A) Clustering based on relative differences in MV411 ATAC-seq reads defines four classes of responses to extended BRM014 treatment. (B) Average relative RNA-seq expression following 24 h BRM014 treatment, by promoter cluster. P-values are from Mann-Whitney test. (C-E) Aggregate plots of average reads at promoters by cluster for ATAC-seq (C), H3K4me3 (D) and H3K4me1 (E) signal. Data are graphed in 50 bp bins. (F) Strategy to predict gene response to prolonged SWI/SNF disruption, using H3K4me1 ChIP-seq and ATAC-seq data. (G) Mean expression changes at genes predicted to be sensitive (blue) or resistant (orange) to SWI/SNF perturbation. The average log2 Fold-change in RNA-seq following SWI/SNF inhibition by 24 h BRM014 treatment in AML cell lines (left), 12 h BRM014 treatment in NSCLC lines (middle) or 12 h degradation by AU-15330 in prostate cancer lines (right) is shown. Error bars represent SEM. See Methods for data sources and number of genes in each group. (H) Mean expression changes at genes predicted to be sensitive to SWI/SNF perturbation in DIPG cell lines using ATAC-seq data. Shown are the average log2 Fold-changes in RNA-seq following 24 h treatment with BRM014 (BT869) or AU-15330 (DIPG007). Error bars represent SEM. See Methods for data sources and number of genes in each group. (I) Venn diagram showing the overlap between genes downregulated following SWI/SNF inhibition or degradation as described for panels G and H. Downregulated genes had a Fold-change > 1.5 and P adj < 0.001 in RNA-seq. (J) Top enriched Hallmark gene sets in genes downregulated by SWI/SNF inhibition or degradation in each cell line. See also Figure S5.
Figure 6.
Figure 6.. Recovery of accessibility at promoters following SWI/SNF inhibition is dependent on EP400/TIP60
(A) Median ChIP-seq signal (± 500 bp relative to TSS) for CHD1, CHD2, CHD4, SNF2H, EP400, TIP60 and H2A.Zac across each promoter cluster. (B) Heatmaps of H3K4me3, H3K4me1, EP400, TIP60 and H2A.Zac. Data are aligned to TSS and genes rank ordered by promoter H3K4me3 signal (± 1kb around TSS). (C) Genome browser images of representative SWI/SNF sensitive gene Bpifb5 (left) and resistant gene Zwint (right). (D) Aggregate plots of ATAC-seq signal at promoters in each cluster, following 4 h BRM014 treatment under siNT conditions (n ≥ 2 per condition), graphed in 50 bp bins. See also Figure S6.
Figure 7.
Figure 7.. SWI/SNF activity is essential in non-small cell lung cancer cells lacking EP400
(A) NSCLC mutation data accessed through the cBio Portal (n = 3,311). Mutations of unknown significance were removed, and only samples profiling all 3 genes were analyzed. Fisher’s exact test performed for mutually exclusive relationship between EP400 and BRG1/ARID1A mutations. The percentage of samples with the indicated mutations are indicated. (B) Drug dose response curves of wildtype and EP400-KO NSCLC (A549) cells following 8 days of treatment with BRM014. Each curve represents an independent experiment of the indicated cell line (n = 3 for wildtype and n = 4 for EP400-KO). Errors bars represent the SEM of three technical replicates. (C) Quantification of IC50 values from the dose response curves plotted in B. Error bars represent SEM. Individual values plotted as circles. P-values calculated by t-test. (D) Drug dose response curves of wildtype and EP400-KO A549 cells following 8 days of treatment with AU-15330. Each curve represents an independent experiment of the indicated cell line (n = 3 for wildtype and n = 4 for EP400-KO). Errors bars represent the SEM of three technical replicates. (E) Quantification of IC50 values from the dose response curves plotted in D. Error bars represent SEM. Individual values plotted as circles. P-values calculated by t-test. (F) Drug dose response curves of sgNT and sgEP400 expressing prostate cancer (LNCaP) cells following 8 days of treatment with BRM014. Each curve represents an independent experiment of the indicated cell line (n = 2). Errors bars represent the SEM of three technical replicates. (G) Quantification of IC50 values from the dose response curves plotted in B. Error bars represent SEM. Individual values plotted as circles. P-values calculated by t-test. (H) Drug dose response curves of sgNT and sgEP400 expressing AML (MOLM13) cells following 8 days of treatment with BRM014. Each curve represents an independent experiment of the indicated cell line (n = 2). Errors bars represent the SEM of three technical replicates. (I) Quantification of IC50 values from the dose response curves plotted in B. Error bars represent SEM. Individual values plotted as circles. P-values calculated by t-test. (J) Competitive growth of GFP or shRNA expressing AML (MV411) cells. GFP cells were initially mixed at 15% of the population. Following 8 days of treatment with BRM014 or DMSO the % of GFP cells was measured by flow cytometry. Each bar represents independently grown replicates (n=2). See also Figure S7.

References

    1. Clapier CR, Iwasa J, Cairns BR, and Peterson CL (2017). Mechanisms of action and regulation of ATP-dependent chromatin-remodelling complexes. Nat Rev Mol Cell Bio 18, 407–422. 10.1038/nrm.2017.26. - DOI - PMC - PubMed
    1. Narlikar GJ, Sundaramoorthy R, and Owen-Hughes T (2013). Mechanisms and Functions of ATP-Dependent Chromatin-Remodeling Enzymes. Cell 154, 490–503. 10.1016/j.cell.2013.07.011. - DOI - PMC - PubMed
    1. Dieuleveult M. de, Yen K, Hmitou I, Depaux A, Boussouar F, Dargham DB, Jounier S, Humbertclaude H, Ribierre F, Baulard C, et al. (2016). Genome-wide nucleosome specificity and function of chromatin remodellers in ES cells. Nature 530, 113–116. 10.1038/nature16505. - DOI - PMC - PubMed
    1. Barisic D, Stadler MB, Iurlaro M, and Schübeler D (2019). Mammalian ISWI and SWI/SNF selectively mediate binding of distinct transcription factors. Nature 569, 136–140. 10.1038/s41586-019-1115-5. - DOI - PMC - PubMed
    1. Brown SA, Imbalzano AN, and Kingston RE (1996). Activator-dependent regulation of transcriptional pausing on nucleosomal templates. Gene Dev 10, 1479–1490. 10.1101/gad.10.12.1479. - DOI - PubMed

Publication types