. 2024 Jan 3;112(1):141-154.e8.
doi: 10.1016/j.neuron.2023.10.002. Epub 2023 Nov 2.

Dopamine pathways mediating affective state transitions after sleep loss

Affiliations

Dopamine pathways mediating affective state transitions after sleep loss

Mingzheng Wu et al. Neuron. .

Abstract

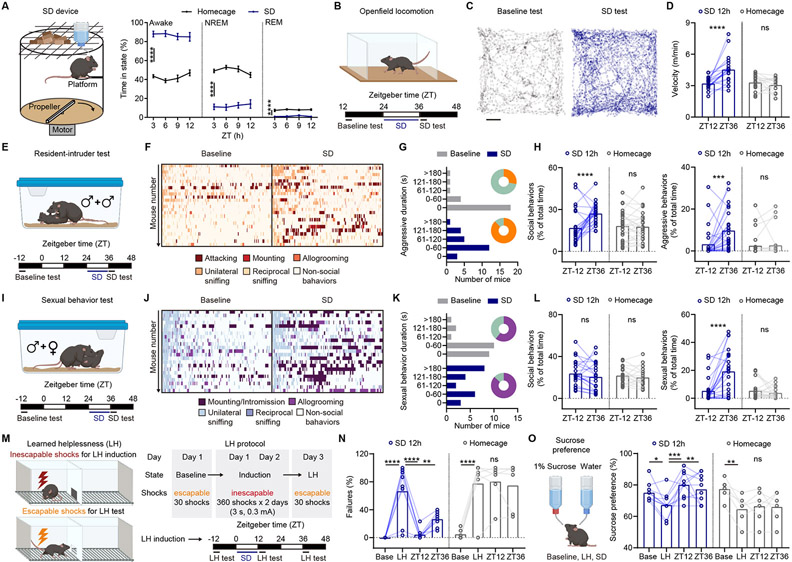
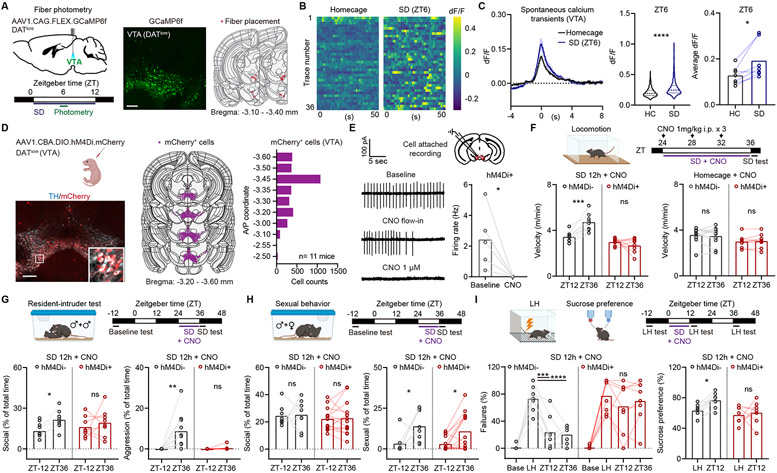
The pathophysiology of affective disorders-particularly circuit-level mechanisms underlying bidirectional, periodic affective state transitions-remains poorly understood. In patients, disruptions of sleep and circadian rhythm can trigger transitions to manic episodes, whereas depressive states are reversed. Here, we introduce a hybrid automated sleep deprivation platform to induce transitions of affective states in mice. Acute sleep loss causes mixed behavioral states, featuring hyperactivity, elevated social and sexual behaviors, and diminished depressive-like behaviors, where transitions depend on dopamine (DA). Using DA sensor photometry and projection-targeted chemogenetics, we reveal that elevated DA release in specific brain regions mediates distinct behavioral changes in affective state transitions. Acute sleep loss induces DA-dependent enhancement in dendritic spine density and uncaging-evoked dendritic spinogenesis in the medial prefrontal cortex, whereas optically mediated disassembly of enhanced plasticity reverses the antidepressant effects of sleep deprivation on learned helplessness. These findings demonstrate that brain-wide dopaminergic pathways control sleep-loss-induced polymodal affective state transitions.

Keywords: affective state; chemogenetics; dopamine; photometry; plasticity; sleep.


Conflict of interest statement

Declaration of interests The authors declare no competing interests.

Figures

Figure 1.
Figure 1.. Acute sleep deprivation induces behavioral state transitions
(A). Left, schematic of the hybrid sleep deprivation (SD) apparatus. Right, validation by EEG and EMG recording. n = 4-5 animals/group. Two-way ANOVA, homecage vs SD, Awake, p < 0.0001, NREM, p < 0.0001, REM, p < 0.0001. (B). Schematic showing the timeline for open field locomotion tests before (grey) and after (blue) SD. (C). Trajectories of locomotor activity in the baseline and SD conditions for one mouse (10 min). Scale bar: 5 cm. (D). Summary data showing the distance traveled in the open field locomotion test at ZT12 and ZT36 for SD and homecage control mice. n = 21 (SD) and 15 (homecage). Two-way ANOVA, interaction, p = 0.0003, Sidak’s multiple comparison, ZT12 vs ZT36, SD, p < 0.0001, homecage, p = 0.6714. (E). Schematic showing the timeline for resident-intruder tests before and after SD. (F). Plots showing behavioral motif classifications in individual resident mice before and after SD. (G). Distribution of aggressive behavior in mice before and after SD, based on time spent attacking smaller male conspecifics. Pie charts show the proportion of mice displaying aggressive behaviors (orange) before and after acute SD. n = 25. (H). Left, summary data show the total time spent engaged in social interactions during the resident-intruder test at ZT-12 and ZT36. n = 25 (SD) and 25 (homecage). Two-way ANOVA, interaction, p = 0.0011, Sidak’s multiple comparison, ZT-12 vs ZT36, SD, p < 0.0001, homecage, p = 0.9649. Right, same as left but for aggressive behaviors. Two-way ANOVA, interaction, p = 0.0082, Sidak’s multiple comparison, ZT-12 vs ZT36, SD, p = 0.0004, homecage, p = 0.9924. (I). Schematics showing the timeline for sexual behavior tests before and after SD. (J). Plots show behavioral motif classifications of individual resident mice towards receptive females before and after SD. (K). Distribution of sexual behavior timing in mice before and after SD, based on time spent engaging in sexual behaviors with a receptive female. Pie charts show the proportion of mice displaying sexual behaviors (purple) before and after acute SD. n = 23. (L). Left, summary data show the total time spent interacting with receptive females for the male residents at ZT-12 and ZT36. n = 23 (SD) and 18 (homecage). Two-way ANOVA, interaction, p = 0.6662, Sidak’s multiple comparison, ZT-12 vs ZT36, SD, p = 0.2711, homecage, p = 0.7181. Right, same as left, but for mounting behavior. Two-way ANOVA, interaction, p = 0.0002, Sidak’s multiple comparison, ZT-12 vs ZT36, SD, p < 0.0001, homecage, p = 0.8430. (M). Schematics show the timeline for learned helplessness (LH) induction and escape tests before and after SD. (N). Summary data show the percentage of failures to escape an avoidable foot-shock across conditions. n = 8 (SD) and 6 (homecage). Two-way ANOVA, interaction, p < 0.0001. Sidak’s multiple comparison test vs LH, Baseline, p < 0.0001 (SD), p < 0.0001 (homecage), ZT12, p < 0.0001 (SD), p > 0.9999 (homecage), ZT36, p = 0.0018 (SD), p > 0.9999 (homecage). (O). Left, schematics show the conditions for sucrose preference test. Right, summary data show the percentage of sucrose preference by volume consumed across conditions. n = 10 (SD) and 6 (homecage). Two-way ANOVA, interaction, p = 0.0017. Holm-Sidak’s multiple comparison test vs LH, Baseline, p = 0.0345 (SD), p = 0.0053 (homecage), ZT12, p = 0.0002 (SD), p > 0.9307 (homecage), ZT36, p = 0.0053 (SD), p > 0.9307 (homecage). Male mice were used in the tests for behavioral evaluation across multiple categories. *p < 0.05, ** p < 0.01, *** p < 0.001, **** p < 0.0001. ns, not significant. Error bars reflect SEM. See also Figure S1-4.
Figure 2.
Figure 2.. State transitions after sleep deprivation engage VTA DA neuron activity
(A). Left, schematic showing viral transduction and the timeline of photometry recording during SD. Middle, histological image showing the expression of GCaMP6f in the VTA. Scale bar: 200 μm. Right, fiber placement in coronal brain sections registered to the Common Coordinate Framework, 1–2 sections for each animal. n = 7 animals. (B). Heatmap plots showing spontaneous VTA DA calcium transients at ZT6 in the home cage or during SD. Sequential traces from a single mouse are plotted. (C). Left, average spontaneous calcium transients in VTA DA neurons in the home cage or during SD from all animals, with peak dF/F aligned to zero. Middle, violin plots show amplitude distribution of spontaneous calcium transients in the home cage (520 transients, 75.1 ± 8.5) and during SD (569 transients, 80.86 ± 4.1) from 7 animals, Two-tailed unpaired t test, p < 0.0001. Right, the average amplitude of spontaneous calcium transients for 7 individual animals in the home cage or during SD, Two-tailed paired t test, p = 0.0221. (D). Left, schematic showing neonatal viral transduction and hM4Di-mCherry expression in tyrosine hydroxylase (TH) expressing cells in the VTA. Scale bar: 200 μm. Middle, mCherry expression in single neurons in coronal sections registered to the Common Coordinate Framework. Right, summary data showing the number of mCherry+ cells across the anterior-posterior axis. (E). Left, cell-attached recording of spontaneous spiking in mCherry+ VTA neuron before, during, and after bath application of 1 μM clozapine-N-oxide (CNO). Right, summary data showing the firing rate of hM4Di+ neurons before and after CNO application. Two-tailed paired t test, p = 0.0479. n = 5 cells from 2 animals. (F). Top, schematic showing the timeline of locomotion tests and CNO administration. Bottom left, summary data of distance traveled in the open field locomotion tests at ZT12 and ZT36 with CNO treatment for hM4Di and hM4Di+ mice. Two-way ANOVA, Sidak’s multiple comparison, ZT12 vs ZT36, hM4Di, p = 0.0003, hM4Di+, p = 0.4304. Bottom right, same as left, but for homecage controls, Two-way ANOVA, Sidak’s multiple comparison, ZT12 vs ZT36, hM4Di, p = 0.7479, hM4Di+, p = 0.9621. n = 8 animals/group (SD). n = 11 hM4Di and 8 hM4Di+ (homecage). (G). Top, schematic shows the timeline for resident-intruder tests before and after SD with CNO treatment. Bottom left, summary data for the total time spent in social interactions during the resident-intruder test for hM4Di and hM4Di+ mice at ZT-12 and ZT36. n = 10 hM4Di and 8 hM4Di+ animals. Two-way ANOVA, Sidak’s multiple comparison, ZT-12 vs ZT36, hM4Di, p = 0.0375, hM4Di+, p = 0.6194. Bottom right, same as left but for aggressive behaviors. Two-way ANOVA, Sidak’s multiple comparison, ZT-12 vs ZT36, hM4Di, p = 0.0011, hM4Di+, p = 0.9766. (H). Top, schematic shows the timeline for sexual behavior tests before and after SD with CNO treatment. Bottom left, summary data for the total time spent in social interactions for hM4Di and hM4Di+ mice at ZT-12 and ZT36. n = 8 hM4Di and 14 hM4Di+. Two-way ANOVA, Sidak’s multiple comparison, ZT-12 vs ZT36, hM4Di, p = 0.9778, hM4Di+, p = 0.9809. Bottom right, same as left but for sexual behaviors. Two-way ANOVA, Sidak’s multiple comparison, ZT-12 vs ZT36, hM4Di, p = 0.0194, hM4Di+, p = 0.0242. (I). Top, schematic shows the timeline of LH escape tests before and after SD with CNO treatment. Bottom left, summary data for the percentage of failures to escape across conditions in hM4Di and hM4Di+ mice. n = 7 hM4Di and 8 hM4Di+ animals. Two-way ANOVA, Sidak’s multiple comparison test vs LH, ZT12, p = 0.0001 (hM4Di), p = 0.7238 (hM4Di+), ZT36, p < 0.0001 (hM4Di), p = 0.9976 (hM4Di+). Bottom right, same as left but for sucrose preference, n = 9 hM4Di and hM4Di+ animals. Two-way ANOVA, Holm-Sidak’s multiple comparison test LH vs ZT12, p = 0.0437 (hM4Di), p = 0.6207 (hM4Di+). Male and female mice were tested in A-F, and I. Male mice were tested in G and H. *p < 0.05, ** p < 0.01, *** p < 0.001, **** p < 0.0001. ns, not significant. See also Figure S5.
Figure 3.
Figure 3.. Sleep deprivation shapes spontaneous dopamine release
(A). Top, schematic showing viral transduction of AAV9.hSyn.GRABDA in the Nucleus Accumbens (NAc). Bottom, image showing the expression of GRABDA in the NAc and fiber placement. Scale bar: 200 μm. (B). Heatmap plots showing spontaneous DA transients in the NAc at ZT6 in the home cage, during SD, and following chemogenetic inhibition of VTA DA neurons (CNO 1mg/kg, i.p.). (C). Top, average trace of spontaneous DA transients in the NAc in the home cage (93 transients) and during SD (115 transients) from 10 animals. Transients were aligned to onset at t = 30 sec. Bottom left, summary data showing the frequency (events/min) of spontaneous DA transients from individual animals in the home cage, during SD, and following CNO administration (n = 10). RM One-way ANOVA, p < 0.0001. Sidak’s multiple comparison test, HC vs SD, p = 0.1027, SD vs CNO, p < 0.0001. Bottom right, the cumulative area under the curve (AUC) for all spontaneous DA transients in 30-minute-long GRABDA photometry recordings from individual animals. RM One-way ANOVA, p < 0.0001. Sidak’s multiple comparison test, HC vs SD, p = 0.0002, SD vs CNO, p < 0.0001. (D-E). Same as (A-B), but for DA transients in the mPFC. (F). Top, average spontaneous DA transients in the mPFC in the home cage (62 transients) and during SD (76 transients) from 7 animals. Bottom left, RM One-way ANOVA, p = 0.0318. Sidak’s multiple comparison test, HC vs SD, p = 0.4168, SD vs CNO, p = 0.0285. Bottom right, RM One-way ANOVA, p < 0.0001. Sidak’s multiple comparison test, HC vs SD, p < 0.0001, SD vs CNO, p < 0.0001. (G-H). Same as (A-B), but for DA transients in the hypothalamic area (HA). (I). Top, average spontaneous DA transients in the HA in the home cage (49 transients) and during SD (88 transients) from 7 animals. Bottom left, RM One-way ANOVA, p < 0.0001. Sidak’s multiple comparison test, HC vs SD, p = 0.0003, SD vs CNO, p = 0.0002. Bottom right, RM One-way ANOVA, p < 0.0001. Sidak’s multiple comparison test, HC vs SD, p < 0.0001, SD vs CNO, p < 0.0001. (J-K). Same as (A-B), but for DA transients in the dorsal striatum (dStr). (L). Top, average spontaneous DA transients in the dStr in the home cage (35 transients) and during SD (23 transients) from 8 animals. Bottom left, RM One-way ANOVA, p = 0.0673. Sidak’s multiple comparison test, HC vs SD, p = 0.3556, SD vs CNO, p = 0.7575. Bottom right, RM One-way ANOVA, p = 0.2862. Sidak’s multiple comparison test, HC vs SD, p = 0.8326, SD vs CNO, p = 0.7848. Male and female mice were tested in A-L. *p < 0.05, *** p < 0.001, **** p < 0.0001. ns, not significant. See also Figure S6 and S7.
Figure 4.
Figure 4.. Distinct DA neuronal projections mediate SD-associated behavioral shifts
(A). Top, schematic shows projection-specific viral transduction strategies for targeting NAc-projecting, mPFC-projecting, locally projecting hypothalamic, and dStr-projecting DA neurons. Bottom, histological images show mCherry+ DA axonal terminals, mCherry+ cell bodies and TH+ cell bodies in relevant brain regions. Scale bar: 200 μm. (B). Schematic showing the timeline of CNO administration and behavioral tests. (C). Summary data for distance traveled in the open field locomotion in baseline and after SD with chemogenetic inhibition of different subgroups of hM4Di+ DA neurons. Two-way ANOVA, Sidak’s multiple comparison, Baseline vs SD + CNO, VTA-NAc (n = 10), p = 0.0827, VTA-mPFC (n = 13), p = 0.0106, HA (n = 8), p = 0.0028, SNc-dStr (n = 10), p < 0.0001. (D). Left, summary data for social interactions in resident-intruder tests in baseline and after SD with chemogenetic inhibition of different subgroups of hM4Di+ DA neurons. Two-way ANOVA, Sidak’s multiple comparison, Baseline vs SD + CNO, VTA-NAc (n = 15), p = 0.1995, VTA-mPFC (n = 11), p = 0.3045, HA (n = 10), p = 0.9993, SNc-dStr (n = 11), p = 0.0007. Right, same as left, but for aggressive behaviors. Two-way ANOVA, Sidak’s multiple comparison, Baseline vs SD + CNO, VTA-NAc, p = 0.0490, VTA-mPFC, p > 0.9999, HA, p = 0.0219, SNc-dStr, p < 0.0001. (E). Left, summary data for social interactions with receptive females in baseline and after SD with chemogenetic inhibition of different subgroups of hM4Di+ DA neurons. Two-way ANOVA, Sidak’s multiple comparison, Baseline vs SD + CNO, VTA-NAc (n = 13), p = 0.3292, VTA-mPFC (n = 10), p = 0.9897, HA (n = 12), p > 0.9999, SNc-dStr (n = 9), p = 0.3181. Right, same as left, but for sexual behaviors. Two-way ANOVA, Sidak’s multiple comparison, Baseline vs SD + CNO, VTA-NAc, p = 0.0046, VTA-mPFC, p = 0.0058, HA, p = 0.8924, SNc-dStr, p = 0.0092. (F). Summary data for the percentage of failures to escape across conditions in mice with chemogenetic inhibition of hM4Di+ neurons during SD. Two-way ANOVA, Sidak’s multiple comparison test vs LH, VTA-NAc (n = 8), SD + CNO, SD 24h, p < 0.0001; VTA-mPFC (n = 9), SD + CNO, p = 0.5992, SD 24h, p = 0.9925; HA (n = 8), SD + CNO, SD 24h, p < 0.0001; SNc-dStr (n = 7), SD + CNO, SD 24h, p < 0.0001. Male and female mice were tested in C and F. Male mice were tested in D and E. *p < 0.05, ** p < 0.01, *** p < 0.001, **** p < 0.0001. ns, not significant. See also Figure S8.
Figure 5.
Figure 5.. Antidepressant effects of acute sleep loss require Drd1-dependent enhancement of dendritic spine plasticity
(A). Top, schematic showing neonatal viral transduction of EGFP in wild type (WT) and Drd1ff animals for dendritic spine density analysis and glutamate-evoked spinogenesis. Thy1-EGFP animals in WT background were only used for dendritic spine density analysis. Bottom, timeline of SD and dendritic spine density measurements. (B). Example 2PLSM images of EGFP-expressing distal dendrites of deep layer mPFC pyramidal neurons in baseline condition and after SD, as noted. Scale, 2 μm. (C). Summary data show dendritic spine density on distal dendrites from deep layer mPFC pyramidal neurons in WT (Thy1-EGFP, Left) and Drd1ff (virally transduced EGFP, Right) animals in the baseline condition and after SD. Two-tailed unpaired t test, WT (n = 7 animals for baseline and 6 for SD), p = 0.0019, Drd1 ff (n = 6 animals/group), p = 0.9423. (D). Top, schematic illustration of glutamate-evoked de novo spinogenesis platform with MNI-glutamate uncaging parameters for the induction of new dendritic spines. Bottom, timeline of SD and spinogenesis experiments. (E). Example 2PLSM images of an example of successful induction of glutamate-evoked spinogenesis in an EGFP-expressing distal dendrite of deep layer mPFC pyramidal neuron. Scale bar, 2 μm. (F). Summary data for the probability of spinogenesis on deep layer mPFC neurons in WT (Left) and Drd1ff (Right) animals in baseline condition and after SD. Two-tailed unpaired t test, WT (n = 8 animals for baseline and 7 for SD), p = 0.0005, Drd1ff (n = 5 animals/group), p = 0.5234. (G). Schematic showing the shrinkage of newly formed dendritic spines induced by the photoactivation of PaRac1 after SD-induced plasticity changes. (H). Schematic showing the design of PaRac1 construct and bilateral implantation of optical fibers following viral transduction. (I). Image showing the expression of mVenus-PaRac1 and the location of fiber implantation. Scale bar: 500 μm. (J). Schematics showing the timeline of LH test and PaRac1 activation after acute SD. (K). Left, summary data for the percentage of failures to escape across conditions in mice with PaRac1 photoactivation 0.5h after SD. n = 7 animals/group. RM two-way ANOVA, Sidak’s multiple comparison test, PaRac1 vs Fluorophore, Baseline, p > 0.9999, LH, p = 0.7653; SD, p = 0.9917, SD 24h, p = 0.0102. Right, same as left, but for photoactivation 24h after SD. n = 9 animals in PaRac1 and 7 in fluorophore. RM two-way ANOVA, Sidak’s multiple comparison test, PaRac1 vs Fluorophore, Baseline, p > 0.9999, LH, p = 0.5539; SD, p = 0.9792, SD 24h, p < 0.0001. Male and female mice were tested in A-K. *p < 0.05, **p < 0.01, *** p < 0.001, *** p < 0.001. ns, not significant. Dots represent data from individual animals. Error bars reflect SEM. See also Figure S9.

Similar articles

Cited by

References

    1. Davidson RJ (1998). Affective Style and Affective Disorders: Perspectives from Affective Neuroscience. Cogn. Emot 12, 307–330. 10.1080/026999398379628. - DOI
    1. Vos T, Barber RM, Bell B, Bertozzi-Villa A, Biryukov S, Bolliger I, Charlson F, Davis A, Degenhardt L, Dicker D, et al. (2015). Global, regional, and national incidence, prevalence, and years lived with disability for 301 acute and chronic diseases and injuries in 188 countries, 1990–2013: a systematic analysis for the Global Burden of Disease Study 2013. Lancet 386, 743–800. 10.1016/S0140-6736(15)60692-4. - DOI - PMC - PubMed
    1. Belmaker RH, and Agam G (2008). Major Depressive Disorder. N. Engl. J. Med 358, 55–68. 10.1056/NEJMra073096. - DOI - PubMed
    1. Belmaker RH (2004). Bipolar Disorder. N. Engl. J. Med 351, 476–486. 10.1056/NEJMra035354. - DOI - PubMed
    1. Grande I, Berk M, Birmaher B, and Vieta E (2016). Bipolar disorder. Lancet 387, 1561–1572. 10.1016/S0140-6736(15)00241-X. - DOI - PubMed

LinkOut - more resources