. 2023 Nov 14;56(11):2584-2601.e7.
doi: 10.1016/j.immuni.2023.10.002. Epub 2023 Nov 2.

Single-cell epigenetic, transcriptional, and protein profiling of latent and active HIV-1 reservoir revealed that IKZF3 promotes HIV-1 persistence

Affiliations

Single-cell epigenetic, transcriptional, and protein profiling of latent and active HIV-1 reservoir revealed that IKZF3 promotes HIV-1 persistence

Yulong Wei et al. Immunity. .

Abstract

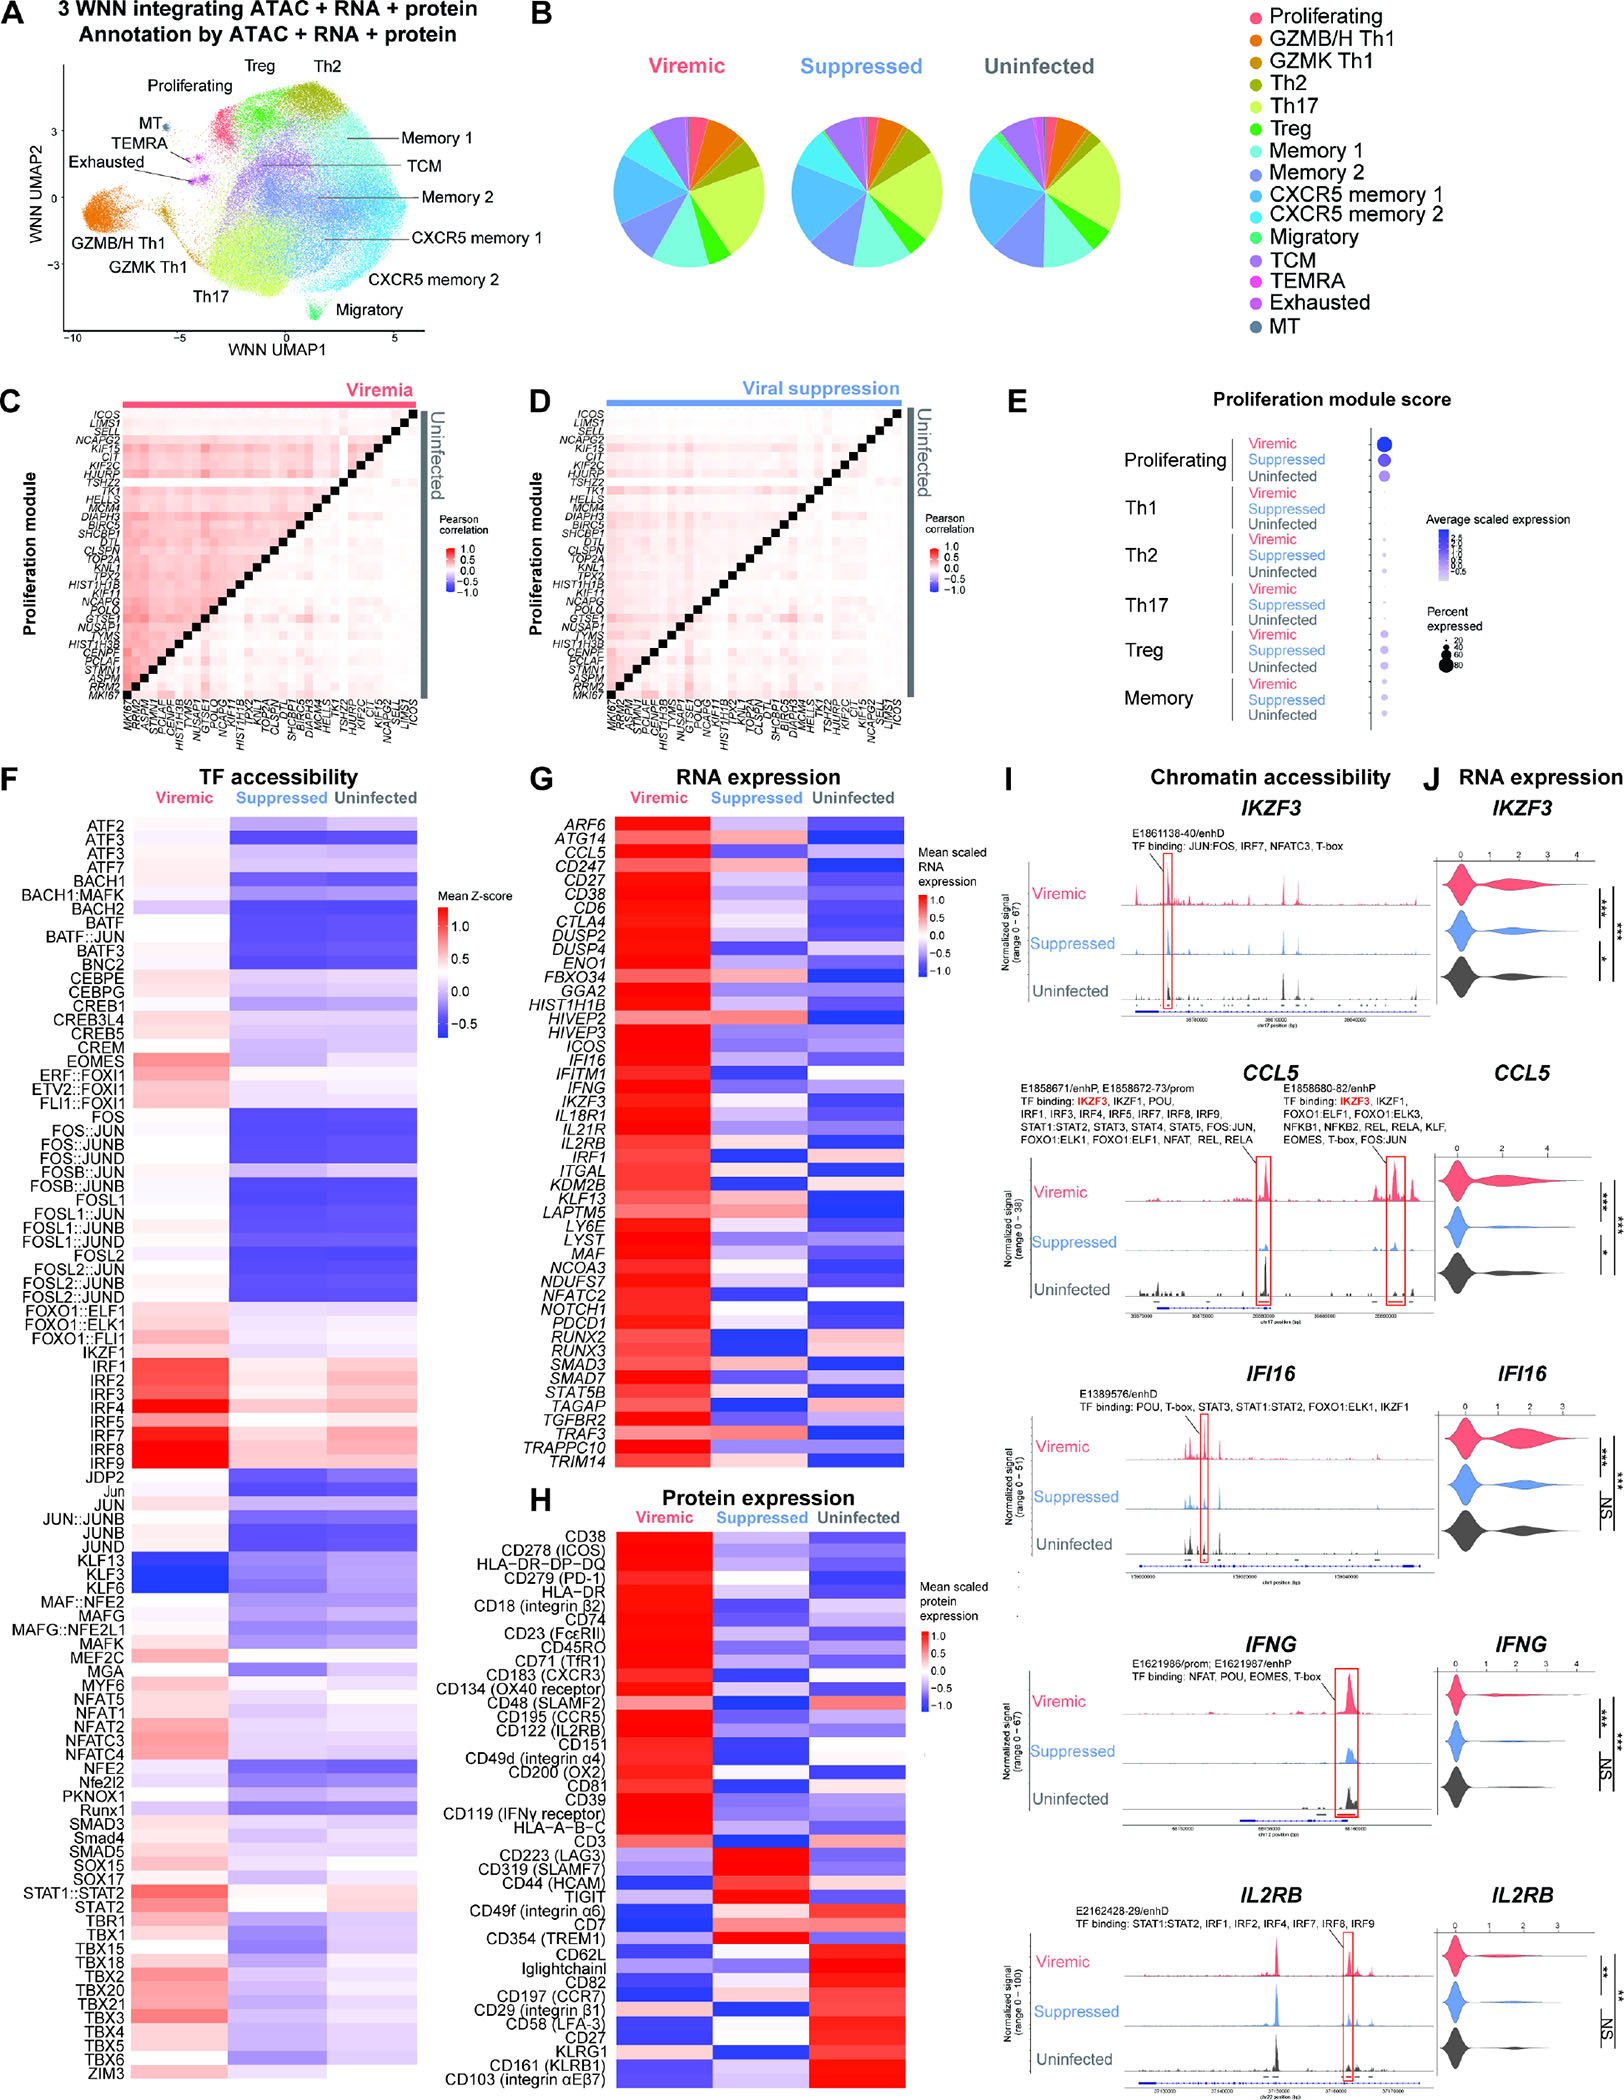
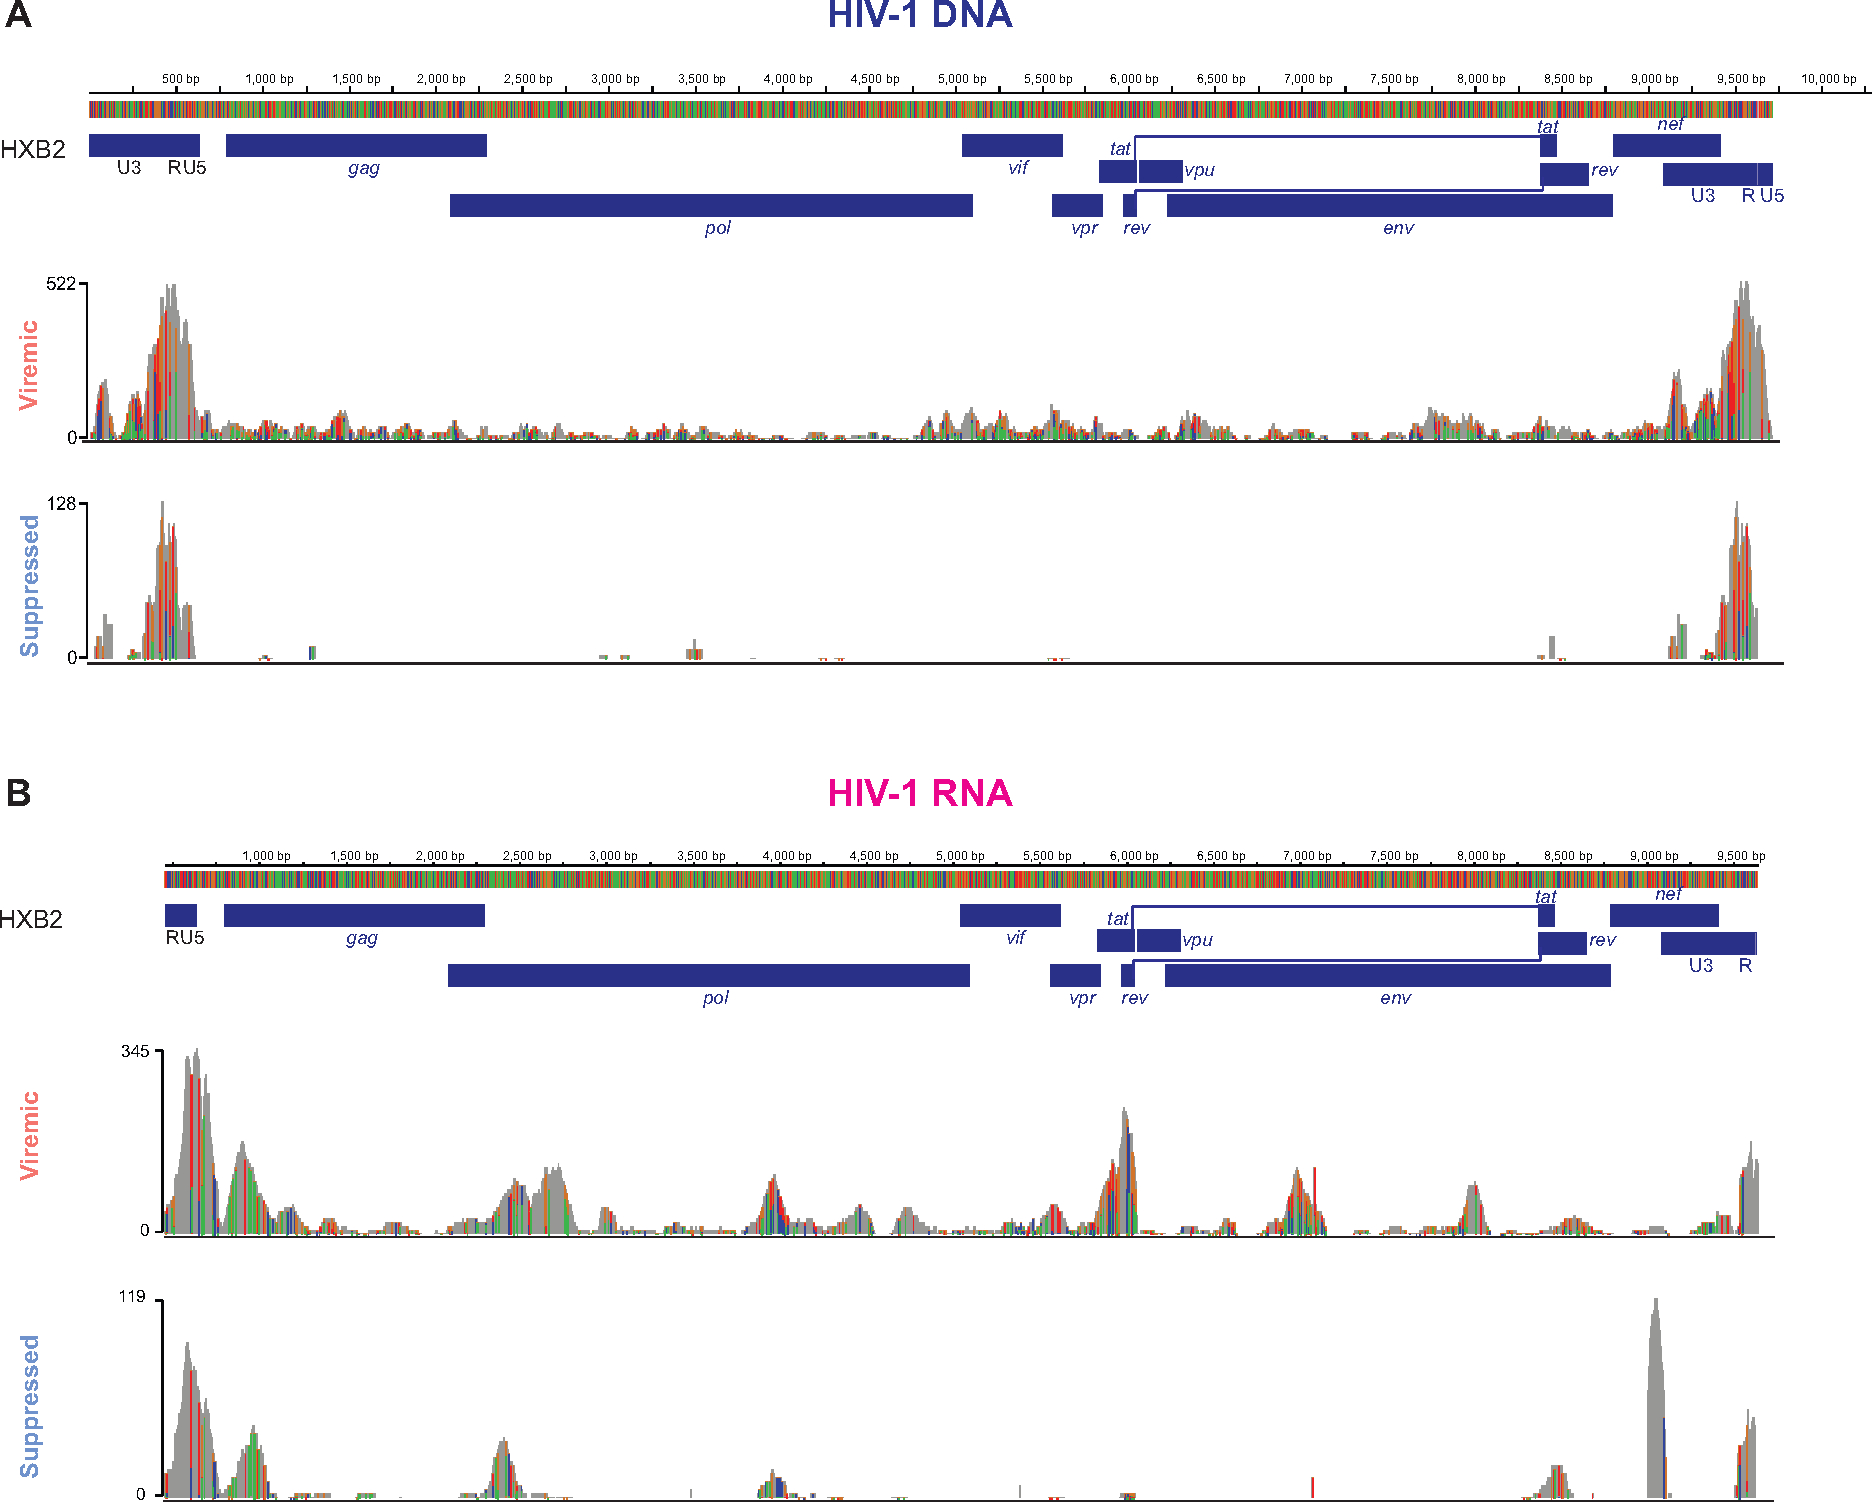
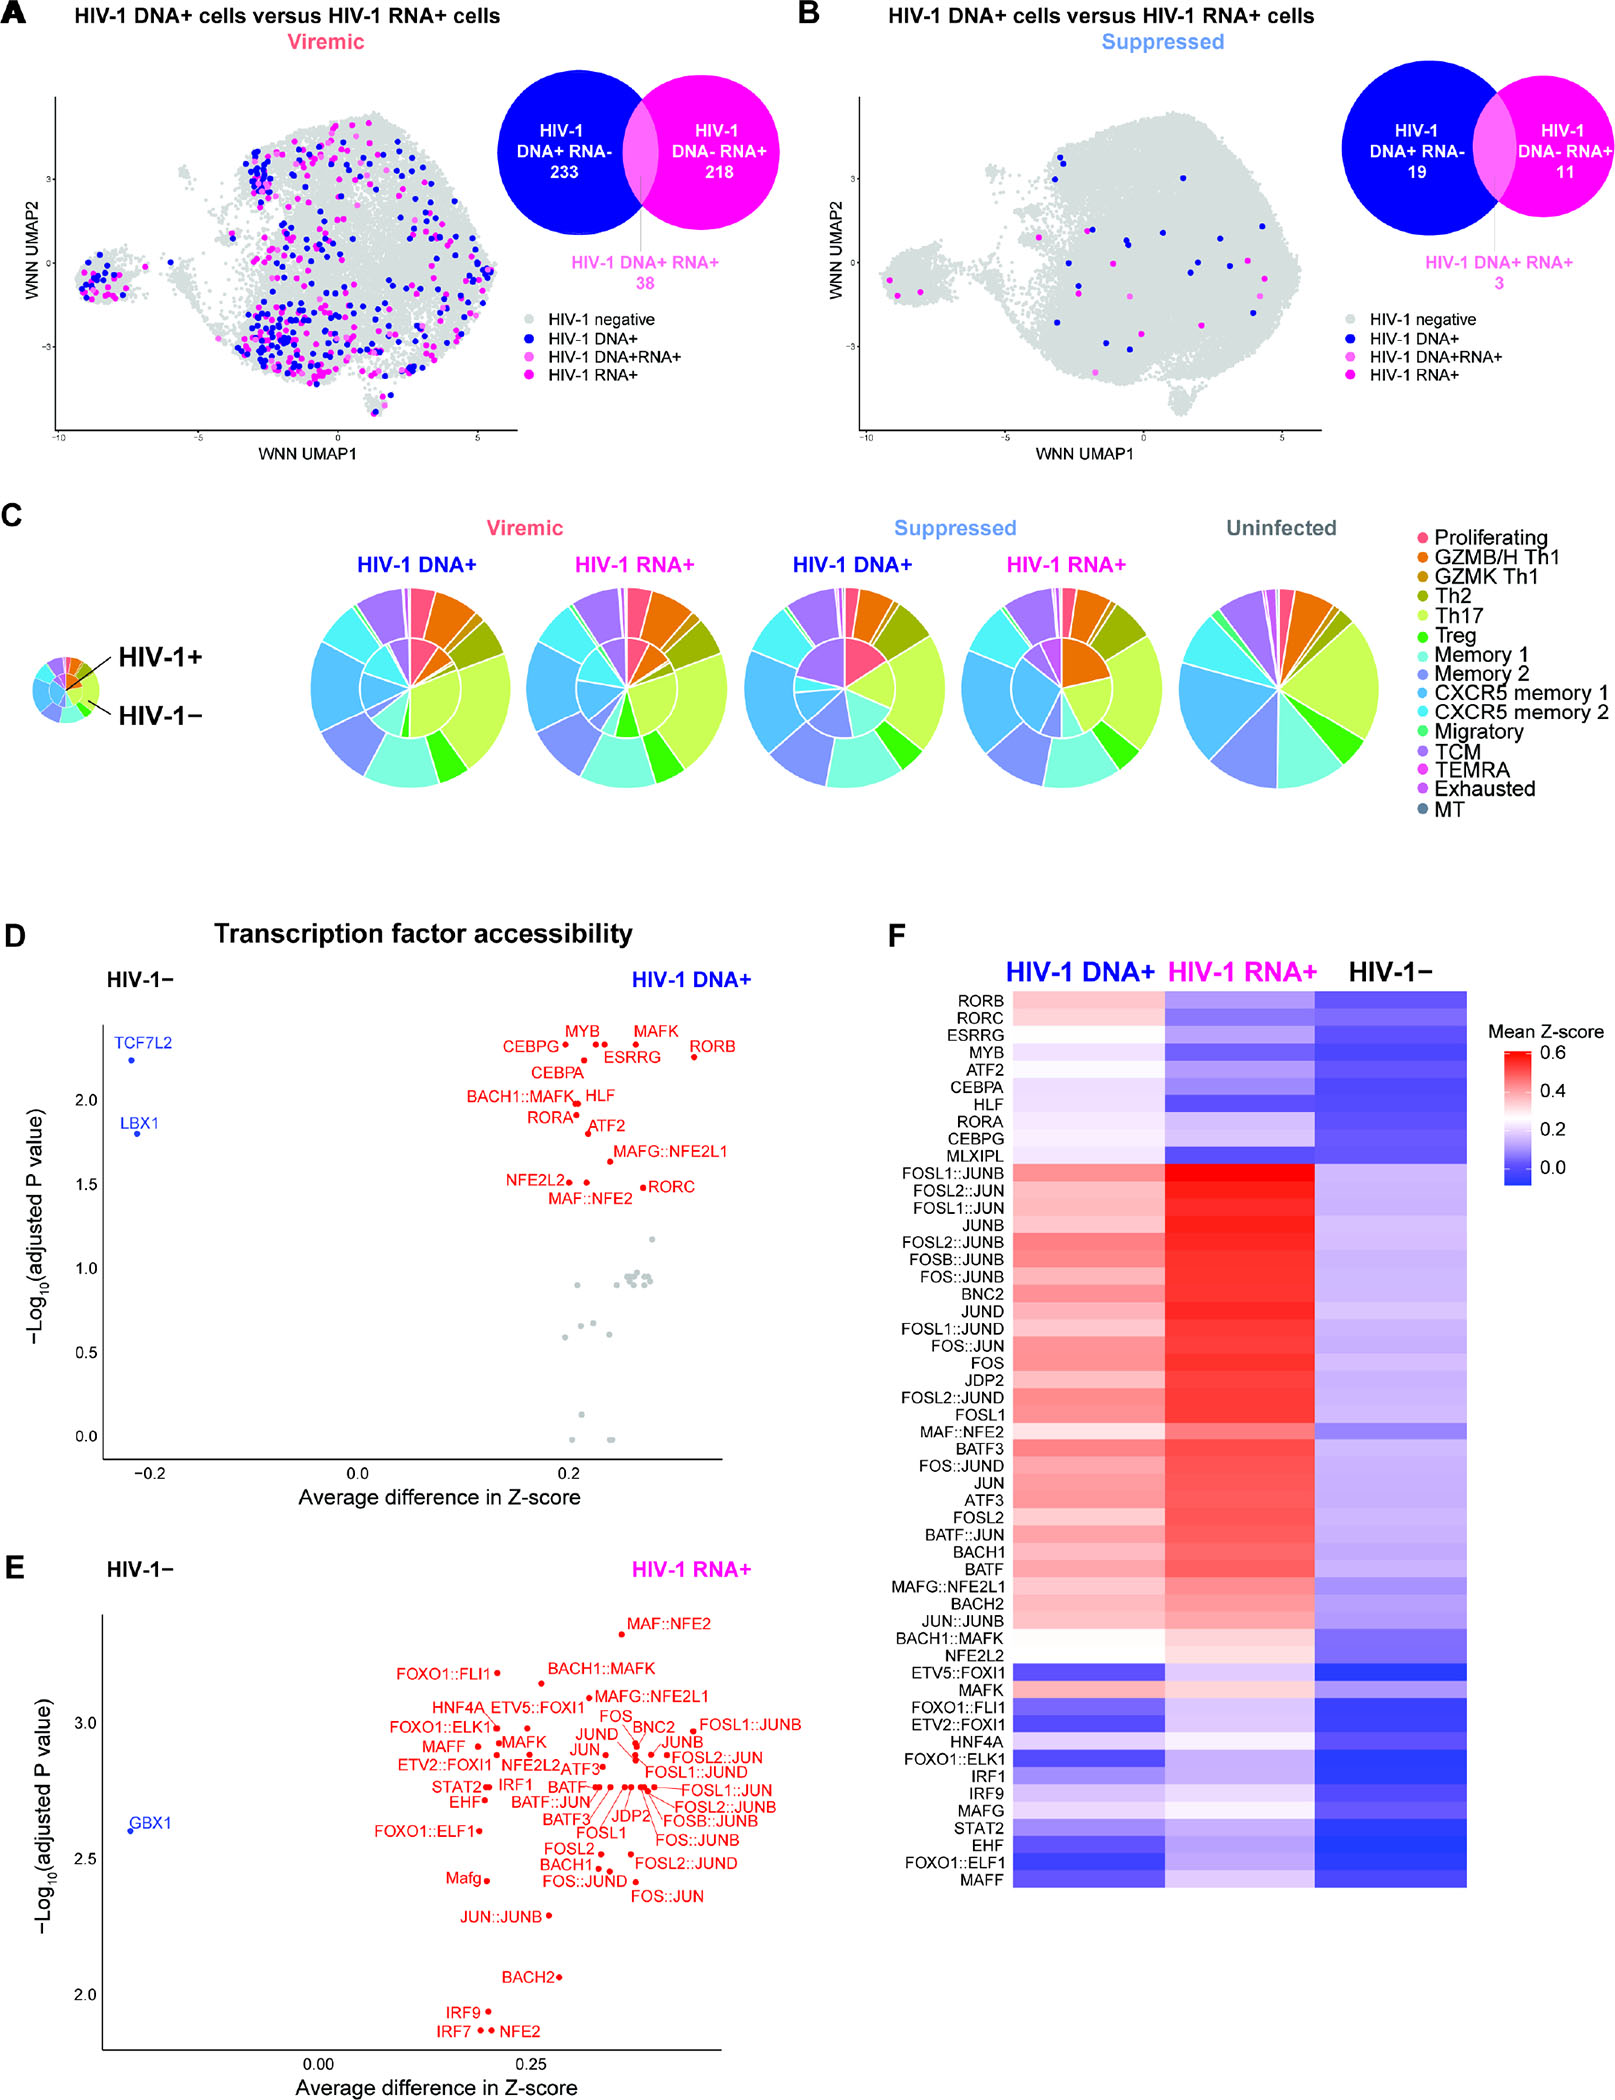
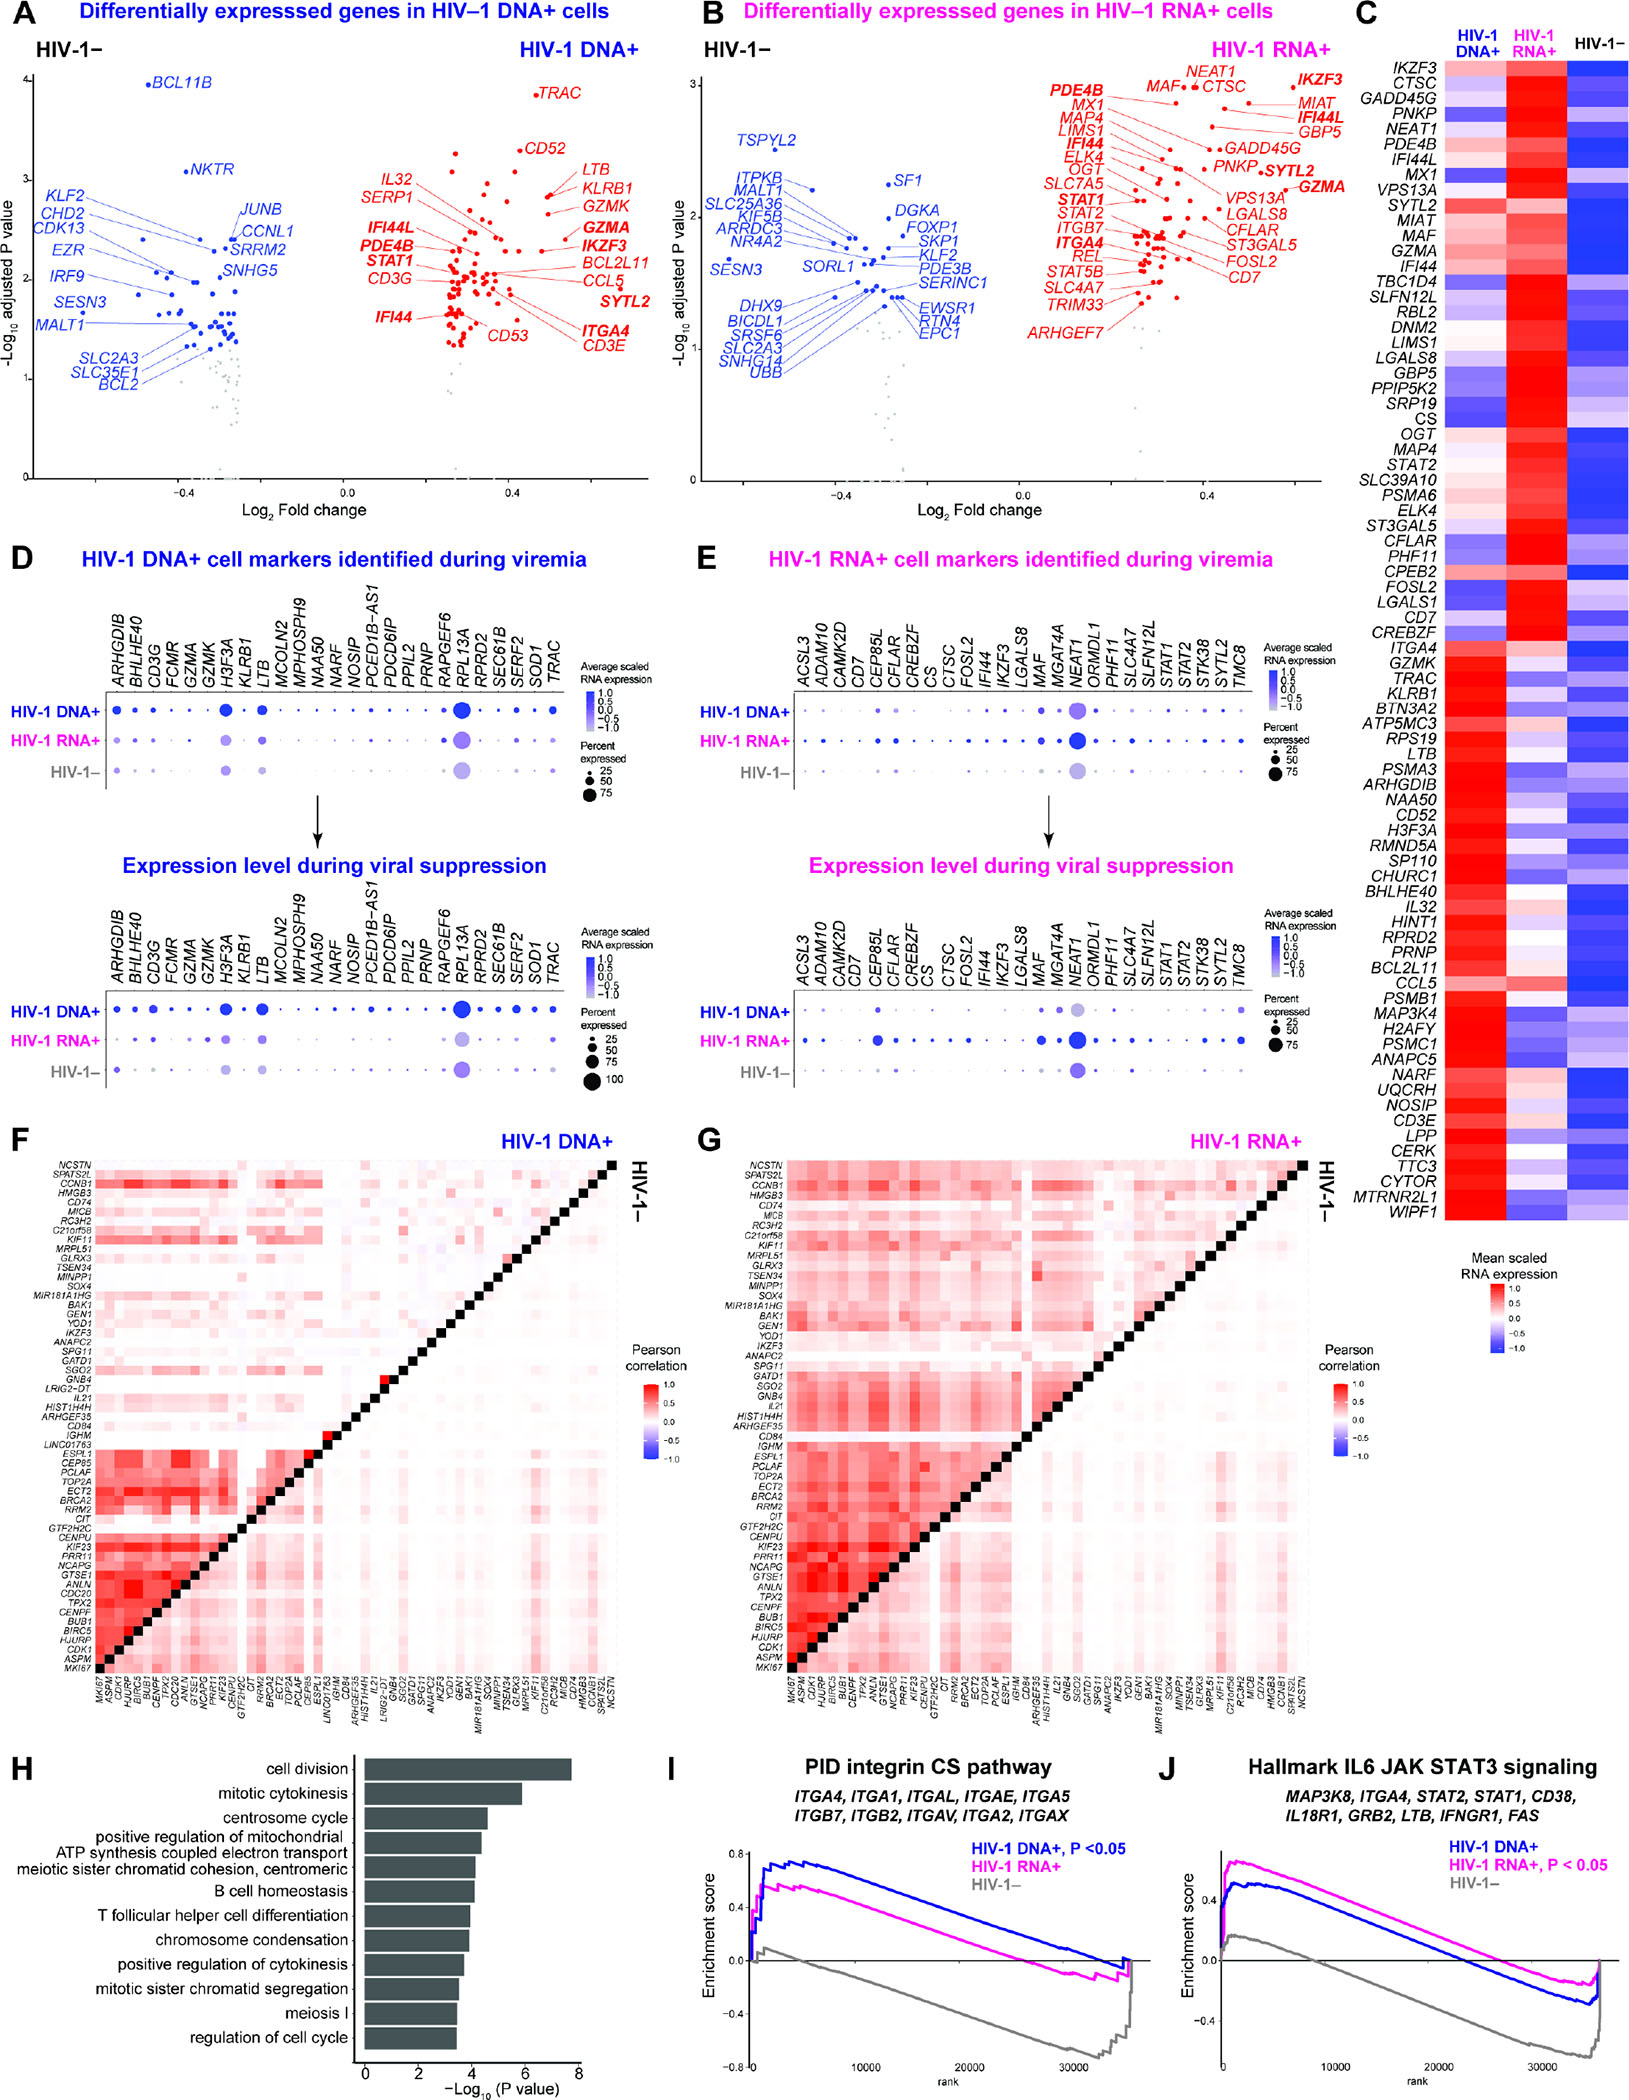
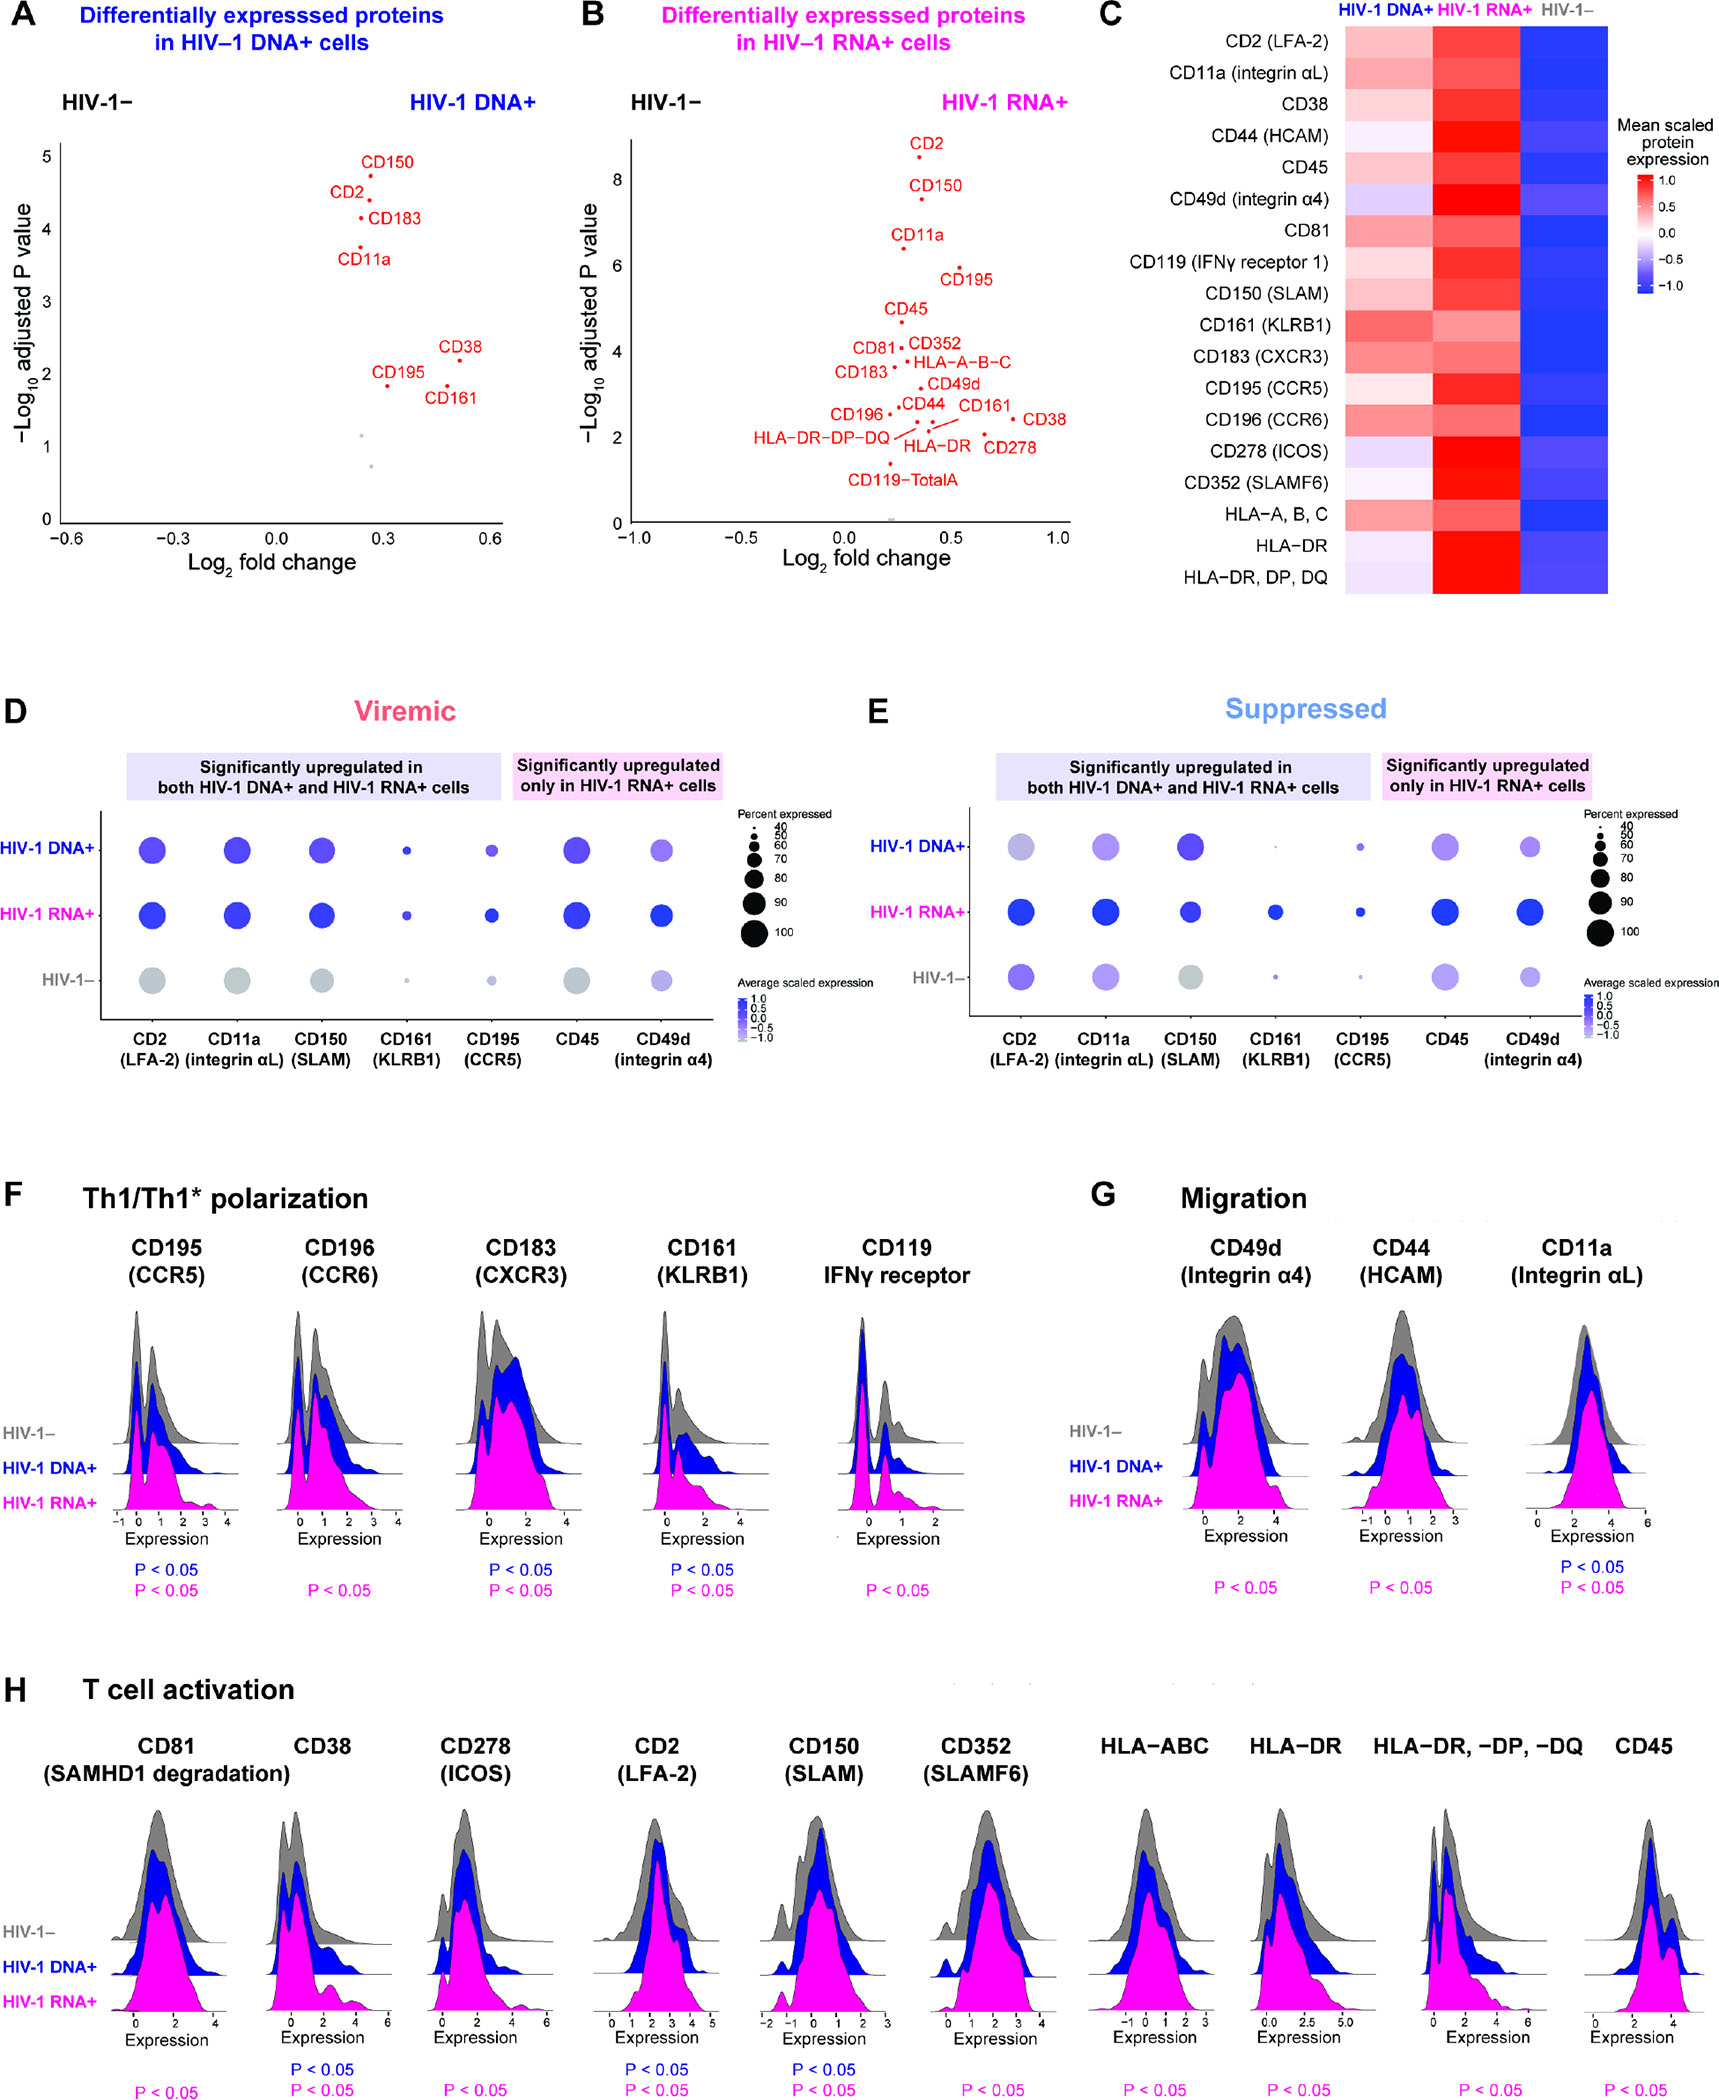
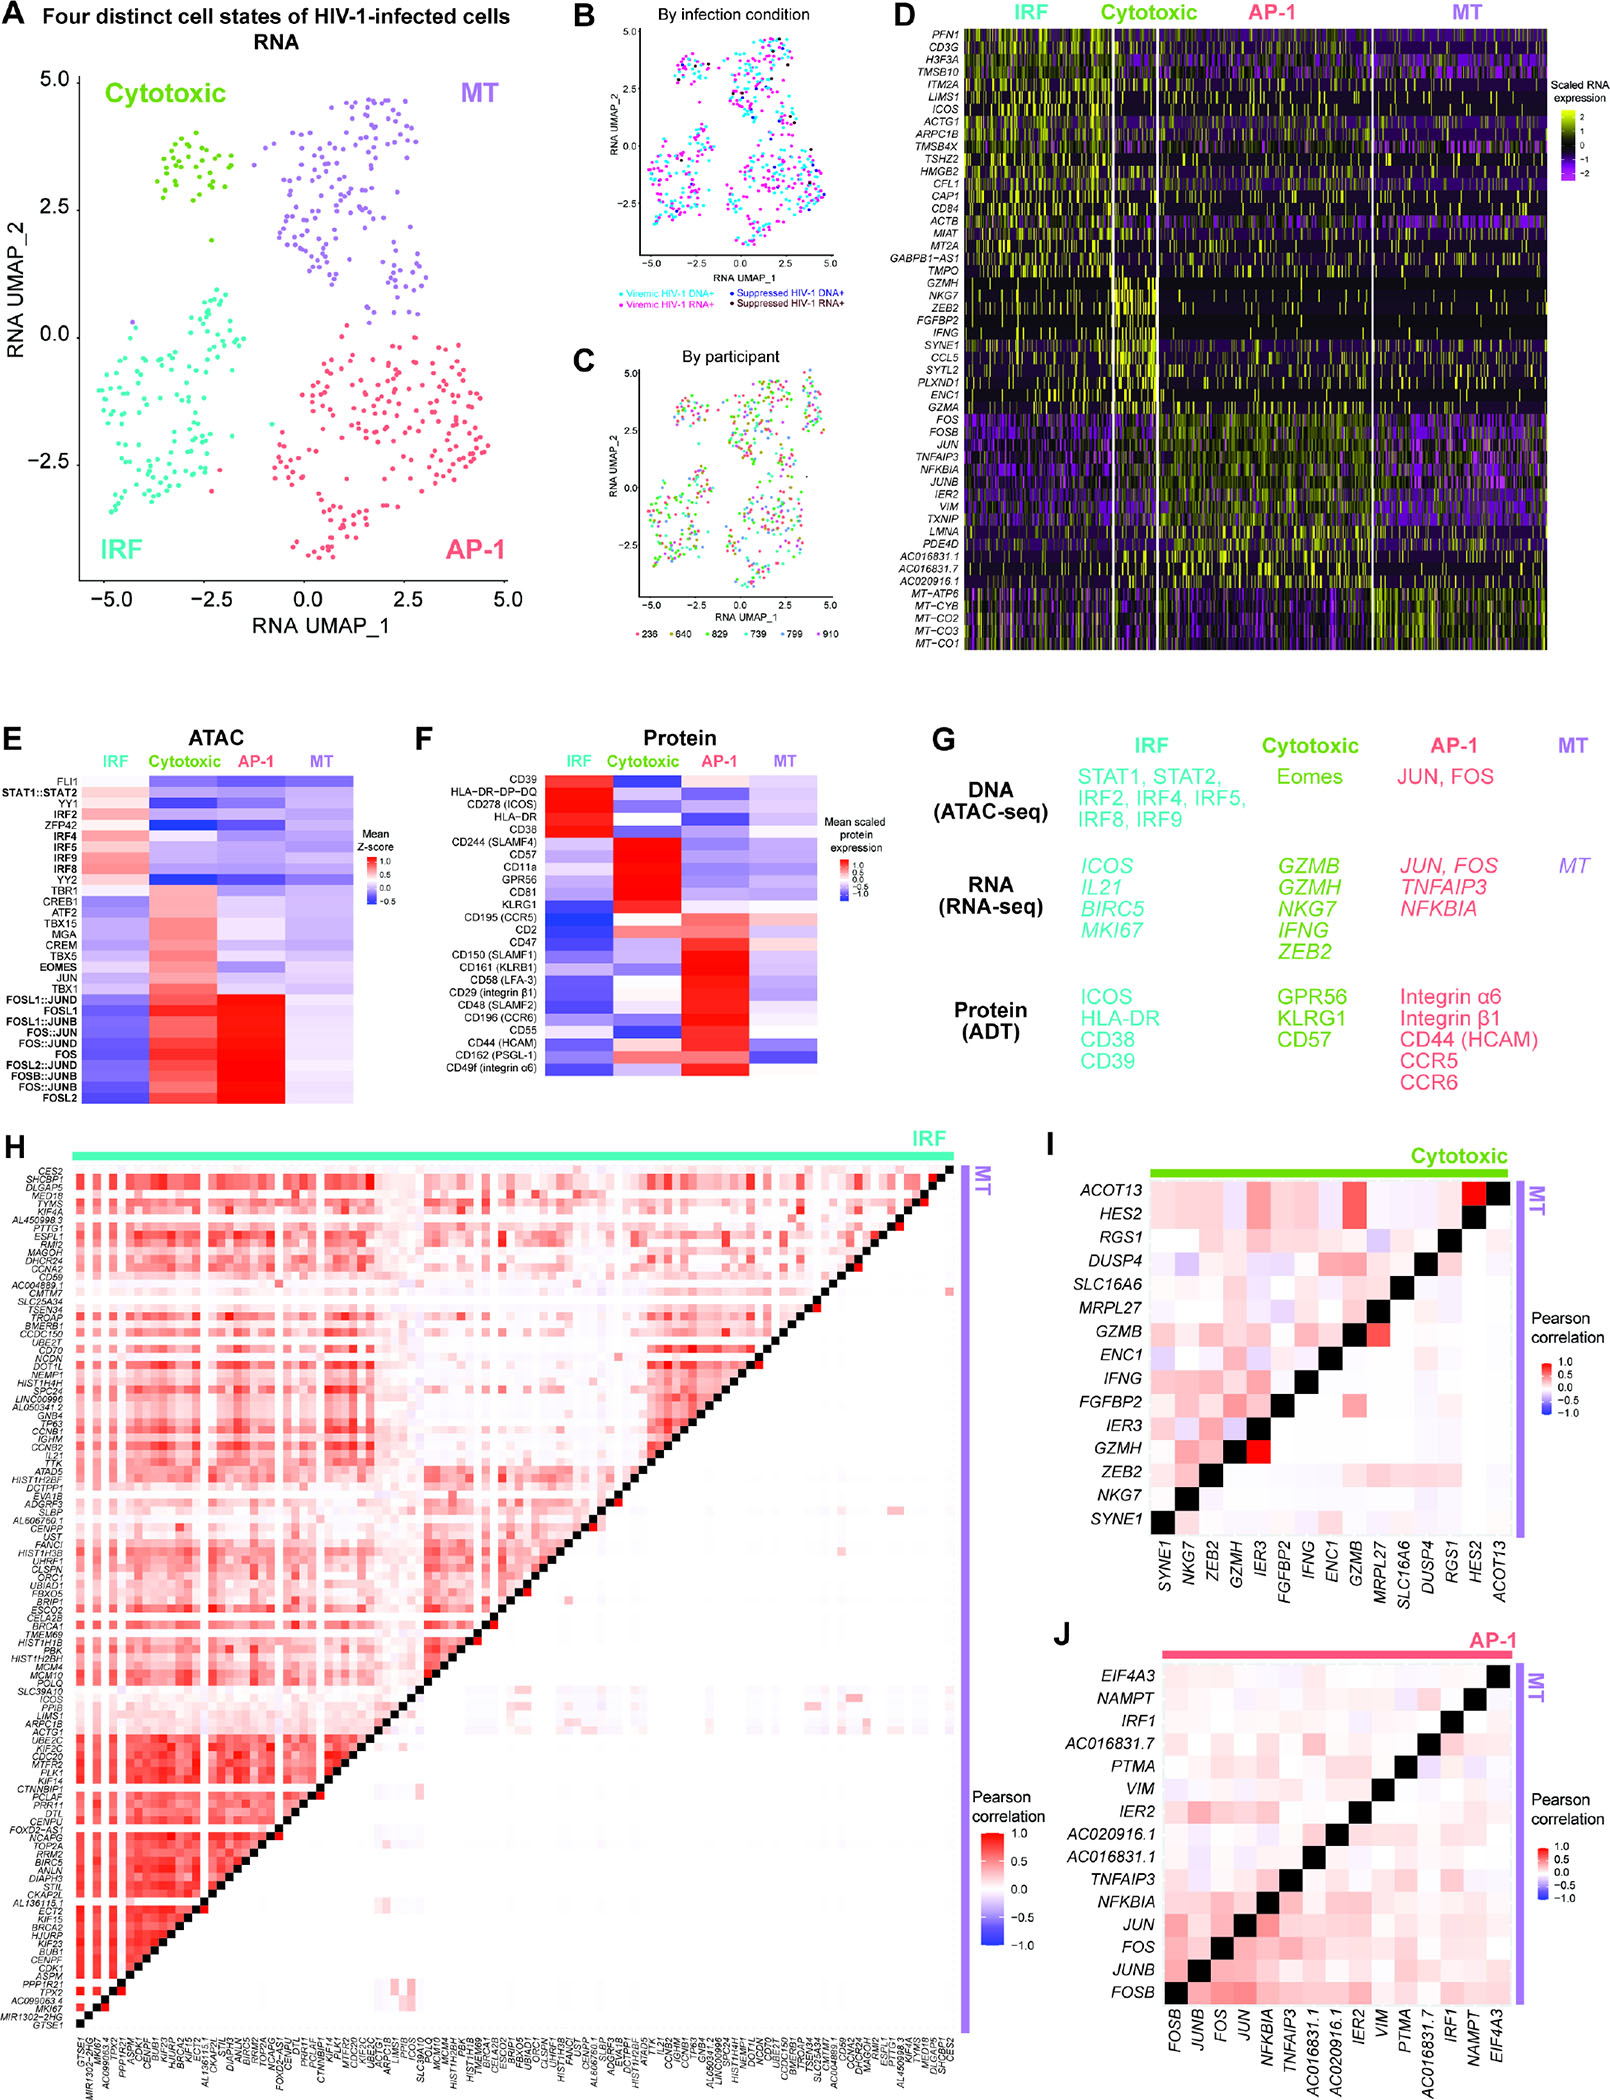
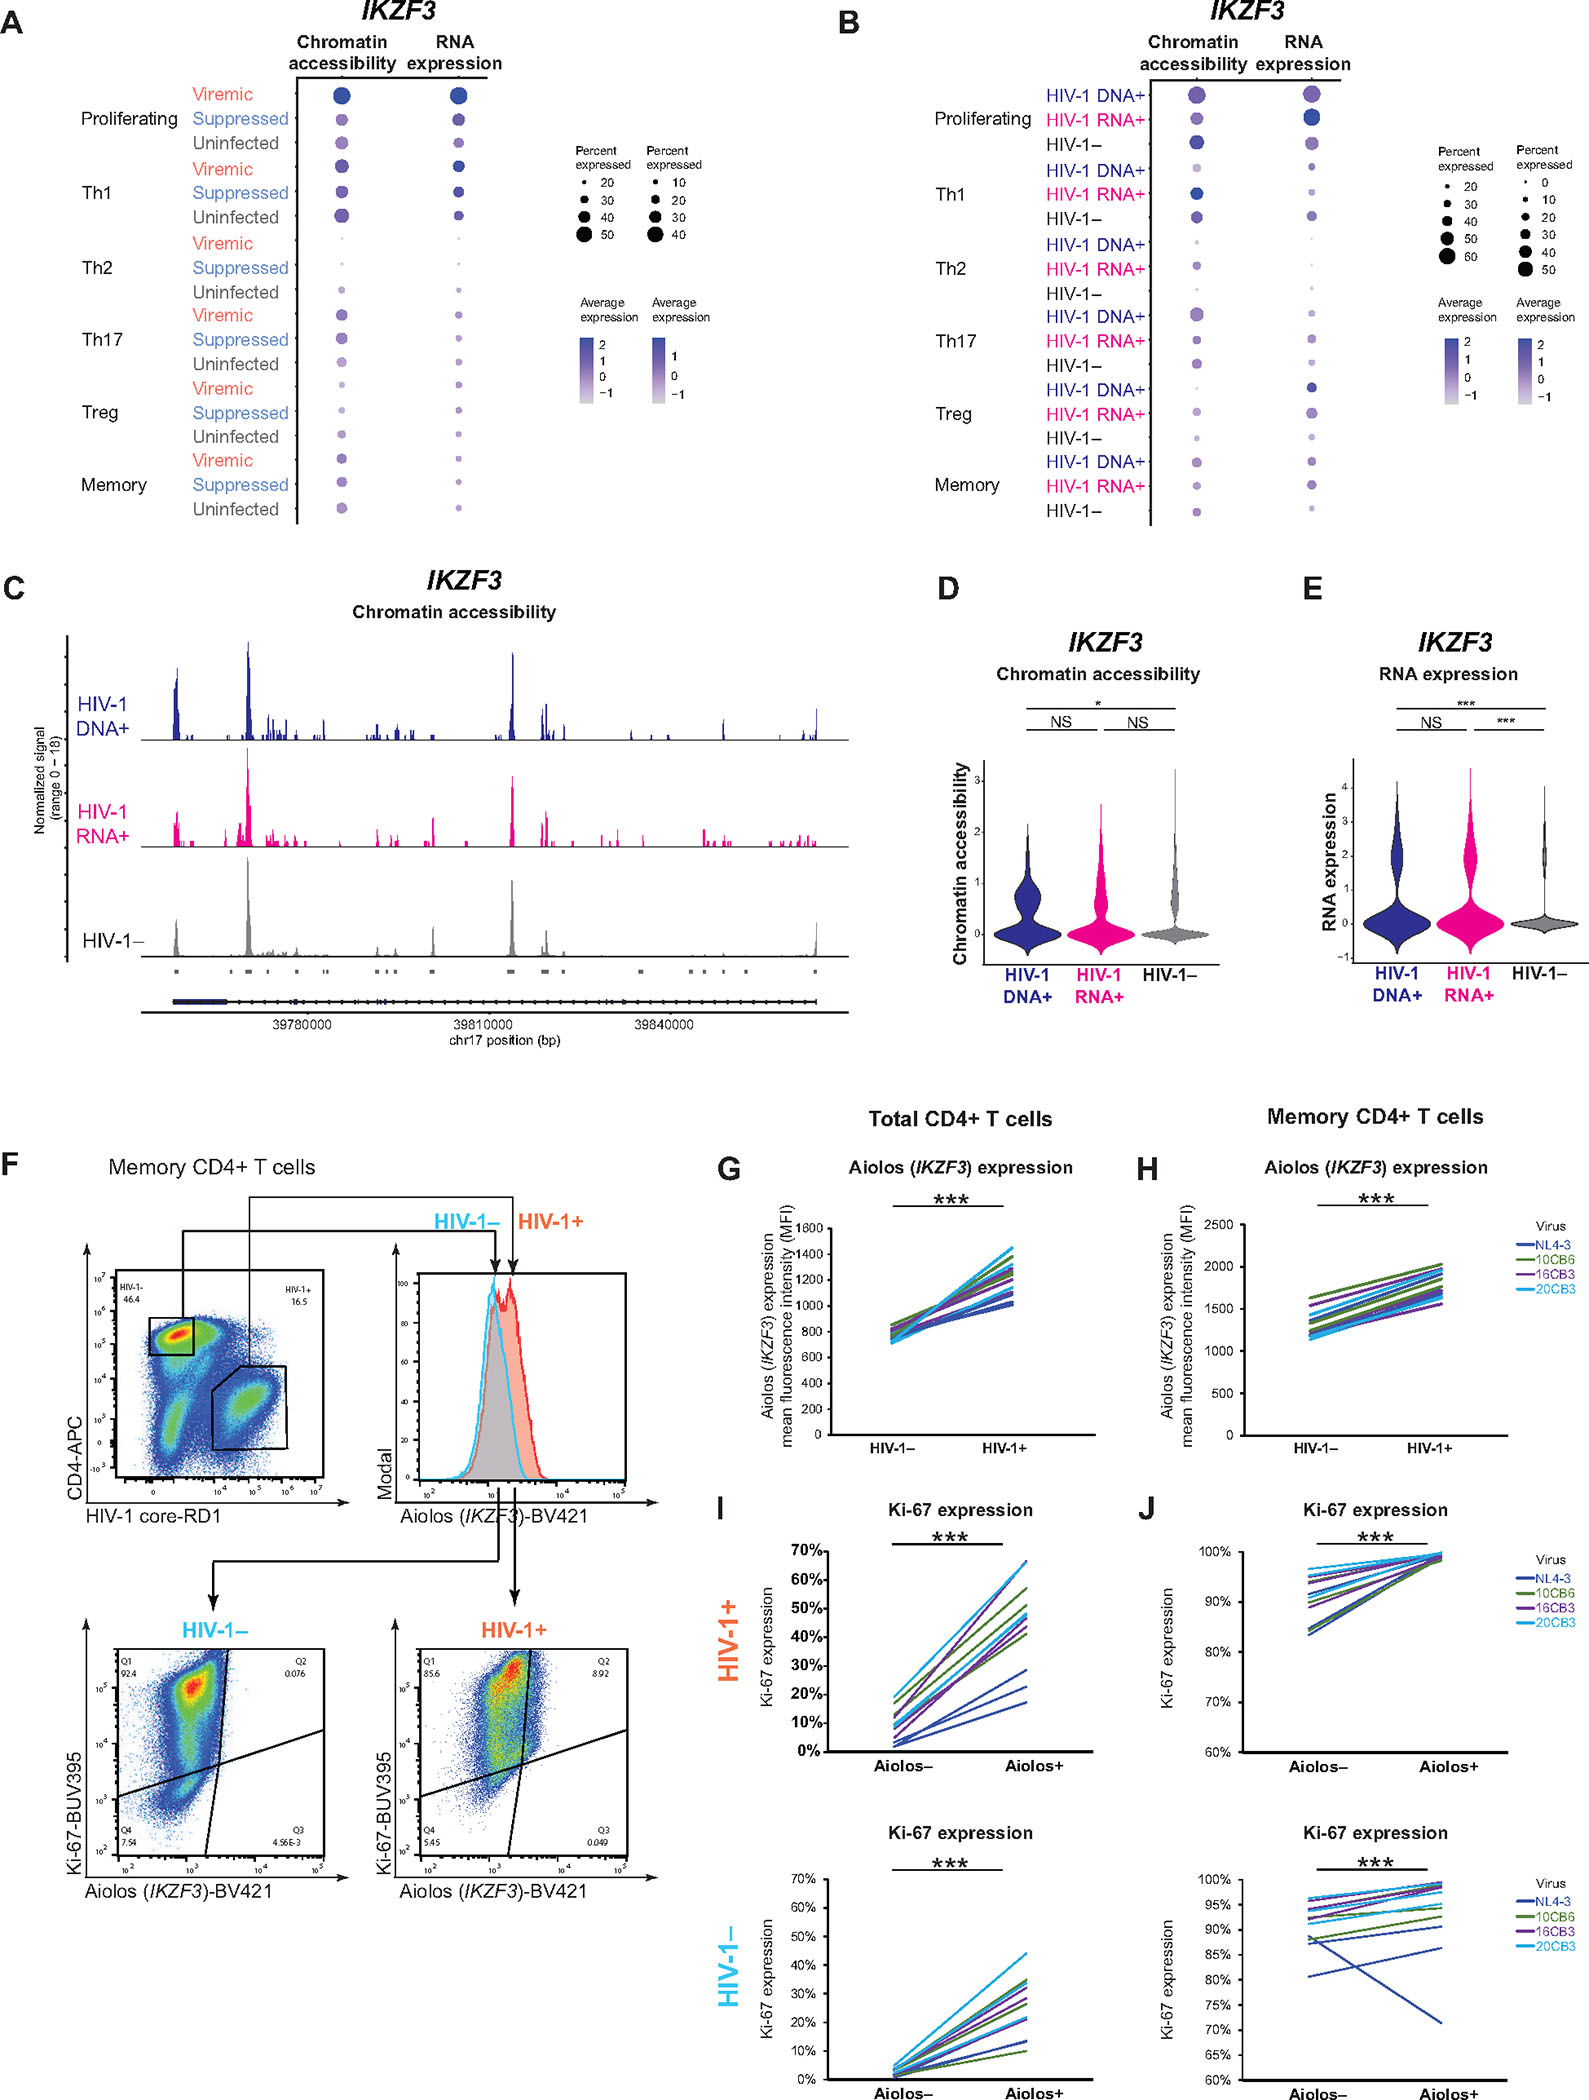
Understanding how HIV-1-infected cells proliferate and persist is key to HIV-1 eradication, but the heterogeneity and rarity of HIV-1-infected cells hamper mechanistic interrogations. Here, we used single-cell DOGMA-seq to simultaneously capture transcription factor accessibility, transcriptome, surface proteins, HIV-1 DNA, and HIV-1 RNA in memory CD4+ T cells from six people living with HIV-1 during viremia and after suppressive antiretroviral therapy. We identified increased transcription factor accessibility in latent HIV-1-infected cells (RORC) and transcriptionally active HIV-1-infected cells (interferon regulatory transcription factor [IRF] and activator protein 1 [AP-1]). A proliferation program (IKZF3, IL21, BIRC5, and MKI67 co-expression) promoted the survival of transcriptionally active HIV-1-infected cells. Both latent and transcriptionally active HIV-1-infected cells had increased IKZF3 (Aiolos) expression. Distinct epigenetic programs drove the heterogeneous cellular states of HIV-1-infected cells: IRF:activation, Eomes:cytotoxic effector differentiation, AP-1:migration, and cell death. Our study revealed the single-cell epigenetic, transcriptional, and protein states of latent and transcriptionally active HIV-1-infected cells and cellular programs promoting HIV-1 persistence.

Keywords: Aiolos; HIV cure; HIV latent reservoir; HIV persistence; IKZF3; T cell differentiation; acute viral infection; memory CD4(+) T cells; single-cell ATAC-seq; single-cell RNA-seq; transcription factor.


Conflict of interest statement

Declaration of interests The authors declare no competing interests.

Figures

Figure 1.
Figure 1.. Single-cell DOGMA-seq captures the heterogeneous epigenetic, transcriptional, and surface protein states of memory CD4+ T cells during HIV-1 infection.
(A) Harmonized WNN UMAP projection of memory CD4+ T cells identified by cell-to-cell multimodal neighbors (weighted combination of ATAC, RNA, and protein similarities) (n = 93,209 cells, including 25,778, 56,771, 10,660 cells in the viremic, viral suppression, and uninfected conditions, respectively). (B) Pie charts indicating cell subset distributions in viremia, viral suppression, and uninfected conditions. (CD) Heatmap comparisons of pairwise gene expression Pearson’s correlation coefficient, for the proliferation gene program identified by WGCNA. The Proliferation gene program was identified by WGCNA using top 50 genes most positively and negatively associated with the first 7 principal components in the transcriptional profiles of 25,778 cells in viremia. P < 0.05 for at least 95% Wilcoxon rank-sum tests against 10,000 random module permutations. (E) Proliferation module score per cell subset and infection condition. (F) Chromatin accessibility of transcription factor binding motifs in proliferating cluster cells grouped by conditions, represented in heatmap as comparisons of group means in ATAC-seq chromVAR bias-corrected deviations (Z-score). All motifs shown had significantly increased accessibility (P < 0.05 and mean Z-score difference ≥ 0.3). (G) Genes differentially expressed in proliferating cluster cells, represented in heatmap as comparisons of group means in normalized and scaled RNA expression. All genes passed P < 0.05 in viremic, min.pct ≥ 0.1, log2 fold change (FC) ≥ 0.25). (H) Surface proteins differentially expressed in proliferating cluster cells, represented in heatmap as comparisons of group means in DSB-normalized and scaled protein expression. All features passed P < 0.05 and log2FC ≥ 0.25. The mean expression of all protein features shown were also tested to be greater than the mean expression of their specific isotype controls in cells from the proliferating cluster (Z > 2; two-sample Z-test). For all heatmaps, n = 1,073, 1,373, 281 proliferating cells in the viremic, viral suppression, and uninfected conditions, respectively. Statistical significance for heatmaps was determined by Wilcoxon rank-sum test for comparisons between each group and all cells in the other two groups. All P values were false discovery rate (FDR)-adjusted using the Benjamini-Hochberg procedure. (I and J) Matching increase in chromatin accessibility and scaled gene expression at IKZF3, CCL5, IFI16, IFNG, and IL2RB in proliferating cells in viremia. (I) Highlighted red on the genome track corresponds to significantly differentially accessible peaks called by MACS3 (FDR-adjusted P < 0.05, min.pct ≥ 0.05, log2FC ≥ 0.15) (see Figure S2) and overlap with candidate cis-regulatory elements as predicted by ENCODE Registry of Candidate Cis-Regulatory Elements (cCREs). All transcription factors were identified using the JASPAR2022 Core Vertebrates collection, with binding confidence of P > 0.05 by PWMscan. (I) The corresponding RNA expression of genes. * P < 0.05, ** P < 0.01, *** P < 0.001, Wilcoxon rank-sum test. See also Figures S1–S4.
Figure 2.
Figure 2.. HIV-1 proviral and viral genome landscape captured by DOGMA-seq.
Integrative genomics viewer (IGV) plots of HIV-1 DNA+ reads (A) and of HIV-1 RNA+ reads (B) mapped to HXB2 reference genome and autologous HIV-1 sequences. See also Figures S5.
Figure 3.
Figure 3.. Single-cell DOGMA-seq captures transcriptionally inactive HIV-1-infected cells (HIV-1 DNA+ HIV-1 RNA) and transcriptionally active HIV-1-infected cells (HIV-1 RNA+) and their respective epigenetic landscape.
(AB) HIV-1 DNA+ cells and HIV-1 RNA+ cells were identified by mapping ATAC-seq and RNA-seq reads, respectively, to autologous HIV-1 and HXB2 reference sequences. An HIV-1-infected cell was defined as having at least 2 HIV-1 reads per barcode to guard against index hopping and sequencing artifacts. The Venn diagrams were drawn to scale with intersection depicting the subset of HIV-1-infected cells that are HIV-1 DNA+ RNA+ (light pink). For all downstream figures, HIV-1+ DNA+ RNA cells were termed HIV-1 DNA+ cells (blue) while HIV-1 DNA RNA+ cells and HIV-1 DNA+ RNA+ cells were merged and termed HIV-1 RNA+ cells (pink). (C) Pie charts indicating cell subset distributions. (DE) Volcano plots indicating transcription factors binding motifs having increased global chromatin accessibility (measured by chromVAR bias-corrected deviations) between HIV-1 DNA+ cells (n = 233) and HIV-1 cells (n = 2,238) in viremia (D) and between HIV-1 RNA+ cells (n = 256) and HIV-1 cells (n = 2,238) in viremia (E). (F) Global chromatin accessibility of transcription factor binding motifs in HIV-1 DNA+ cells and in HIV-1 RNA+ cells, with respect to each other and to HIV-1 cells, in viremia, represented in heatmap as comparisons of group means in chromVAR bias-corrected deviations (Z-score). All motifs shown had significantly increased accessibility (P <0.05 and mean Z-score difference ≥ 0.2). All volcano plots and heatmap showed comparisons for viremia (n = 233, 256, 2,238 cells in HIV-1 DNA+, HIV-1 RNA+, and HIV-1). Statistical significance for heatmaps was determined by Wilcoxon rank-sum test for comparisons between each group and all cells in the other two groups. For fair comparisons between groups in volcano plots and heatmap, HIV-1 cells were downsized to match the same number of cells in HIV-1+ groups with 1,000 bootstrap replicates. The 1,000 P values were transformed to follow a standard Cauchy distribution and a combined P value was calculated as the weighted sum of Cauchy transformed P values, followed by correction for multiple comparisons using the Benjamini-Hochberg (FDR) procedure. See also Figure S7.
Figure 4.
Figure 4.. Transcriptionally inactive HIV-1-infected cells upregulate IKZF3, type I IFN, cytotoxic T cell response, and homing RNA expression..
(AB) Volcano plots indicating differentially expressed genes in viremia between HIV-1 DNA+ cells (n = 233) or HIV-1 RNA+ cells (n = 256) versus HIV-1 cells (n = 2,238). P < 0.05, min.pct ≥ 0.15, log2FC ≥ 0.25. (C) Genes highly expressed in viremia in HIV-1 RNA+ cells and in HIV-1 DNA+ cells, represented in heatmap as comparisons of group means in normalized and scaled RNA expression. All genes passed P < 0.05, min.pct ≥ 0.15, log2FC ≥ 0.25. Statistical significance for heatmaps was determined by Wilcoxon rank-sum test for comparisons between each group and all cells in the other two groups. For fair comparisons between groups in volcano plots and heatmap, HIV-1 cells were downsized to match the same number of cells in HIV-1+ groups with 1,000 bootstrap replicates. The 1,000 P values were transformed to follow a standard Cauchy distribution and a combined P value is calculated as the weighted sum of Cauchy transformed P values, followed by correction for multiple comparisons using the Benjamini-Hochberg (FDR) procedure. (DE) Dot plot of average normalized and scaled RNA expression for significantly upregulated genes identified in HIV-1 DNA+ cells in viremia as shown in (A) and in HIV-1 RNA+ cells in viremia as shown in (B) that were also upregulated in HIV-infected cells during viral suppression. Log2FC > 0 between HIV-1+ cells and HIV-1 cells in viral suppression. P values did not reach statistical significance in viral suppression because of the low number of HIV+ cells captured. n = 19, 14, 56,738 HIV-1 DNA+ cells, HIV-1 RNA+ cells, and uninfected cells in viral suppression, respectively. (FG) Heatmap comparisons of pairwise gene expression Pearson’s correlation coefficients, for the proliferation (MKI67)-driven gene program identified by WGCNA, between HIV-1 DNA-1+ cells versus HIV-1 cells in viremia (F) and between HIV-1 RNA-1+ cells versus HIV-1 cells in viremia (G). This module was identified in HIV-1 RNA+ cells in viremia by considering top 50 genes most positively and negatively associated in the first 8 principal components. Module met significance with P <0.05 for at least 95% Wilcoxon rank-sum tests against 10,000 random module permutations. (H) Enriched Gene Ontology biological processes determined using genes in WGCNA-identified proliferation gene program as query. (IJ) To identify immune pathways, all 36,601 genes are ranked by log2 fold change in normalized gene expression between HIV-1+ and HIV-1 cell groups in viremia. Significantly enriched pathways were identified using GSEA. Top 10 representative leading-edge genes were shown. See also Figures S6–S7.
Figure 5.
Figure 5.. Transcriptionally inactive HIV-1-infected cells upregulate Th1/Th17, T cell activation, and homing protein expression. .
(AB) Volcano plots indicating differentially expressed surface proteins in viremia between HIV-1 DNA+ cells (n = 233) or HIV-1 RNA+ cells (n = 256) versus HIV-1 cells (n = 2,238). P < 0.05 and log2FC ≥ 0.25. (C) Surface proteins highly expressed in viremia in HIV-1 DNA+ cells versus HIV-1 RNA+ cells versus HIV-1 cells, represented in heatmap as comparisons of group means in DSB-normalized and scaled protein expression. All proteins passed P < 0.05 and log2FC ≥ 0.3. The mean expression of all protein features shown were also tested to be greater than the mean expression of their specific isotype controls (Z > 2; two-sample Z-test) in HIV-1+ cells. Statistical significance for heatmaps was determined by Wilcoxon rank-sum test for comparisons between each group and all cells in the other two groups. For fair comparisons between groups, HIV-1 cells were downsized to match the same number of cells in HIV-1+ groups with 1,000 bootstrap replicates. The 1,000 P values were transformed to follow a standard Cauchy distribution and a combined P value is calculated as the weighted sum of transformed P values, followed by correction for multiple comparisons using the Benjamini-Hochberg (FDR) procedure. (DE) Significantly upregulated proteins identified in HIV-1 DNA+ cells and in HIV-1 RNA+ cells (A–B) in viremia (D) that were also upregulated in HIV-1-infected cells in viral suppression (log2FC > 0 between HIV-1+ cells and HIV-1 cells in viral suppression) (E). Protein expression is visualized in dots plot of average CLR-normalized and scaled expression. P values did not reach statistical significance in viral suppression because of the low number of HIV-1+ cells captured. n = 19, 14, 56,738 HIV-1 DNA+ cells, HIV-1 RNA+ cells, and uninfected cells in viral suppression, respectively. (FH) Ridge plot of DSB-normalized and scaled protein expression distributions for significantly highly expressed surface proteins identified in (A–B). See also Figures S6–S7.
Figure 6.
Figure 6.. The heterogeneous HIV-1-infected T cell reservoir comprised four distinct cell states: IRF, cytotoxic, AP-1, and cell death.
(AC) RNA UMAP projection of all HIV-1+ cells (n = 233, 256, 19, 14 for viremic HIV-1 DNA+, viremic HIV-1 RNA+, suppressed HIV-1 DNA+, and suppressed HIV-1 RNA+, respectively) defined by transcriptional profile. Four phenotypically distinct clusters–IRF, Cytotoxic, AP-1, and MT clusters–were annotated (A). No apparent batch effects were observed by infection conditions or by HIV-1 RNA expression (B) or by study participants (C). Batch effects between participants were corrected by Harmony. (D) Heatmap of normalized and scaled RNA expression for most highly differentially expressed genes (by log2FC) in each cluster of cells. P < 0.05, min.pct ≥ 0.25, log2FC ≥ 0.25. (E) Differential accessibility for transcription factor binding motifs, represented in heatmap as comparisons of means of ATAC-seq chromVAR bias-corrected deviations (Z-score) between group. All motifs shown had significantly increased accessibility, by P < 0.05 and mean difference ≥ 0.3. (F) Proteins highly expressed per cell group, represented in heatmap as comparisons of group means in DSB-normalized and scaled protein expression. All features passed P < 0.05, and log2FC ≥ 0.25. The mean expression of all protein features shown were also tested to be greater than the mean expression of their specific isotype controls in HIV-1-infected cells (Z > 2; two-sample Z-test). Statistical significance for all heatmaps was determined by Wilcoxon rank-sum test for comparisons between each group and all cells in the other three groups. (G) Transcription factors with enriched binding motif accessibility and upregulated genes and proteins in each of the four phenotypically distinct clusters of HIV-1+ cells. (HJ) Heatmap comparisons of pairwise gene expression Pearson’s correlation coefficients for modules identified by WGCNA (using with top 50 genes most positively and negatively associated with the first 8 principal components in the transcriptional profiles of all 522 HIV-1+ cells). See also Figures S6.
Figure 7.
Figure 7.. Both transcriptionally inactive and active HIV-1-infected cells upregulate IKZF3 expression.
(AB) Dot plots showing mean normalized and scaled chromatin accessibility (left) and RNA expression (right) of IKZF3 in six main cell subsets. (C) Chromatin accessibility at IKZF3. (DE) Violin plots showing differences in IKZF3 chromatin accessibility (D) and RNA expression (E). * P < 0.05, *** P <0.001, Wilcoxon rank-sum tests. (F) Representative flow cytometry plot showing Aiolos protein expression in HIV-1-infected versus uninfected cells. Activated primary CD4+ T cells were infected with the replication-competent NL4–3 reference strain and three R5-tropic clinical isolates 10CB6, 16CB3, and 20CB3. After lymphocyte gating, doublet discrimination, and gating for cell viability, HIV-1-infected cells were determined based on HIV-1 core-RD1 expression and CD4 downregulation. (G, H) Aiolos protein expression in HIV-1-infected and uninfected cells. Each line represents one biological replicate from one uninfected donor. Total CD4+ T cells (G) and memory CD4+ T cells (H) from 3 uninfected donors were tested for each virus. (I–J) Proportion of Ki-67 expression among Aiolos+ HIV-1+ cells versus Aiolos HIV-1+ cells in total CD4+ T cells (I) and memory CD4+ T cells (J). *** P < 0.001, paired two-tail Student’s t-test (G–J).

Similar articles

Cited by

References

    1. Chun TW, Stuyver L, Mizell SB, Ehler LA, Mican JA, Baseler M, Lloyd AL, Nowak MA, and Fauci AS (1997). Presence of an inducible HIV-1 latent reservoir during highly active antiretroviral therapy. Proc Natl Acad Sci U S A 94, 13193–13197. 10.1073/pnas.94.24.13193. - DOI - PMC - PubMed
    1. Finzi D, Hermankova M, Pierson T, Carruth LM, Buck C, Chaisson RE, Quinn TC, Chadwick K, Margolick J, Brookmeyer R, et al. (1997). Identification of a reservoir for HIV-1 in patients on highly active antiretroviral therapy. Science 278, 1295–1300. 10.1126/science.278.5341.1295. - DOI - PubMed
    1. Wong JK, Hezareh M, Gunthard HF, Havlir DV, Ignacio CC, Spina CA, and Richman DD (1997). Recovery of replication-competent HIV despite prolonged suppression of plasma viremia. Science 278, 1291–1295. 10.1126/science.278.5341.1291. - DOI - PubMed
    1. Einkauf KB, Osborn MR, Gao C, Sun W, Sun X, Lian X, Parsons EM, Gladkov GT, Seiger KW, Blackmer JE, et al. (2022). Parallel analysis of transcription, integration, and sequence of single HIV-1 proviruses. Cell. 10.1016/j.cell.2021.12.011. - DOI - PMC - PubMed
    1. Wu VH, Nordin JML, Nguyen S, Joy J, Mampe F, Del Rio Estrada PM, Torres-Ruiz F, González-Navarro M, Luna-Villalobos YA, Ávila-Ríos S, et al. (2023). Profound phenotypic and epigenetic heterogeneity of the HIV-1-infected CD4(+) T cell reservoir. Nat Immunol 24, 359–370. 10.1038/s41590-022-01371-3. - DOI - PMC - PubMed

Publication types

Substances