

Iron homeostasis proteins Grx4 and Fra2 control activity of the Schizosaccharomyces pombe iron repressor Fep1 by facilitating [2Fe-2S] cluster removal
- PMID: 37923140
- PMCID: PMC10704371
- DOI: 10.1016/j.jbc.2023.105419
Iron homeostasis proteins Grx4 and Fra2 control activity of the Schizosaccharomyces pombe iron repressor Fep1 by facilitating [2Fe-2S] cluster removal
Abstract
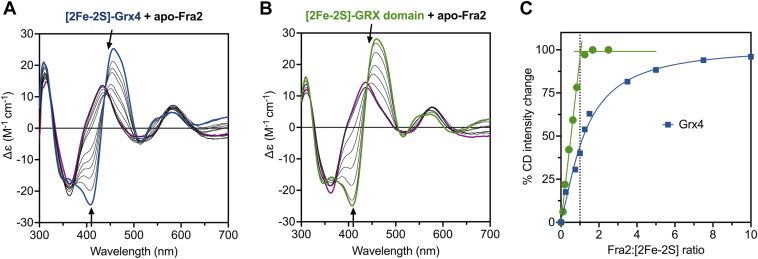
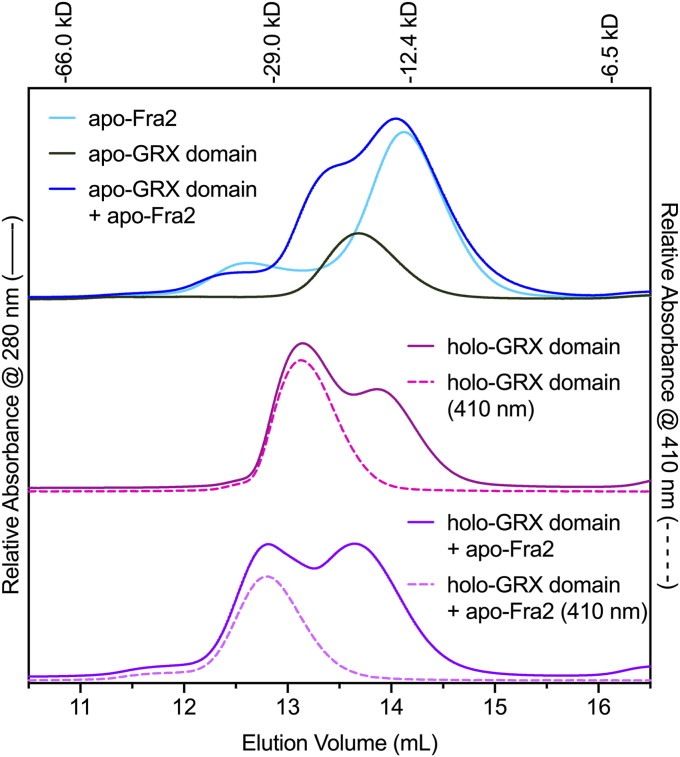
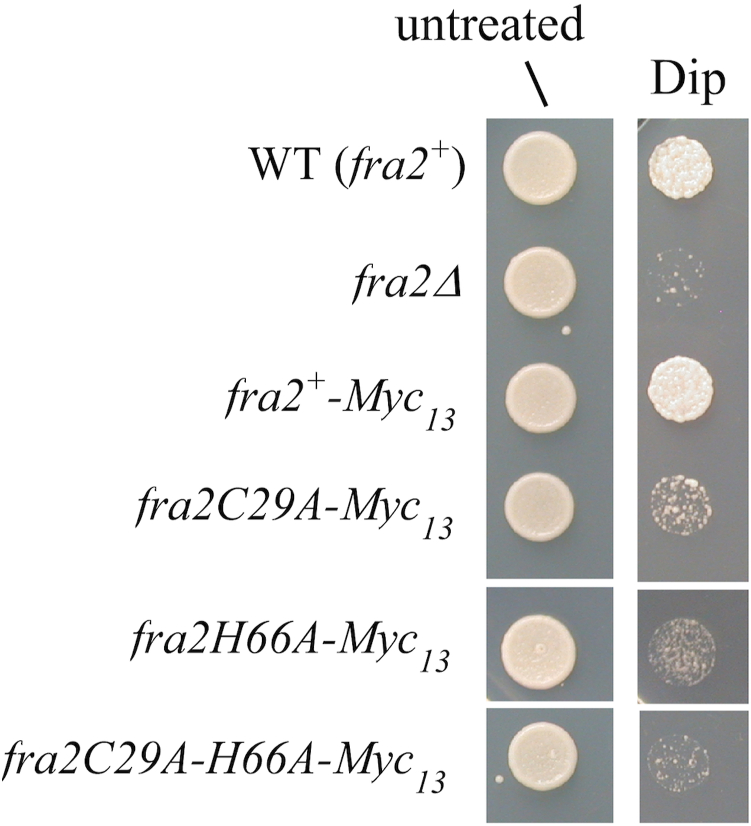
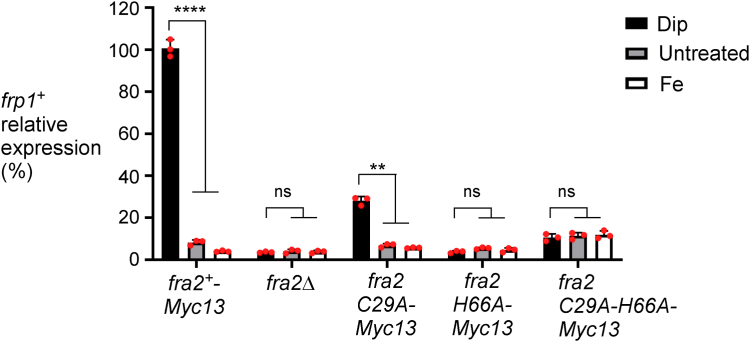
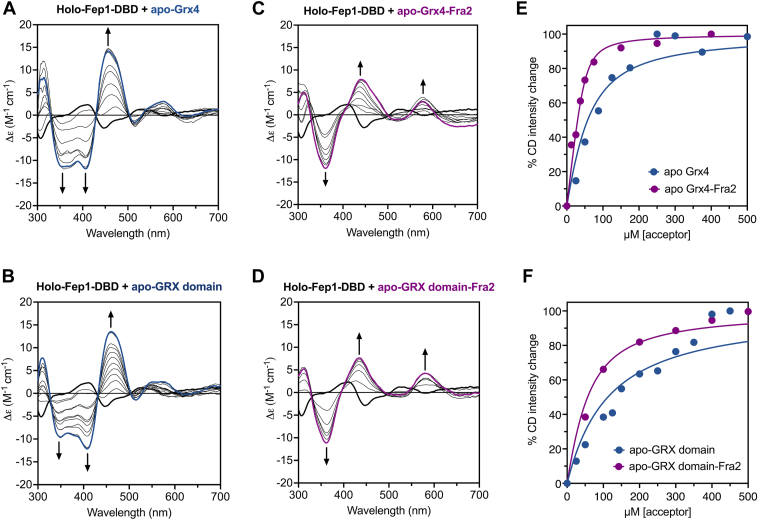
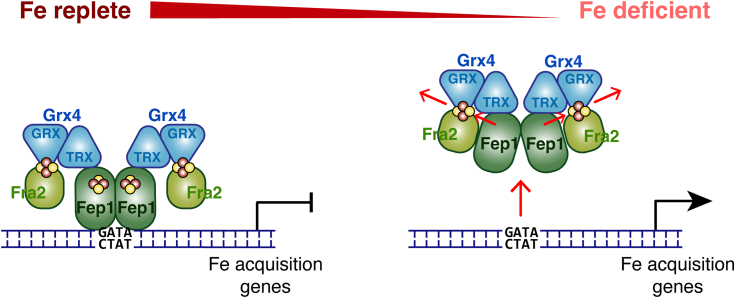
The Bol2 homolog Fra2 and monothiol glutaredoxin Grx4 together play essential roles in regulating iron homeostasis in Schizosaccharomyces pombe. In vivo studies indicate that Grx4 and Fra2 act as coinhibitory partners that inactivate the transcriptional repressor Fep1 in response to iron deficiency. In Saccharomyces cerevisiae, Bol2 is known to form a [2Fe-2S]-bridged heterodimer with the monothiol Grxs Grx3 and Grx4, with the cluster ligands provided by conserved residues in Grx3/4 and Bol2 as well as GSH. In this study, we characterized this analogous [2Fe-2S]-bridged Grx4-Fra2 complex in S. pombe by identifying the specific residues in Fra2 that act as ligands for the Fe-S cluster and are required to regulate Fep1 activity. We present spectroscopic and biochemical evidence confirming the formation of a [2Fe-2S]-bridged Grx4-Fra2 heterodimer with His66 and Cys29 from Fra2 serving as Fe-S cluster ligands in S. pombe. In vivo transcription and growth assays confirm that both His66 and Cys29 are required to fully mediate the response of Fep1 to low iron conditions. Furthermore, we analyzed the interaction between Fep1 and Grx4-Fra2 using CD spectroscopy to monitor changes in Fe-S cluster coordination chemistry. These experiments demonstrate unidirectional [2Fe-2S] cluster transfer from Fep1 to Grx4-Fra2 in the presence of GSH, revealing the Fe-S cluster dependent mechanism of Fep1 inactivation mediated by Grx4 and Fra2 in response to iron deficiency.
Keywords: BolA-like protein; GATA-type transcription factor; circular dichroism; fission yeast; iron metabolism; iron-sulfur protein; metal homeostasis; monothiol glutaredoxin; protein-protein interaction.
Copyright © 2023 The Authors. Published by Elsevier Inc. All rights reserved.
Conflict of interest statement
Conflict of interest The authors declare there are no conflicts of interest with the contents of this article.
Figures

Similar articles
-
A cascade of iron-containing proteins governs the genetic iron starvation response to promote iron uptake and inhibit iron storage in fission yeast.PLoS Genet. 2015 Mar 25;11(3):e1005106. doi: 10.1371/journal.pgen.1005106. eCollection 2015 Mar. PLoS Genet. 2015. PMID: 25806539 Free PMC article.
-
Histidine 103 in Fra2 is an iron-sulfur cluster ligand in the [2Fe-2S] Fra2-Grx3 complex and is required for in vivo iron signaling in yeast.J Biol Chem. 2011 Jan 7;286(1):867-76. doi: 10.1074/jbc.M110.184176. Epub 2010 Oct 26. J Biol Chem. 2011. PMID: 20978135 Free PMC article.
-
The yeast iron regulatory proteins Grx3/4 and Fra2 form heterodimeric complexes containing a [2Fe-2S] cluster with cysteinyl and histidyl ligation.Biochemistry. 2009 Oct 13;48(40):9569-81. doi: 10.1021/bi901182w. Biochemistry. 2009. PMID: 19715344 Free PMC article.
-
Monothiol CGFS glutaredoxins and BolA-like proteins: [2Fe-2S] binding partners in iron homeostasis.Biochemistry. 2012 Jun 5;51(22):4377-89. doi: 10.1021/bi300393z. Epub 2012 May 23. Biochemistry. 2012. PMID: 22583368 Free PMC article. Review.
-
Iron uptake and regulation in Schizosaccharomyces pombe.Curr Opin Microbiol. 2013 Dec;16(6):669-76. doi: 10.1016/j.mib.2013.07.007. Epub 2013 Aug 3. Curr Opin Microbiol. 2013. PMID: 23916750 Review.
Cited by
-
The putative polyamine transporter Shp2 facilitates phosphate export in an Xpr1-independent manner and contributes to high phosphate tolerance.J Biol Chem. 2025 Jan;301(1):108056. doi: 10.1016/j.jbc.2024.108056. Epub 2024 Dec 9. J Biol Chem. 2025. PMID: 39662831 Free PMC article.
-
Requirements for the biogenesis of [2Fe-2S] proteins in the human and yeast cytosol.Proc Natl Acad Sci U S A. 2024 May 21;121(21):e2400740121. doi: 10.1073/pnas.2400740121. Epub 2024 May 14. Proc Natl Acad Sci U S A. 2024. PMID: 38743629 Free PMC article.
-
The cytosolic form of dual localized BolA family protein Bol3 is important for adaptation to iron starvation in Aspergillus fumigatus.Open Biol. 2024 Jun;14(6):240033. doi: 10.1098/rsob.240033. Epub 2024 Jun 26. Open Biol. 2024. PMID: 38919062 Free PMC article.
References
-
- Brault A., Mourer T., Labbé S. Molecular basis of the regulation of iron homeostasis in fission and filamentous yeasts. IUBMB Life. 2015;67:801–815. - PubMed
-
- Martínez-Pastor M.T., Perea-Garcia A., Puig S. Mechanisms of iron sensing and regulation in the yeast Saccharomyces cerevisiae. World J. Microbiol. Biotechnol. 2017;33:75. - PubMed
Publication types
MeSH terms
Substances
Grants and funding
LinkOut - more resources
Full Text Sources
Molecular Biology Databases
Miscellaneous
