. 2023 Nov 28;19(22):8401-8413.
doi: 10.1021/acs.jctc.3c00864. Epub 2023 Nov 3.

Accurate and Efficient SAXS/SANS Implementation Including Solvation Layer Effects Suitable for Molecular Simulations

Affiliations

Accurate and Efficient SAXS/SANS Implementation Including Solvation Layer Effects Suitable for Molecular Simulations

Federico Ballabio et al. J Chem Theory Comput. .

Abstract

Small-angle X-ray and neutron scattering (SAXS/SANS) provide valuable insights into the structure and dynamics of biomolecules in solution, complementing a wide range of structural techniques, including molecular dynamics simulations. As contrast-based methods, they are sensitive not only to structural properties but also to solvent-solute interactions. Their use in molecular dynamics simulations requires a forward model that should be as fast and accurate as possible. In this work, we demonstrate the feasibility of calculating SAXS and SANS intensities using a coarse-grained representation consisting of one bead per amino acid and three beads per nucleic acid, with form factors that can be corrected on the fly to account for solvation effects at no additional computational cost. By coupling this forward model with molecular dynamics simulations restrained with SAS data, it is possible to determine conformational ensembles or refine the structure and dynamics of proteins and nucleic acids in agreement with the experimental results. To assess the robustness of this approach, we applied it to gelsolin, for which we acquired SAXS data on its closed state, and to a UP1-microRNA complex, for which we used previously collected measurements. Our hybrid-resolution small-angle scattering (hySAS) implementation, being distributed in PLUMED, can be used with atomistic and coarse-grained simulations using diverse restraining strategies.


Conflict of interest statement

The authors declare no competing financial interest.

Figures

Figure 1
Figure 1
SAS intensity calculation timings. (A) The 6442 frame MD trajectory of 755 residues GSN was used as input for PLUMED-ISDB plugin to calculate the corresponding SAS intensities for 31 q values, using different mapping resolutions. The time required for completion at AA details (11,558 atoms) is 416,594 s and with MT mapping (1627 beads) is 8,615 s, while for 1B (755 beads) is 1925 s. 1B and MT are 216 times and 48 times faster than AA, respectively. As an example, five residues are shown at atomistic (ball and sticks visualization) and 1B resolution (light blue beads). (B) The 500 frames MD trajectory of 1187 nucleotide RNA strand was used to calculate the corresponding SAS intensities for 31 q values. The time required for completion at AA resolution (38,287 atoms) is 432,022 s and for MT mapping (7796 beads) is 15,912 s, while for 3B (3,560 beads) is 3263 s. 3B and MT are 132 times and 27 times faster than AA, respectively. As an example, four nucleotides are shown at atomistic (ball and sticks visualization) and 3B resolution (nucleobase in blue, pentose sugar in violet, phosphate group in orange). The timings were evaluated under the same conditions on a single core of a workstation equipped with an Intel Xeon E5-2660v3 CPU.
Figure 2
Figure 2
Validation of the 1B/3B mappings in the calculation of scattering intensities. The SAS profile of each frame from MD trajectories was calculated at atomic and coarse-grained resolution, for 201 q values ranging from 1 × 10⁻¹⁰ to 0.5 Å–1. (A) Average and standard deviation on 6442 GSN frames of the SAXS residuals between MT and AA (green) and between 1B and AA (orange). (B) Average and standard deviation on 7256 12-mer RNA frames of the SAXS residuals between MT and AA (green) and between 3B and AA (orange). (C) Average and standard deviation on 6442 GSN frames of the SANS residuals between 1B and AA (orange). (D) Average and standard deviation on 7256 12-mer RNA frames of the SANS residuals between 3B and AA (orange).
Figure 3
Figure 3
Solvation layer contribution in the 1B/3B SAXS intensity calculation. (A) Upper panel: logarithm of the SAXS profile of a representative, randomly selected, GSN frame calculated using 1B mapping (blue), 1B mapping with the best combination of SLC (0.08) and SC (0.6 nm2) found for this frame (orange), and using WAXSiS (black). Bottom panel: residuals of 1B (blue) and 1B with SLC (orange) using the WAXSiS intensity as the reference. (B) Upper panel: logarithm of the SAXS profile of a representative, randomly selected, 12-mer RNA frame calculated using 3B mapping (blue), 3B mapping with the best combination of SLC (0.120) and SC (1.0 nm2) found for this frame (orange), and using WAXSiS (black). Bottom panel: residuals of 3B (blue) and 3B with SLC (orange) using the WAXSiS intensity as the reference. All of the SAXS intensities were calculated for 101 q values, up to 0.3 Å–1.
Figure 4
Figure 4
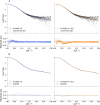
Agreement between hySAS, experimental SAXS data, and WAXSiS for the gelsolin ensembles. (A) Left panel: comparison between the logarithm of the average GSN SAXS profile calculated using 1B mapping without SLC (blue) and the logarithm of the experimental SAXS data (black dots). Right panel: comparison between the logarithm of the average GSN SAXS profile calculated using 1B mapping with SLC (orange) and the logarithm of the experimental SAXS data (black dots). (B) Left panel: comparison between the logarithm of the average GSN SAXS profile calculated using 1B mapping without SLC (blue) and the logarithm of the average WAXSiS profile (black dashed line). Right panel: comparison between the logarithm of the average GSN SAXS profile calculated using 1B mapping with SLC (orange) and the logarithm of the average WAXSiS profile (black dashed line). All of the residuals are calculated as the difference between the two intensities considered.
Figure 5
Figure 5
Radius of gyration and probability density histograms of GSN ensembles. The probability density distribution of the radius of gyration was calculated over 10,000 frames obtained using hySAS with SLC, colored in orange, while the distribution calculated over 10,000 frames obtained using hySAS without SLC is colored in blue. The area under each histogram integrates to 1.
Figure 6
Figure 6
RMSF analysis of the GSN ensemble (with SLC). The flexibility of the protein was assessed by calculating the root-mean-square fluctuation of all residues. The residue numbering sequence on the x-axis includes the N-terminal His6-tag (from −23 to −1) and the full-length human plasma isoform of GSN (1 to 755). The domains sharing the highest sequence and structural similarity are shown with the same color code: G1 and G4 are colored in orange, G2 and G5 in purple, and G3 and G6 in blue. The linkers and tails are colored in light gray, while the His6-tag is colored in yellow. On the left, 50 equidistant frames from the analyzed trajectories are superimposed as a representative example of the conformational ensemble. The GSN structure on the right is that obtained by X-ray crystallography (PDB ID: 3FFN).
Figure 7
Figure 7
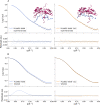
Comparison between hySAS, experimental SAXS data, and WAXSiS for UP1-RNA complex models. (A) Left panel: comparison between the logarithm of the protein–RNA complex SAXS intensity calculated using 1B/3B mapping without SLC (blue) and the logarithm of the experimental SAXS data (black dots). Right panel: comparison between the logarithm of the protein–RNA complex SAXS intensity calculated using 1B/3B mapping with the SLC (orange) and the logarithm of the experimental SAXS data (black dots). The upper right section of each panel shows the protein–RNA complex frame responsible for the relative intensity profile (purple/cartoon representation for UP1, blue/ribbon representation for 12-mer RNA). (B) Left panel: comparison between the logarithm of the protein–RNA complex SAXS intensity calculated using 1B/3B mapping without SLC (blue) and the logarithm of the WAXSiS profile (black dashed line). Right panel: comparison between the logarithm of the protein–RNA complex SAXS intensity calculated using 1B/3B mapping with the SLC (orange) and the logarithm of the WAXSiS profile (black dashed line). All of the residuals are calculated as the difference between the two intensities considered.

References

    1. Tuukkanen A. T.; Spilotros A.; Svergun D. I. Progress in small-angle scattering from biological solutions at high-brilliance synchrotrons. IUCrJ. 2017, 4 (5), 518–528. 10.1107/S2052252517008740. - DOI - PMC - PubMed
    1. Koch M. H. J.; Vachette P.; Svergun D. I. Small-angle scattering: a view on the properties, structures and structural changes of biological macromolecules in solution. Q. Rev. Biophys. 2003, 36 (2), 147–227. 10.1017/S0033583503003871. - DOI - PubMed
    1. Kikhney A. G.; Svergun D. I. A practical guide to small angle X-ray scattering (SAXS) of flexible and intrinsically disordered proteins. FEBS Lett. 2015, 589 (19 Pt A), 2570–2577. From NLM.10.1016/j.febslet.2015.08.027. - DOI - PubMed
    1. Naudi-Fabra S.; Tengo M.; Jensen M. R.; Blackledge M.; Milles S. Quantitative Description of Intrinsically Disordered Proteins Using Single-Molecule FRET, NMR, and SAXS. J. Am. Chem. Soc. 2021, 143 (48), 20109–20121. 10.1021/jacs.1c06264. - DOI - PMC - PubMed
    1. Stelzl L. S.; Pietrek L. M.; Holla A.; Oroz J.; Sikora M.; Köfinger J.; Schuler B.; Zweckstetter M.; Hummer G. Global Structure of the Intrinsically Disordered Protein Tau Emerges from Its Local Structure. JACS Au 2022, 2 (3), 673–686. 10.1021/jacsau.1c00536. - DOI - PMC - PubMed